


1. Introduction
With the rapid evolution of financial markets, traditional analytical methods often struggle to keep pace with market changes and complexities. Simultaneously, the advent of artificial intelligence has significantly impacted pricing and trading across the financial market. Traditional asset pricing and quantitative trading require extensive manual analysis and research, coupled with significant time investments to reflect in market price trends [1]. This time lag undermines the effective market hypothesis[2]. However, the technology of using AI for data analysis and sentiment assessment offers a new perspective and method to understand and predict market dynamics. This technology showcases a new possibility by significantly reducing the time lag between information occurrence and price changes, thus enhancing market efficiency more quickly.
In this paper, I explore the impact of the Federal Reserve (Fed) on financial markets, particularly by using the advanced AI analysis model, FinGPT, to evaluate the sentiment of Fed meeting minutes and analyze how these sentiment scores predict market trends[3].
This study introduces the FinGPT model, a large language model specifically designed for financial text analysis, utilizing the Transformer architecture to process and analyze vast amounts of financial data. Through this method, I can not only accurately extract sentiment fluctuations from historical data but also predict how these sentiments influence market performance. This paper conducts an in-depth analysis of Fed meeting minutes from 1990 to 2020 using FinGPT to construct a sentiment-based single-factor trading strategy. The goal of this research is to validate the effectiveness of this strategy through quantitative trading and backtesting analysis, especially in different market environments and economic cycles. By comprehensively analyzing key market data such as the S&P 500 Index, real estate, and financial sector indices, this paper assesses how the Fed’s sentiment practically affects market dynamics. It explores how market applicability is influenced by market type and economic environment and suggests potential directions for future strategy optimization. These analyses not only enhance the understanding of market dynamics but also provide valuable insights and methods for market analysis and decision-making using AI and big data technologies.
2. Model
The AI model used in this study is FinGpt. FinGPT is an open-source large language model designed specifically for the financial domain. It adopts a Transformer-based architecture aimed at facilitating innovation and application in the financial technology field by providing extensive data access and processing capabilities[4]. Unlike traditional proprietary financial models like BloombergGPT, FinGPT emphasizes openness and transparency, allowing researchers and developers to freely access and utilize the model for research and development purposes. FinGPT focuses on data collection, cleaning, and preprocessing through a data-centric approach to ensure data quality and model effectiveness. Additionally, FinGPT employs lightweight low-rank adaptation techniques (LoRA) and reinforcement learning with human feedback (RLHF) to reduce training costs[5]. In this study, FinGpt was used to assist in sentiment analysis, analyzing the Federal Reserve’s meeting records to output attitude scores, aiding investors in a more precise understanding of market sentiment.
This study explores the impact of the Federal Reserve (Fed) on the financial markets, particularly by evaluating the sentiment attitude of Fed meeting records through advanced artificial intelligence analysis models—FinGPT, and analyzing how these attitude scores predict market trends. With the rapid evolution of financial markets, traditional analytical methods often struggle to keep up with the pace and complexity of market changes. Therefore, utilizing artificial intelligence for data analysis and sentiment evaluation provides a new perspective and approach to understand and predict market dynamics.
This research introduces the FinGPT model, which is a large language model designed specifically for financial text analysis, utilizing Transformer architecture to process and analyze large amounts of financial data. Through this approach, I can accurately extract sentiment fluctuations from historical data and predict how these sentiments affect market performance. By conducting in-depth analysis of Fed meeting records from 1990 to 2020, a sentiment-based single-factor trading strategy is constructed.
The aim is to validate the effectiveness of this strategy through quantitative trading and backtesting analysis, particularly in different market environments and economic cycles. By comprehensively analyzing key market data such as the S&P 500 index, real estate, and financial industry indices, this study evaluates how the Federal Reserve’s attitude actually influences market dynamics, explores how market applicability is affected by market types and economic environments, and suggests possible directions for future strategy optimization. These analyses not only enhance understanding of market dynamics but also provide valuable insights and methods for using AI and big data technologies for market analysis and decision-making.
3. Empirical Result
3.1. Data
3.1.1. Federal Reserve Meeting Minutes
The primary data for this analysis comprises the Federal Reserve meeting minutes from 1990 to 2020 [6]. This period was selected because it spans multiple economic cycles and significant economic events, including the early 1990s recession, the dot-com bubble, the 2007-2008 global financial crisis, and the 2020 COVID-19 pandemic. The meeting minutes detail the Federal Reserve’s assessments of current and future economic conditions, making them a crucial data source for evaluating its impact on market sentiment.
3.1.2. Index Data
(1) S&P 500 Index: The S&P 500 index data, covering the period from 1990 to 2020, provides a broad perspective on the U.S. stock market and is a key indicator for assessing overall market performance. The data, sourced from Yahoo Finance, includes daily open, close, high, and low prices.
(2) Real Estate Index: The analysis of the real estate market uses the Fred National Home Price Index, covering data from 1990 to 2020. Although this index mainly reflects house price changes and does not include financial products like Real Estate Investment Trusts (REITs), it provides robust data support for evaluating long-term trends in the real estate market.
(3) Financial Sector Index: For the financial index, I sourced data directly from Yahoo Finance, covering the period from 1999 to 2024. This index provides a clear reflection of the financial market’s development over time.
3.1.3. Sentiment Data
Using the FinGPT model, sentiment analysis was performed on the Federal Reserve’s meeting minutes from 1990 to 2020, resulting in sentiment scores. These scores were then compared with market data to assess how the Federal Reserve’s sentiment influenced market performance. Sentiments were classified into positive, negative, and neutral categories. The use of deep learning techniques in the AI model improved the speed and accuracy of data analysis [7].
3.2. Results
3.2.1. Analysis of Financial Sector Results
After preparing all the data, the sentiment data and industry data were aligned along a timeline. For the financial sector, this alignment allows for the creation of the following analysis, as shown in Figure 1.
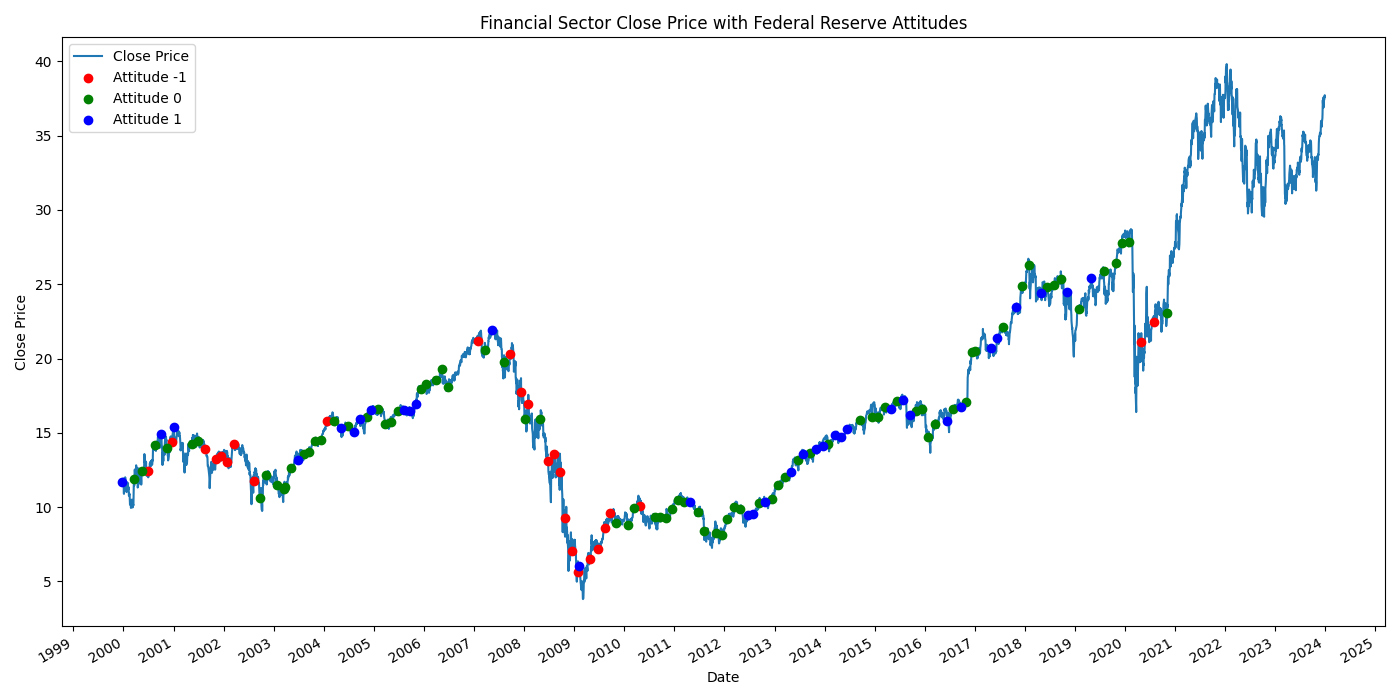
Figure 1: Price Curve of the Financial Sector and Federal Reserve Sentiment
After cleaning and merging the financial sector data with the Federal Reserve sentiment data, I represented negative sentiment in red, neutral in green, and positive in blue. It can be observed that the sentiment somewhat follows the trend of the index. This suggests that the Federal Reserve sentiment factor might be effective, prompting the need for backtesting to evaluate the factor’s effectiveness.
To begin, I need to develop a simple strategy based on this factor: buying when the sentiment is positive and selling when the sentiment is negative. This strategy allows for an assessment of the factor’s impact. By applying this strategy, I can compare the capital curve with the index trend. The resulting data is shown in the figure below, where the blue line represents the capital curve and the yellow line represents the market curve.
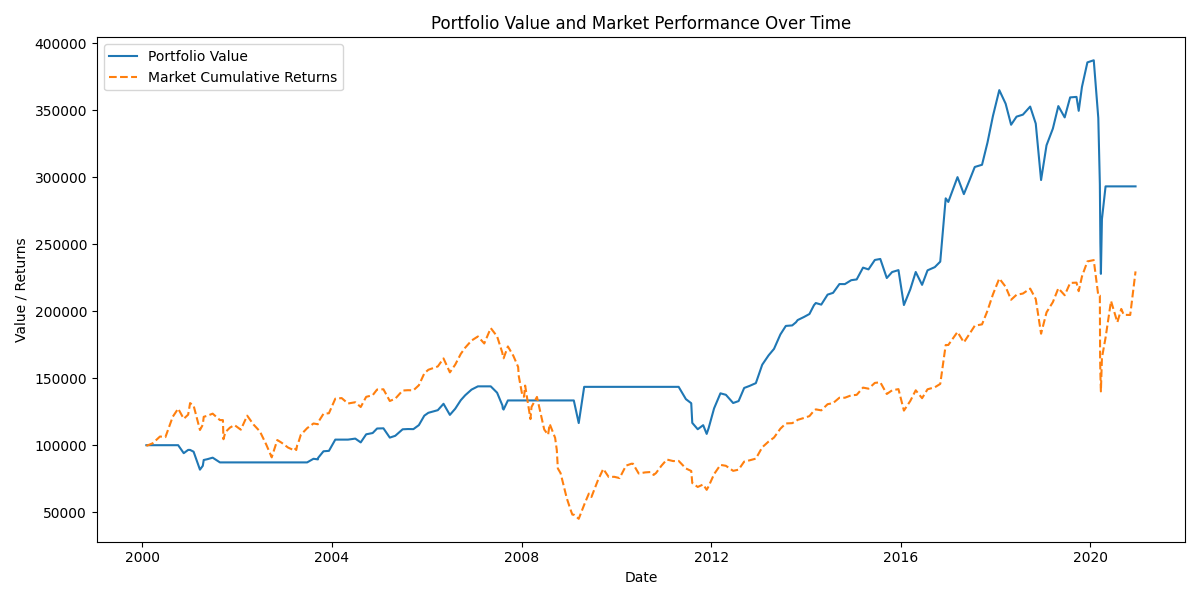
Figure 2: Comparison of Financial Sector Price Curve and Investment Capital Curve
According to Figure 2, from 2000 to 2020, this strategy, with an initial investment of $100,000, ultimately achieved a return of $293,231.86, an annualized return rate of 3.55%. This performance surpassed the market by 63.49%, with a maximum drawdown of 41.16%, demonstrating a Sharpe ratio of 2.15 and a portfolio standard deviation of 0.046830.
From such results, it appears that the factor itself is effective, but it also has its own issues. I can easily observe from Figure 2 that during the period from 2000 to 2008, the performance of the factor itself was not good. However, during the 2008 economic crisis, the factor remained in a nearly one-and-a-half-year cash position, avoiding the entire downturn phase and effectively preserving profits. From 2012 to 2020, as the market trend officially began to rise, the factor quickly diverged from the market trend. However, in 2020, there was a significant drawdown of approximately 41.16% in the strategy. Looking back at the events that occurred during that time, I discovered that this period corresponded to the four circuit breakers in the United States during the COVID-19 pandemic[7]. During this period, the Dow Jones Industrial Average fell by 37%, the S&P 500 Index fell by 34%, and the Nasdaq Composite Index fell by 30% from late February to late March. The entire process took only one month, with the four circuit breakers occurring on March 9, March 12, March 16, and March 18. From this performance, I can infer that overall, this factor has predictive power for long-term economic downturns and crises. However, it cannot avoid losses in extreme market conditions. I can easily deduce the reasons for the formation of the entire factor. As the central bank of the United States, the Federal Reserve naturally has its own more practical views on the U.S. economy. However, the Federal Reserve cannot predict the occurrence of black swan events in the market, and its monthly Federal Reserve meetings cannot timely respond to the possible birth of black swan events.
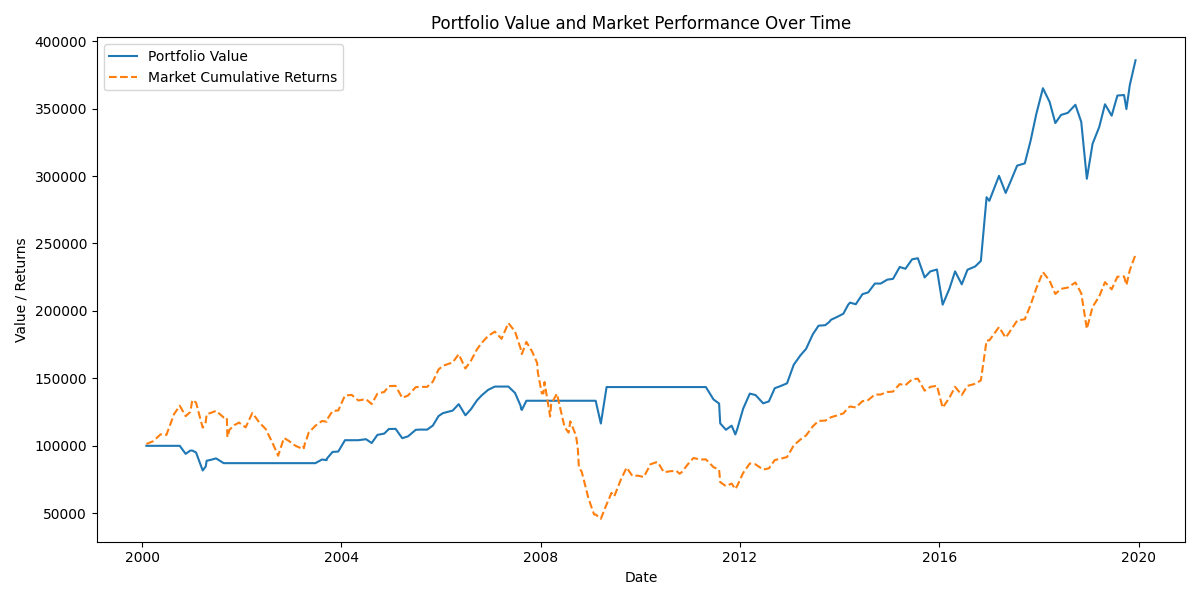
Figure 3: Comparison of Financial Sector Price Curve and Investment Capital Curve (Excluding Black Swan Events)
For potential black swan events, I have various methods to assess their likelihood. However, in the context of this strategy, it is more crucial to understand how the strategy performs without black swan events. Therefore, I need to exclude the periods affected by circuit breakers from the backtest to evaluate the overall performance. By setting the backtest timeframe from January 1, 2000, to January 1, 2020, to avoid the impact of the circuit breakers, the results are shown in Figure 3. I found the strategy’s performance significantly improved: starting with an investment of $100,000, it achieved a return of $385,809.61, an annualized return rate of 4.63%. While outperforming the market by 148.59%, the portfolio experienced a maximum drawdown of 24.66% and demonstrated a Sharpe ratio of 2.97 with a standard deviation of 0.042813.
This indicates that when excluding the impact of black swan events, the overall strategy’s performance improves significantly, showcasing the factor’s effectiveness.
3.2.2. Analysis of Real Estate Sector Results
Using the same steps, I began backtesting for the real estate sector and the S&P 500 Index. Similar to the previous analysis, I obtained sentiment data related to the real estate sector, as shown in Figure 4.
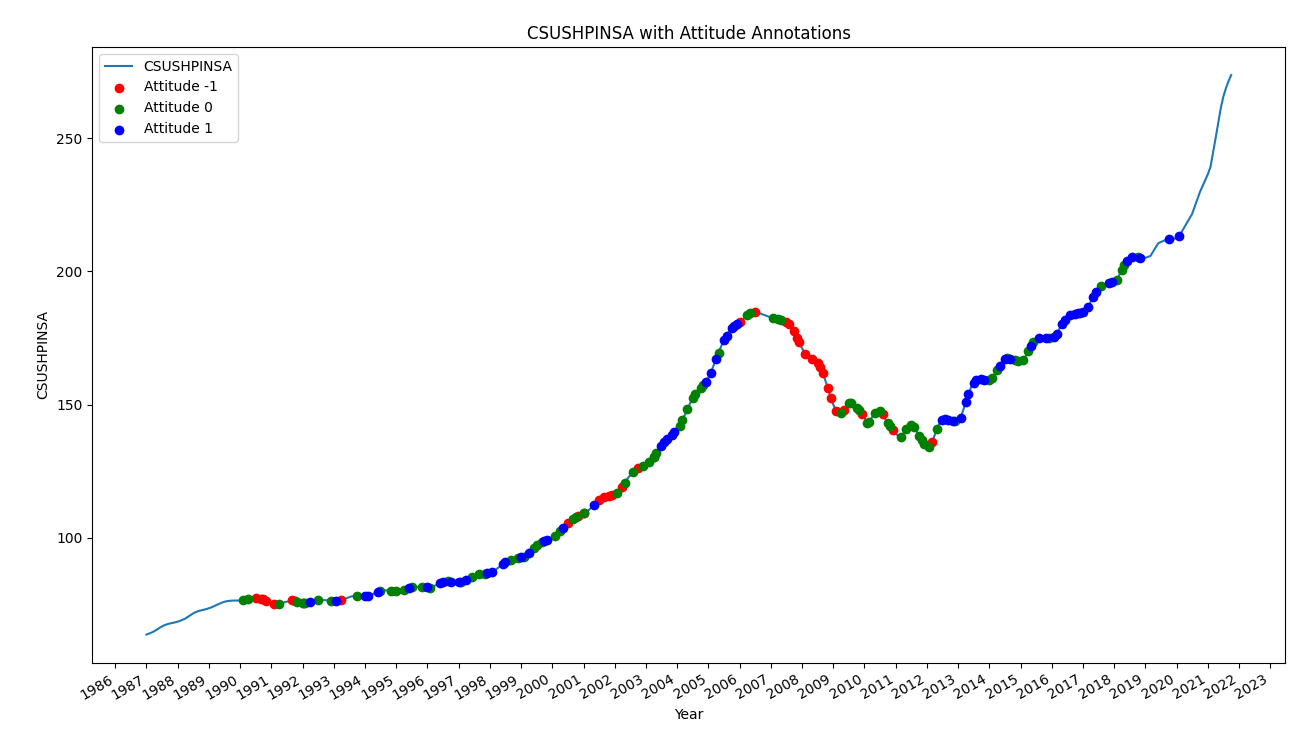
Figure 4: Real Estate Index Price Curve and Federal Reserve Sentiment
From the figure above, it is evident that in the real estate market, sentiment points do not track the overall price trend as effectively as they do in the financial sector. Often, even when the market is on an upward trajectory, the sentiment sometimes indicates negative results. I performed a backtest on these results, which yielded the following outcome shown in Figure 5.
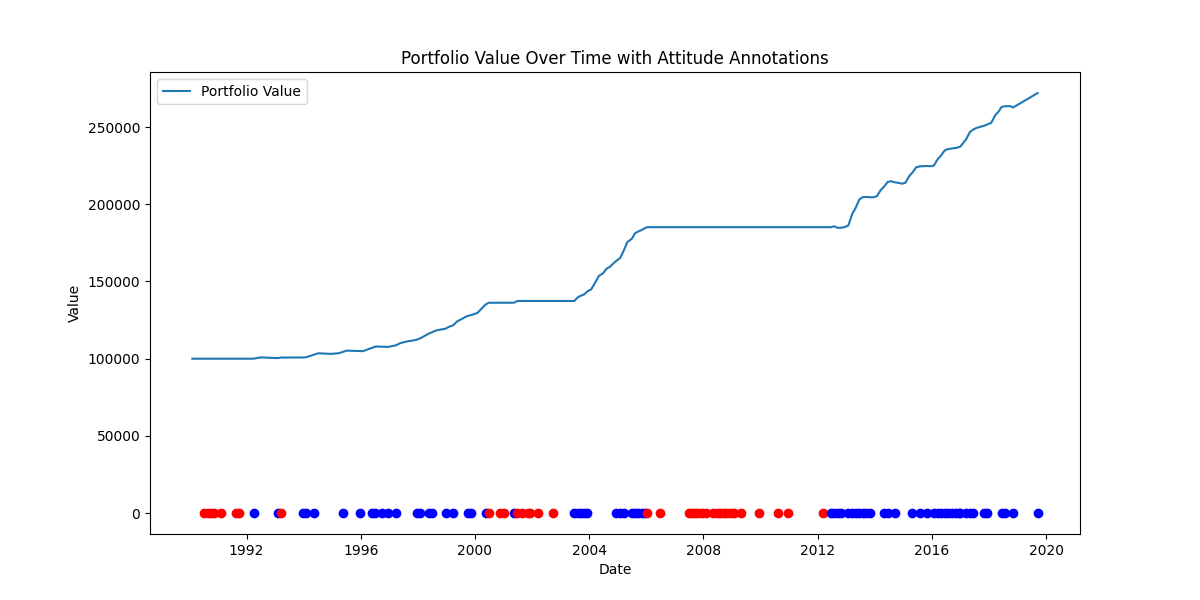
Figure 5: Real Estate Investment Capital Curve
Starting with an initial investment of $100,000, the strategy ultimately returned $272,051.62, achieving an annualized return rate of 3.40%. Although the portfolio underperformed the market by 60.53%, it exhibited a minimal maximum drawdown of just 0.72%, indicating a very high risk-adjusted return rate, reflected by a Sharpe ratio of 9.83 and a portfolio standard deviation of 0.008192.
Overall, it appears that while the factor does not track the real estate market as effectively as it does the financial market, it is more effective in controlling maximum drawdown. The graphical comparison indicates that the factor effectively controls drawdown during significant market declines. However, during the periods of rising house prices in 1991 and 2002, the factor still showed negative sentiment, which is the main reason for its underperformance compared to the broader market.
3.2.3. S&P 500 Results Analysis
Next, I conducted a backtest for the S&P 500. The sentiment performance is shown in Figure 6.
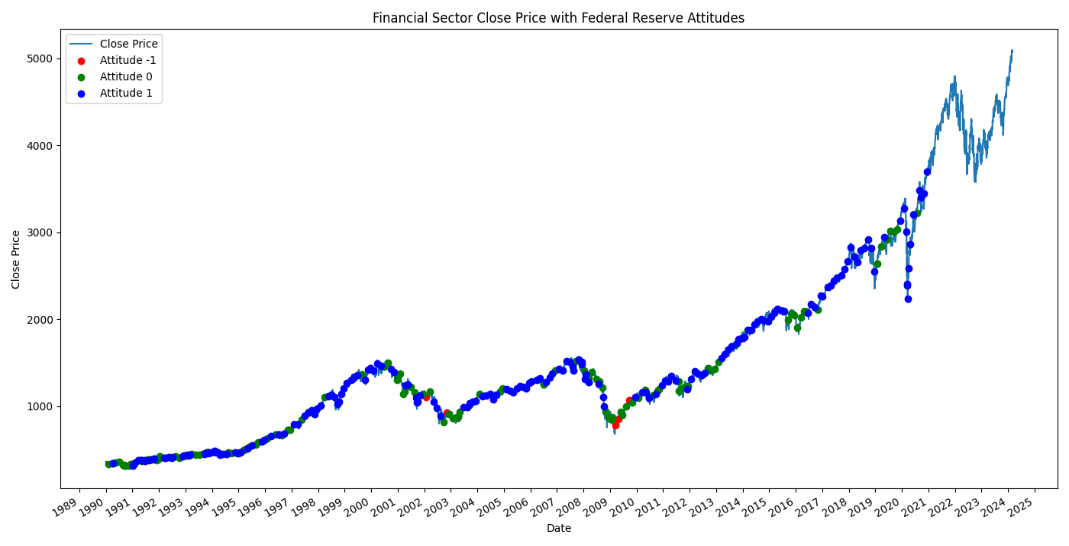
Figure 6: S&P 500 Index Curve and Federal Reserve Sentiment
This figure reveals a general pattern: the Federal Reserve has only given negative attitudes towards the entire U.S. economy twice in the past 30 years, during the dot-com bubble in 2000 and at the end of the 2008 economic crisis. This infrequent negative sentiment suggests potential data distortion and implies that the corresponding performance of the capital curve might deteriorate.
Using the sentiment data, the backtest results are shown in Figure 7.
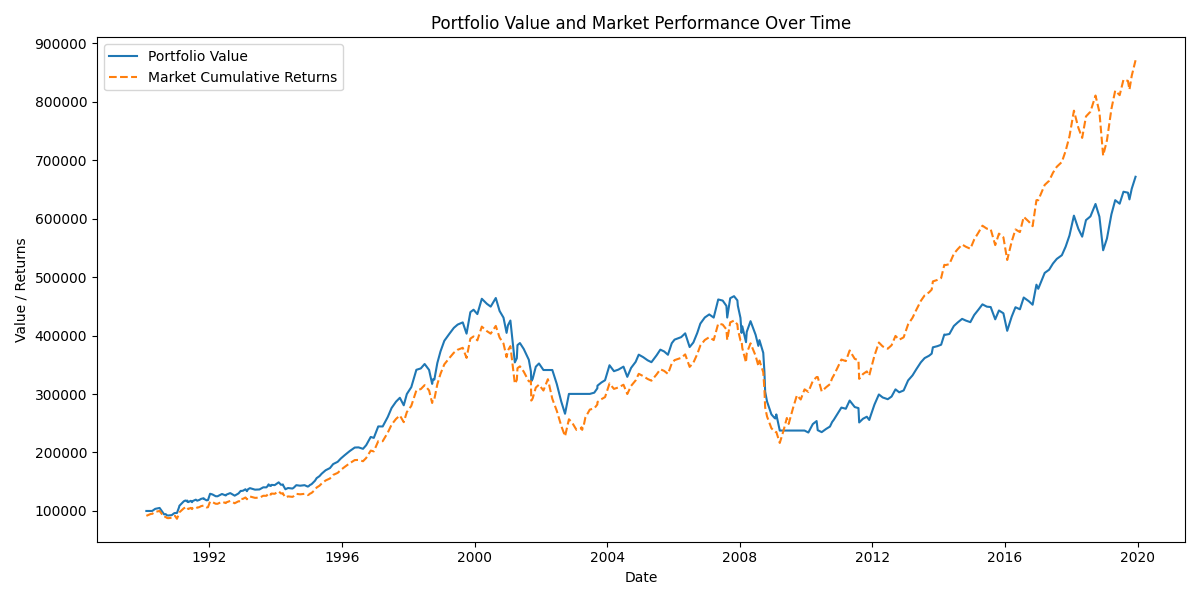
Figure 7: S&P 500 Price Curve and Capital Curve
In the graph shown in Figure 7, the blue line represents the fund curve, while the yellow line represents the market curve. The strategy yielded a return of $671,603.66 from an initial investment of $100,000, with an annualized return rate of 6.59%. Despite a relative underperformance of 199.29% compared to the market, it maintained a maximum drawdown of 49.90% and exhibited a Sharpe ratio of 2.89 and a portfolio standard deviation of 0.038022.
Through Figure 7, it is evident that the factor did not perform well in the S&P 500 index. It did not avoid the two major downturns in 2000 and 2008, and it lagged behind during the bull market following the end of the 2008 financial crisis.
Across the three markets of finance, real estate, and the S&P 500 index, the single-factor strategy demonstrated significant differentiation in performance. Particularly in the finance industry, the strategy not only effectively avoided risks but also closely followed the upward trend of the market, demonstrating outstanding adaptability and foresight, making it the best performer among the three. In the real estate market, the strategy was able to track market trends to a certain extent. Although it occasionally paused trading during normal market operations, which may have caused slight deviations from market performance, overall it remained robust. As for the S&P 500 index, although the strategy’s performance in predicting or avoiding major market adjustments was not ideal and occasionally appeared passive, it provided valuable feedback for future strategy improvements.
4. Conclusion
In this study, I explored how the sentiment of the Federal Reserve can be assessed through the FinGPT language model and used to predict market trends, particularly in the financial market, real estate market, and the S&P 500 index. The results of the research show that while the Fed’s sentiment scores have significant predictive value in the financial industry, effectively avoiding major market adjustments and closely following market uptrends, its performance is relatively weaker in real estate and broader stock market indices. This difference reveals the complex relationship between Fed sentiment and market performance, as well as the potentially significant differences in market sensitivity and response to policy signals across different markets.
Through in-depth analysis of data from 1990 to 2020, this study not only validates the applicability and effectiveness of a single-factor strategy in different market environments but also highlights the challenges that predictive models may face during extreme market events (such as financial crises and pandemic-induced market disruptions). Particularly during the COVID-19 pandemic in 2020, despite the Fed’s assessments having some predictive value for the market, its response to the sudden market collapse was inadequate, indicating the limitations of the model in extreme situations[8].
Furthermore, the current single-factor strategy is still relatively rudimentary, and continuous optimization is necessary. Future research could explore integrating more macroeconomic indicators and market sentiment analyses to enhance the adaptability and predictive accuracy of the model under different market conditions. Additionally, further development and refinement of strategies, such as adjusting trading frequencies and entry timing, may improve the strategy’s performance and robustness across various market environments.
Overall, this study not only enhances understanding of the dynamics of financial markets but also provides valuable insights and methods for market analysis and decision-making using AI and big data technologies.
References
[1]. Ai, H., & Bansal, R. (2018). Risk preferences and the macroeconomic announcement premium. Econometrica, 86(4), 1383-1430.
[2]. Malkiel, B. G. (1989). Efficient Market Hypothesis. In J. Eatwell, M. Milgate, & P. Newman (Eds.), Finance. The New Palgrave (pp. 1-20). Palgrave Macmillan, London. https://doi.org/10.1007/978-1-349-20213-3_13
[3]. Rigobon, R., & Sack, B. (2004). The impact of monetary policy on asset prices. Journal of Monetary Economics, 51(8), 1553-1575. https://doi.org/10.1016/j.jmoneco.2004.02.004
[4]. Lee J, Stevens N, Han S C, et al. A survey of large language models in finance (finllms)[J]. arXiv preprint arXiv:2402.02315, 2024.
[5]. Wang, N., Yang, H., & Wang, C. D. (2023). Fingpt: Instruction tuning benchmark for open-source large language models in financial datasets. arXiv preprint arXiv:2310.04793.
[6]. Federal Reserve. (n.d.). Historical Materials by Year. Retrieved May 29, 2024, from https://www.federalreserve.gov/monetarypolicy/fomc_historical_year.htm
[7]. Antipova, T. (2021). Coronavirus Pandemic as Black Swan Event. In T. Antipova (Ed.), Integrated Science in Digital Age 2020. ICIS 2020. Lecture Notes in Networks and Systems, vol 136. Springer, Cham. https://doi.org/10.1007/978-3-030-49264-9_32
[8]. Morales, L., & Andreosso-O'Callaghan, B. (2020). Covid19: Global Stock Markets “Black Swan.” Critical Letters in Economics & Finance, 1(1), Article 1. https://doi.org/10.21427/gv7k-1c77. Retrieved from https://arrow.tudublin.ie/clef/vol1/iss1/1
Cite this article
Chen,S. (2024). Quantitative Strategies Based on FinGPT’s Analysis of the Federal Reserve’s Attitude. Advances in Economics, Management and Political Sciences,90,82-90.
Data availability
The datasets used and/or analyzed during the current study will be available from the authors upon reasonable request.
Disclaimer/Publisher's Note
The statements, opinions and data contained in all publications are solely those of the individual author(s) and contributor(s) and not of EWA Publishing and/or the editor(s). EWA Publishing and/or the editor(s) disclaim responsibility for any injury to people or property resulting from any ideas, methods, instructions or products referred to in the content.
About volume
Volume title: Proceedings of the 3rd International Conference on Financial Technology and Business Analysis
© 2024 by the author(s). Licensee EWA Publishing, Oxford, UK. This article is an open access article distributed under the terms and
conditions of the Creative Commons Attribution (CC BY) license. Authors who
publish this series agree to the following terms:
1. Authors retain copyright and grant the series right of first publication with the work simultaneously licensed under a Creative Commons
Attribution License that allows others to share the work with an acknowledgment of the work's authorship and initial publication in this
series.
2. Authors are able to enter into separate, additional contractual arrangements for the non-exclusive distribution of the series's published
version of the work (e.g., post it to an institutional repository or publish it in a book), with an acknowledgment of its initial
publication in this series.
3. Authors are permitted and encouraged to post their work online (e.g., in institutional repositories or on their website) prior to and
during the submission process, as it can lead to productive exchanges, as well as earlier and greater citation of published work (See
Open access policy for details).
References
[1]. Ai, H., & Bansal, R. (2018). Risk preferences and the macroeconomic announcement premium. Econometrica, 86(4), 1383-1430.
[2]. Malkiel, B. G. (1989). Efficient Market Hypothesis. In J. Eatwell, M. Milgate, & P. Newman (Eds.), Finance. The New Palgrave (pp. 1-20). Palgrave Macmillan, London. https://doi.org/10.1007/978-1-349-20213-3_13
[3]. Rigobon, R., & Sack, B. (2004). The impact of monetary policy on asset prices. Journal of Monetary Economics, 51(8), 1553-1575. https://doi.org/10.1016/j.jmoneco.2004.02.004
[4]. Lee J, Stevens N, Han S C, et al. A survey of large language models in finance (finllms)[J]. arXiv preprint arXiv:2402.02315, 2024.
[5]. Wang, N., Yang, H., & Wang, C. D. (2023). Fingpt: Instruction tuning benchmark for open-source large language models in financial datasets. arXiv preprint arXiv:2310.04793.
[6]. Federal Reserve. (n.d.). Historical Materials by Year. Retrieved May 29, 2024, from https://www.federalreserve.gov/monetarypolicy/fomc_historical_year.htm
[7]. Antipova, T. (2021). Coronavirus Pandemic as Black Swan Event. In T. Antipova (Ed.), Integrated Science in Digital Age 2020. ICIS 2020. Lecture Notes in Networks and Systems, vol 136. Springer, Cham. https://doi.org/10.1007/978-3-030-49264-9_32
[8]. Morales, L., & Andreosso-O'Callaghan, B. (2020). Covid19: Global Stock Markets “Black Swan.” Critical Letters in Economics & Finance, 1(1), Article 1. https://doi.org/10.21427/gv7k-1c77. Retrieved from https://arrow.tudublin.ie/clef/vol1/iss1/1