


1. Introduction
The Disney Company is one of the largest entertainment and media companies in the world, and its industry development history and current situation reflect the process of transformation from traditional entertainment to digital [1-3]. Walt Disney Company’s history dates back to the early 20th century, when it was founded by Walt Disney and initially focused on the production of animated films [4]. With the passing of time, Disney gradually expanded its business scope to cover movies, theme parks, toys, games and other fields, becoming a leader in the global entertainment industry [5-8]. Entering the 21st century, the Disney Company faced huge changes in the industry, especially the rise of digitalization and streaming services. Disney's streaming service, Disney+, reached 73.7 million subscribers, showing the potential of the company in its digital transformation [9]. This year, Disney was saved by the huge growth of its streaming business, which grew 80% year-over-year, making direct-to-consumer and international business the second-largest source of revenue for Disney [10].
In order to address financial challenges and seize the opportunities of digital transformation, Disney has taken a series of measures, including issuing bonds and adjusting its business structure [11-15]. Although the streaming service is still burning through cash, Disney's cash reserves and liabilities show that the company remains financially strong. In addition, Disney has adjusted the way the business is aggregated in its financial results to better reflect the revenue of its important businesses such as derivatives licensing and content licensing.
It was founded by founder Walt Disney in 1923. Disney has many brands, some of them have worked with award-winning filmmaker Jerry Bruckheimer more than 10 times. Disney has a distribution partnership with Ghibli. Moreover, the Walt Disney Company owns Disneyland Resort, Walt Disney World, and licenses in many countries. On February 2, 2024, the Walt Disney Company announced that Disney+ would launch on Apple's Apple Vision Pro on the same day. Buffett's comments about Disney in the 1930s and 1940s focused largely on the uniqueness of its animation offering, arguing that Disney was unique in providing animation, which was very good. However, he also pointed out that times are different now, and the number of viewers and duration of viewing will not increase as dramatically as in the past. This shows that Buffett's view of Disney has changed over time, and although he initially gave high marks to Disney's animation capabilities, he also recognized the changing market environment.
In order to make people's competitive relations and investment choices in the film and television industry more smooth, this research is very necessary. In the second section that follows, the source of the data, the companies selected, the reasons for selecting these comparison companies, the time frame of the data selected, and the calculation method are described. The third section will use the data for financial analysis, resulting in an explanation and some investment implications. At the same time, it will also explain the research limitations and prospects of this paper. The fourth section will summarize the whole paper.
2. Data and Method
All data is from https://www.nasdaq.com and https://www.estimize.com.And the three competing companies are Netflix, Warner Bros and SONY. All relevant data was selected on June 10, 2024. The reasons for choosing these comparison companies are as follows. For DIS and NFLX:
• Market positioning and business model. Disney+ is launched as a "happy dream maker" and a "family streaming media platform". Moreover, Disney recently surpassed 100 million media subscriptions, indicating its initial success in expanding into the now-hot industry of streaming media. By contrast, Netflix is a full-fledged movie platform with high-quality drama aimed at adults.
• IP and brand effect. Disney owns the Marvel Universe, Star Wars, Disney Princess series and other well-known IP, forming an ecosystem including media networks, park resorts, film and television, as well as consumer and interactive entertainment. While Netflix isn’t as good as Disney in terms of IP and branding.
• Long-term investment appeal: Based on long-term growth, revenue and net income estimates, Netflix is less undervalued than Disney. The average analyst price target for Netflix is higher than its current share price, indicating optimism about its future growth. Disney's streaming business is expected to add to the company's net income by the end of 2024, thereby increasing earnings per share, making it seem more attractive to long-term investment.
For traditional film Industry competition:
• Film and Television. Disney, through its subsidiaries such as Disney Pictures and Lucasfilm, has well-known IP, as well as strong animation production capabilities. Warner Bros. owns "Harry Potter," "DC" and other well-known IP. SONY Pictures is known for IP for characters in the Spider-Man series and the Avengers, which are also well known in the film industry.
• Game field. Disney and Warner Bros. have launched games based on their respective movie and TV IP (Star Wars series and 'Harry Potter series). SONY has produced franchises such as Final Fantasy and Uncharted, and competes with Microsoft's Xbox in the console space.
• Theme Park Disney has several theme parks around the world, which feature Disney movies and animated characters.
• Brand value and market influence. The three companies have a broad market and IP effect.
As the COVID-19 ended, the global entertainment economy began to recover. As one of the top film and television companies in the world, Disney has a wide audience and a relatively perfect corporate management system. Also, Disney recently surpassed 100 million media subscriptions, indicating its success in expanding into streaming media, with low-cost advantages. The upside for Disney stock is its superior economic moat, long history of profitability. The media company Netflix, classic firm studios Warner Bros and SONY have all released big hits in recent years. In addition, SONY and Disney have had changes in senior leadership. So, one can picked out these three competitors from a variety of perspectives. The four companies’ basic information are given in Table 1.
Table 1: Four companies’ basic information.
Company | DIS | NFLX | WBD | SONY |
Market Cap (in Billion) | 185.1 | 276.4 | 20.3 | 104.3 |
Industry | Entertainment programming, Theme parks, Toys,Books, Video games and Media networks | Movies, Entertainment videos, and Video games | Film and television entertainment production | Production and distribution of films and television programs and digital entertainment programs |
Main Products | Cartoon, film and television, theme parks and their derivatives | Online movie rental services, self-made online dramas and exclusive peripheral clothing related to the works released on the platform | Movies, TV dramas, and related consumer goods and peripheral products | TV series, movies, TV variety shows, franchise products, digital production, animated films, online games, digital products |
Other Competing Factors | Amazon; Comcast Corporation; Universal Picture; Paramount Picture | |||
The calculation evaluation metrics are listed as follow: EPS = Net Income/Shares Outstanding, TTM=sum most recent four quarter, NTM=sum next four quarter. The higher the value of this index, the more profit can be obtained per share, the better the investment efficiency of shareholders, and the worse it is. Therefore, there is no fixed standard of "normal" data, as it will vary based on the specific financial situation of the company and the industry average. It means the rate of after-tax profit to total share capital or the corporate net profit or net loss that common shareholders can enjoy for each share held. The calculation formulae are given as follows: Growth rate=(NTM EPS-TTM EPS)/TTM EPS. To test the growth of individual stocks, the valuation is given as: P/E Ratio = Market Capitalization / Net Income= Share Price / Earnings per. In a word, the P/E ratio is as follows: <0: indicates that the company's profit is negative; 0-13: undervalued; 14-20: Normal level; 21-28: The value is overvalued; 28: indicates a speculative bubble in the stock investment. It's the ratio of the stock price divided by the earnings per share. Gross profit Margin= Gross Profit/Total Revenue. The general range of gross profit margin varies due to various factors such as industry, company size, product type and so on, and there is no uniform standard. It reflects the conversion of internal systems and value of a product after production as follows: GP/A=Gross Profit/Total Assets and PEG=TTM P/E/(100*EPS growth rate). A PEG equal to 1 indicates that the market has assigned a valuation to the stock that completely reflects the growth of future performance. If the PEG > 1, the share may be overestimated, or the market may believe that the one's performance will grow faster than the market expects. When the PEG<1, the market is underestimating the value of the stock, or the market believes that its growth may be worse. PEG ties the current value of a stock to its future growth. Net Margin=Total Assets/Total Revenue. The corporate income tax rate is statutory, the higher the income tax rate, the less the net profit.Net profit from operations as a percent of net sales or invested capital.
3. Results and Discussion
3.1. Comparison Analysis
On February 7, The Walt Disney Company (NYSE: DIS) released its fiscal 2024 first quarter report for the year ended December 30, 2023. Financial data show that in the first quarter, Disney's total revenue was about 23.549 billion US dollars, an increase of 0.16%. Net income attributable to the parent was approximately US $1.911 billion, up 49.41% year-on-year. From the perspective of revenue composition, Disney's entertainment segment revenue was about 9.981 billion US dollars in the first quarter, down 6.5% year on year; Sports segment revenue of approximately $4.835 billion, an increase of 4.2%; Experience segment revenue was approximately $9.132 billion, an increase of 6.87%. In the entertainment sector, Disney + had approximately 46.1 million domestic users (U.S. and Canada) in the first quarter, an increase of 1% sequentially; The number of international users was about 65.12 million, an increase of 1%. Disney expects a net addition of 5.5 to 6 million Disney + main subscribers. In terms of revenue composition, linear network revenue of the entertainment segment was approximately $2.803 billion, a decrease of 12%. Direct-to-consumer revenue of approximately $5,546 million, up 15% year-over-year; Content sales/licensing and other revenue was approximately $1.632 billion, down 38% year-over-year. In the sports segment, ESPN's revenue was about $4.073 billion, up 1% year over year. In the experience segment, Disney's domestic (US) parks and experiences revenue was approximately $6.297 billion in the first quarter, up 4% year on year. Disney noted that the Experiences segment set year records for revenue, operating income and margin in the first quarter of fiscal 2024.
Netflix Inc.'s (NASDAQ: NFLX) financial report for the second quarter of fiscal 2023 showed operating income of $8.187 billion, up 2.72% year-over-year, although below analyst expectations of $8.30 billion. Operating income was $1.827 billion, with an operating margin of 22.3%, roughly in line with guidance given last quarter and up from 21% growth in the previous quarter. Net income attributable to common shareholders was $1.488 billion, an increase of 3.24%, and net profit margin was 18.2%, both higher than the same period last year. Going into the third quarter, Netflix's performance was more optimistic. Revenue was $8.542 billion, up 7%, and net income was $1.677 billion, up 16%. Adjusted earnings per share were $3.73, up 17% continuously. For the fourth quarter, the company expects revenue of $8.692 billion, up 10.7% from a year ago, and earnings per share of $2.15. The highest operating margin for fiscal 2023 is 20%. Exploration (WBD) reported a 6.93% year-over-year decrease in revenue and a 9.91% decrease in net loss in the first fiscal quarter of 2024. The typical results are shown in Fig. 1 and Fig. 2.
Figure 1: The revenue of Netlifx and Disney+.
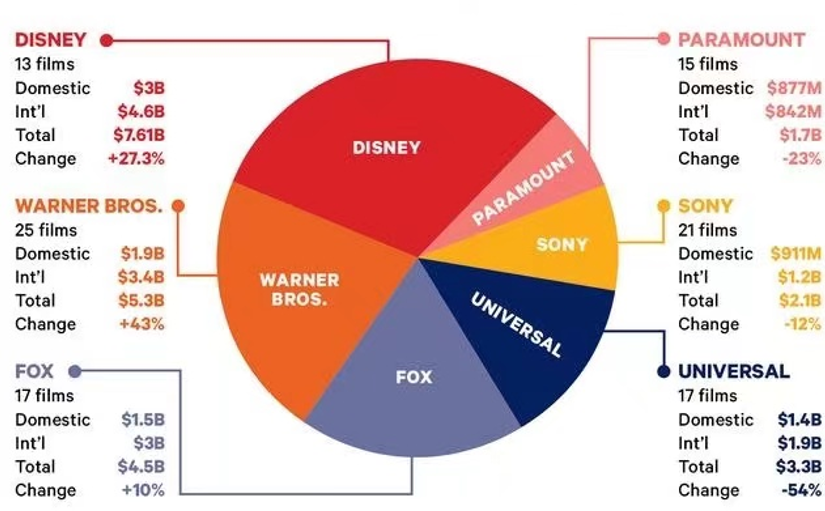
Figure 2: The competition among DIS, WBD and SONY.
Summary of the results are listed in Table 2. Warner Bros. Exploration (WBD) recently released its fiscal 2024 first quarter earnings report showing that total revenue for the quarter was $9.958 billion, down 6.93% from $10.700 billion in the same times last year. In addition, the net loss for the quarter was $955 million, compared to a net loss of $1,060 million in the same times last year, which narrowed by 9.91%. Basic earnings per share were minus $0.40, compared to minus $0.44 in the same period last year. SONY Pictures' overall results for the 2023 fiscal year show that its sales revenue reached 1,493.1 billion yen, an increase of 9% over the previous year, which was mainly driven by an increase in theatrical releases and the growth of paid Crunchyroll subscribers. Operating profit was essentially flat at 117.7 billion yen from a year earlier, indicating that SONY Pictures was able to maintain solid profitability in the face of challenges such as a decline in TV production deliveries due to the Hollywood strike and higher marketing costs for film releases. In the first quarter of fiscal 2022, SONY Pictures' sales revenue jumped 67% year on year to 341.4 billion yen. In the case of positive EPS and revenue growth rate, DIS's PEG is lower than NFLX which makes it a more attractive investment target. Besides, DIS's TTM and NTM P/E is much lower than NFLX's, which makes it a more potential investment target. Compared to NFLX, DIS’s stock price is much lower. WBD has a large decrease in P/E which indicates the company's operating condition is not good, the future profitability is weak. SONY's growth rate of total revenue and EPS is negative which meansit’s lack of impetus for development. DIS has the highest net profit margin.
Table 2: The table with specific financial data.
DIS | NFLX | WBD | SONY | |
Share Price | $101.54 | $641.47 | $8.27 | $85.45 |
EPS Growth Rate | 17.8% | 32.8% | -66.1% | -2.7% |
Revenue Growth Rate | 5.3% | 14.3% | 1.3% | -7.3% |
TTM P/E | 23.72 | 44.52 | -6.67 | 16.82 |
NTM P/E | 20.15 | 33.53 | -19.69 | 16.72 |
PEG | 1.34 | 1.36 | 0.10 | -6.10 |
GP/A | 14.4% | 28.7% | 13.7% | 9.8% |
Gross margin | 33.4% | 41.5% | 40.6% | 27.2% |
Net profit margin | 2.6% | 16.0% | -7.6% | 8.2% |
3.2. Explanation and Implications
It is through the preliminary comparison of financial data that one can basically determine that the two main investment competitors are Disney and Netflix. Disney owns well-known brands such as "Star Wars" and "Marvel Universe," which have a broad fan base around the world, giving Disney several blockbuster movie franchises that have swept the world. Disney is transiting to a platform-as-a-service (PaaS) business model that generates subscription revenue through streaming services such as Disney+, marking a shift from traditional content production to a broader range of digital media services. For sales and earnings growth, Disney's sales increased from $55.1 billion to $69.6 billion by two years, showing the annual growth rate of 9.8%. Its group has acquired a number of film and television companies. As the COVID-19 ended, the global entertainment economy began to recover. Bob Iger is returning to Disney as CEO and will retire again in 2026. In addition, the second Zootopia movie will be released in the next two years. It closes to a historically rare buying opportunity. Regarding risk factors for DIS, the uncertain sale of the ABC television network (relate to debts); the warnings that the COVID-19 outbreak and repeat; ESPN struggled with a lack of sports programming during the pandemic. Fewer live sports programs have made it difficult for ESPN to Disney's trend of losing cable subscribers.
With reason of rejection, NFLX has High GP/A, EPS, TTM P/E, NTM P/E, Stock Price. The market is concerned about its profitability: the reported earnings assumptions are considered too optimistic, which can cause the share price to fall because the market reacts when the earnings requirements of the stock are not met. Although earnings per share nearly doubled from the prior fiscal year, revenue, cash flow, and free cash flow failed to confirm this progress. Cash flow barely increased from the first quarter of fiscal 2023, which may indicate that expenses for development projects once again exceeded long-term management expectations. It also has low free cash flow yield. Netflix promises to generate a lot of cash flow, but the free cash flow yield is extremely low for the market value of the stock. In addition, free cash flow has only recently turned positive, which is not what the company expected when it first went public. For shaky dominance in the streaming market, Netflix doesn't have a franchise like Disney or Warner Bros. Discovery to ensure the success of its programming investments. That means Netflix relies on creating hit product after hit product "from scratch," a company with no franchise that doesn't have a deep moat, and the market attitude may be "so far, so good," but that uncertainty increases the risk for the stock. Moreover, it has the highest stock price.
3.3. Limitation and Prospects
Limited by my own understanding ability, this study also has limitations in the research process: one is the timeliness of data. Due to the flexibility of the market, the data selected in this article may differ from the data at the time of reading. The other is the research algorithm. The limitation of PEG valuation method mainly includes the limitation of its application scope and the dependence on the forecast of future performance growth. The PE ratio may not be appropriate for companies with volatile or loss-making earnings, as these companies' earnings data do not accurately reflect their true profitability and investment value. So, although this study collected information as possible as one can and tried to use the learned knowledge to write the paper and develop the system, there are still many deficiencies in the paper, and the system functions are not perfect enough to be improved. Please criticize and correct, so that one can learn more.
To solve the shortages of this study, the future development direction is proposed. First, one needs to expand data sources, ensure the objectivity, and try to make more deeper research, so that the research results more realistic. Second, add the practical on market investment. Third, deepen the research under the world investment theory. It is hoped that the future research can continue to in-depth analysis of financial data, and improve the shortcomings and limitations of this research. Through more comprehensive professional knowledge to make a more in-depth forecast of the development of the entire international film and television industry, so as to better serve the investment activities and market development.
4. Conclusion
To sum up, this study is mainly about analysis of Financial performances for Walt Disney based on Comparison with Netflix, Warner Bros and SONY. Through research and analysis, one finally selected Walt Disney Company as my investment target. The upside for Disney stock is its superior economic moat, long history of profitability, and the fact that the direct-to-consumer business has become more profitable over time. Additionally, according to the study of the company's general situation and the calculation and analysis of financial data, the study deeply studies the investment advantage and risk factors of Disney Company and the competitive relationship with the three rival companies. At the same time, the research and application of the algorithm is further. It is hoped that one can continue to study and make progress in venture capital and financial data analysis in the future. This research is helpful to cultivate discipline thinking and research ability, and has certain reference significance for investment practice, which also enhances the knowledge and theory of researchers.
References
[1]. Moon, S. (2020) Effects of COVID-19 on the Entertainment Industry. IDOSR Journal of Experimental Sciences, 5(1), 8-12.
[2]. DeWaard, A. (2020) Financialized Hollywood. Journal of Cinema and Media Studies, 59(4), 54-84.
[3]. Ashton, D. (2015) Making media workers: contesting film and television industry career pathways. Television & New Media, 16(3), 275-294.
[4]. Gabler, N. (2006) Walt Disney. Vintage.
[5]. Iger, R. (2019) The ride of a lifetime: Lessons learned from 15 years as CEO of the Walt Disney Company. Random House.
[6]. Rojek, C. (1993) Disney culture. Leisure studies, 12(2), 121-135.
[7]. Jenner, M. (2018) Netflix and the Re-invention of Television. Springer.
[8]. Glancy, H.M. (1995) Warner Bros film grosses, 1921–51: The William Schaefer ledger. Historical Journal of Film, Radio and Television, 15(1), 55-73.
[9]. Ismail, M. (2017) Sony pictures and the US federal government: a case study analysis of the sony pictures entertainment hack crisis using normal accidents theory.
[10]. Havard, C.T. (2021) Disney, Netflix, and Amazon oh my! An analysis of streaming brand competition and the impact on the future of consumer entertainment. Findings in Sport, Hospitality, Entertainment, and Event Management, 1(1), 7.
[11]. Martínez-Sánchez, M. E., Nicolas-Sans, R. and Díaz, J.B. (2021) Analysis of the social media strategy of audio-visual OTTs in Spain: The case study of Netflix, HBO and Amazon Prime during the implementation of Disney+. Technological Forecasting and Social Change, 173, 121178.
[12]. Eklund, O. (2023) Streaming Platforms and the Frontiers of Digital Distribution:‘Unique Content Regions’ on Netflix, Amazon Prime Video, and Disney. The SAGE Handbook of the Digital Media Economy, 197-222.
[13]. Li, W.Y. (2018) Can Netflix Beat Disney in Business Operation-Evidence from the Streaming Media.
[14]. Alcacer, J., Collis, D.J. and Furey, M. (2010) The Walt Disney Company and Pixar Inc.: To Acquire or Not to Acquire?. Harvard Business School Case, 709-462.
[15]. Lu, J. (2024) Explore the Risk Factors and Market Performance of American Animation Companies Represented by Walt Disney. Highlights in Business, Economics and Management, 24, 1648-1652.
Cite this article
Yang,J. (2024). Analysis of Financial Performances for Walt Disney: Based on Comparison with Netflix, Warner Bros and SONY. Advances in Economics, Management and Political Sciences,105,209-216.
Data availability
The datasets used and/or analyzed during the current study will be available from the authors upon reasonable request.
Disclaimer/Publisher's Note
The statements, opinions and data contained in all publications are solely those of the individual author(s) and contributor(s) and not of EWA Publishing and/or the editor(s). EWA Publishing and/or the editor(s) disclaim responsibility for any injury to people or property resulting from any ideas, methods, instructions or products referred to in the content.
About volume
Volume title: Proceedings of the 3rd International Conference on Financial Technology and Business Analysis
© 2024 by the author(s). Licensee EWA Publishing, Oxford, UK. This article is an open access article distributed under the terms and
conditions of the Creative Commons Attribution (CC BY) license. Authors who
publish this series agree to the following terms:
1. Authors retain copyright and grant the series right of first publication with the work simultaneously licensed under a Creative Commons
Attribution License that allows others to share the work with an acknowledgment of the work's authorship and initial publication in this
series.
2. Authors are able to enter into separate, additional contractual arrangements for the non-exclusive distribution of the series's published
version of the work (e.g., post it to an institutional repository or publish it in a book), with an acknowledgment of its initial
publication in this series.
3. Authors are permitted and encouraged to post their work online (e.g., in institutional repositories or on their website) prior to and
during the submission process, as it can lead to productive exchanges, as well as earlier and greater citation of published work (See
Open access policy for details).
References
[1]. Moon, S. (2020) Effects of COVID-19 on the Entertainment Industry. IDOSR Journal of Experimental Sciences, 5(1), 8-12.
[2]. DeWaard, A. (2020) Financialized Hollywood. Journal of Cinema and Media Studies, 59(4), 54-84.
[3]. Ashton, D. (2015) Making media workers: contesting film and television industry career pathways. Television & New Media, 16(3), 275-294.
[4]. Gabler, N. (2006) Walt Disney. Vintage.
[5]. Iger, R. (2019) The ride of a lifetime: Lessons learned from 15 years as CEO of the Walt Disney Company. Random House.
[6]. Rojek, C. (1993) Disney culture. Leisure studies, 12(2), 121-135.
[7]. Jenner, M. (2018) Netflix and the Re-invention of Television. Springer.
[8]. Glancy, H.M. (1995) Warner Bros film grosses, 1921–51: The William Schaefer ledger. Historical Journal of Film, Radio and Television, 15(1), 55-73.
[9]. Ismail, M. (2017) Sony pictures and the US federal government: a case study analysis of the sony pictures entertainment hack crisis using normal accidents theory.
[10]. Havard, C.T. (2021) Disney, Netflix, and Amazon oh my! An analysis of streaming brand competition and the impact on the future of consumer entertainment. Findings in Sport, Hospitality, Entertainment, and Event Management, 1(1), 7.
[11]. Martínez-Sánchez, M. E., Nicolas-Sans, R. and Díaz, J.B. (2021) Analysis of the social media strategy of audio-visual OTTs in Spain: The case study of Netflix, HBO and Amazon Prime during the implementation of Disney+. Technological Forecasting and Social Change, 173, 121178.
[12]. Eklund, O. (2023) Streaming Platforms and the Frontiers of Digital Distribution:‘Unique Content Regions’ on Netflix, Amazon Prime Video, and Disney. The SAGE Handbook of the Digital Media Economy, 197-222.
[13]. Li, W.Y. (2018) Can Netflix Beat Disney in Business Operation-Evidence from the Streaming Media.
[14]. Alcacer, J., Collis, D.J. and Furey, M. (2010) The Walt Disney Company and Pixar Inc.: To Acquire or Not to Acquire?. Harvard Business School Case, 709-462.
[15]. Lu, J. (2024) Explore the Risk Factors and Market Performance of American Animation Companies Represented by Walt Disney. Highlights in Business, Economics and Management, 24, 1648-1652.