


1. Introduction
In recent years, the artificial intelligence (AI) industry has experienced remarkable growth, becoming a significant driving force across various sectors of the economy. AI technologies have revolutionized industries such as healthcare, finance, transportation, and manufacturing, leading to increased efficiency, cost savings, and the creation of new business models. This rapid development is reflected in the stock market, where AI-related stocks have shown substantial growth and volatility. For instance, Nvidia, a key player in the AI industry, has seen extraordinary stock performance, indicative of the broader trend in AI-focused investments.
This study aims to investigate how the accelerated progress in AI technology is reflected in the performance of AI-related stocks within the broader market context. To explore this phenomenon, we focus on the Global X Robotics & Artificial Intelligence ETF (BOTZ), an exchange-traded fund that holds shares in numerous companies playing pivotal roles in the AI industry. BOTZ serves as an ideal proxy for this analysis due to its diverse portfolio of leading AI companies, including industry giants like NVIDIA and Intuitive Surgical Inc. Our research employs advanced machine learning techniques, specifically Random Forest and XGBoost models, to analyze and predict the returns of BOTZ ETF. By examining historical data and market trends, we seek to understand the market's response to AI advancements, investor sentiment towards AI-focused companies, and the potential long-term implications of AI's growing influence on financial markets.
The innovation of this research lies in two key aspects. Firstly, it bridges the gap between technological progress in AI and financial market dynamics, providing a comprehensive analysis of how AI development directly impacts stock performance. Secondly, by utilizing machine learning models for financial forecasting, this study demonstrates the potential of AI itself in understanding and predicting market behaviors related to AI-focused investments. These insights not only contribute to academic understanding but also offer practical value for investors and financial analysts navigating the evolving landscape of AI-influenced markets.
2. Literature Review
2.1. Overview of Machine Learning in Stock Prediction
Machine learning techniques have gained significant traction in stock return prediction, offering promising results in capturing complex market dynamics. Previous studies have applied various machine learning models to predict stock returns, with mixed results. These studies collectively underscore the potential and challenges of applying machine learning techniques to financial forecasting, suggesting a need for continuous model refinement and comparison. These ensemble methods have demonstrated robust performance in predicting stock market behavior, often outperforming traditional approaches such as Logistic Regression [1,2].
Research has shown that machine learning models can effectively predict stock returns in various markets, including the Korean stock market. These models have proven particularly useful for intraday return forecasting, with some studies reporting prediction accuracies of around 55% for indices like the Hanoi Stock Exchange (HNX) [2,3]. The application of dimension reduction techniques, such as Kernel principal component analysis, has further enhanced the effectiveness of these models in handling high-dimensional financial data.
2.2. Random Forest in Stock Return Prediction
While different machine learning algorithms have been explored, Random Forest and its variants have consistently shown strong performance in stock return prediction tasks. A study on predicting stock prices of solar energy companies in India found that the Random Forest model achieved high Coefficient of Determination (R²) values, indicating strong predictive performance. This suggests that Random Forest is particularly useful for forecasting stock prices in the renewable energy sector [4]. Other studies have also found that Random Forest models excel in capturing complex non-linear relationships within financial data, leading to higher prediction accuracy. The Extra-Trees Classifier, for instance, has demonstrated superior accuracy compared to other models, including Support Vector Machine and Logistic Regression [2]. These tree-based ensemble methods excel in capturing non-linear relationships in financial data, making them well-suited for the complex task of stock return forecasting.
2.3. XGBoost in Stock Market Analysis
The application of XGBoost in predicting stock returns has shown promising results, as evidenced by several recent studies. A comparative study examining Random Forest, Ordinary Least Square (OLS), and XGBoost models for stock return prediction found that both XGBoost and Random Forest significantly outperformed the OLS model across various subjects [5]. The research utilized technical indicators as inputs and noted that while the difference between XGBoost and Random Forest was subtle, both machine learning models demonstrated superior performance compared to traditional methods.
Another study specifically explored the use of XGBoost for mean-variance portfolio optimization and stock return prediction [6]. This research highlights the versatility of XGBoost, showcasing its applicability not only in predicting individual stock returns but also in more complex investment portfolio management tasks.
In a comparison of different machine learning models for stock trend prediction, a model based on LightGBM (an improved version of XGBoost) showed exceptional performance. One study reported that the LightGBM-based stock prediction model achieved a return rate 24.7% higher than the XGBoost model and 8.9% higher than a Neural Network model [7].
Furthermore, a study combining technical indicators with Google Trends search data found that XGBoost performed excellently in predicting stock movements in the Thai market, particularly during critical market conditions such as the COVID-19 period [8]. This suggests that XGBoost can effectively handle not only traditional financial data but also integrate other types of information to enhance prediction accuracy.
2.4. Other Applications of Machine Learning in Finance
Beyond individual stock prediction, machine learning approaches have also been applied to portfolio research and the analysis of correlations between different markets. For example, studies have investigated the correlation of stock return movements between US firms and their Chinese suppliers using both econometric and machine learning techniques. These investigations have revealed that factors such as industry differences, firm size, and stock trading volume can significantly impact the degree of stock return correlations between interconnected markets [9].
2.5. Future Directions
The integration of machine learning with traditional financial analysis has opened new avenues for understanding and predicting stock market behavior. By leveraging large datasets and identifying subtle patterns, these advanced techniques not only enhance the accuracy of stock return predictions but also provide valuable insights into the factors driving market performance. As the field continues to evolve, the combination of machine learning and financial expertise promises to offer increasingly sophisticated tools for investors and researchers alike [10]. Based of these information, this paper will conduct a comprehensive comparison of Random Forest and XGBoost models in predicting BOTZ ETF performance, analyzing their effectiveness under various market conditions. Incorporate both traditional technical indicators and alternative data sources like Google Trends to enhance feature engineering. Investigate the models' predictive capabilities across different time scales and apply the predictions to portfolio construction, evaluating their practical investment value. Analyze the impact of different market conditions on prediction accuracy, with a focus on AI industry-specific events. Additionally, explore methods to improve the interpretability of these machine learning models in financial forecasting, enhancing their credibility for real-world investment decisions. This approach will contribute to the existing body of knowledge on AI stock prediction while providing valuable insights for investors and researchers in the rapidly evolving AI sector.
3. Data
3.1. Data Source
In this paper, the U.S. stock Global X Robotics & Artificial Intelligence ETF daily data from January 2020 to July 2024 has been selected as the research sample, the data is obtained from yahoo finance (ticker: BOTZ), and a total of 1,135 sample values have been obtained. In order to eliminate the inconsistency problem, the feature variables have been standardized. All data analysis in this paper is implemented in python 3.11.
3.2. Data Processing
To conduct this study, we used Python's yfinance library to download daily data for the Global X Robotics & Artificial Intelligence ETF (BOTZ) from Yahoo Finance, covering the period from January 2020 to July 2024. The raw data was then processed to calculate various technical indicators using the talib library in Python.
3.3. Key Features
The following features were calculated and used in our analysis:
Price Changes Over Time: Tracks the change in BOTZ's price over the study period, highlighting significant growth or decline periods and providing context for long-term trends.
Daily Returns: Quantifies the average percentage change in BOTZ's price from one trading day to the next, crucial for understanding short-term volatility and expected day-to-day trading profitability.
Moving Averages: Computed for various periods to smooth out short-term fluctuations and identify longer-term trends. This fundamental tool in technical analysis helps investors make informed decisions based on historical price data.
Relative Strength Indicator (RSI): A momentum indicator measuring the rate of price changes, ranging from 0 to 100. Generally, an RSI above 70 indicates overbought conditions, while below 30 suggests oversold conditions.
Stochastic Oscillator: Analyzes the price relative to its highs and lows. The %K line (Fast Stochastic) indicates where the current price is relative to the recent price range, while the %D line (Slow Stochastic) is a moving average of %K. Values above 80 suggest overbought conditions, below 20 indicate oversold conditions.
Williams Indicator (William %R): Measures overbought and oversold conditions, ranging from 0 to -100. Values above -20 suggest overbought conditions, while below -80 indicate oversold conditions.
Moving Average Convergence/Divergence (MACD): Measures trend and momentum based on the difference between two moving averages. A positive MACD indicates an uptrend, while negative suggests a downtrend. The MACD signal line helps determine buying and selling timing.
On Balance Volume (OBV): Measures the buying and selling pressure based on volume. A rising OBV indicates an uptrend, while a falling OBV suggests a downtrend. Divergences between OBV and price can signal potential trend reversals.
These features were visualized as part of our exploratory data analysis to provide a comprehensive overview of the BOTZ ETF's performance and the behavior of various technical indicators over the study period.
3.4. Features Overview
The following figures (from Figure 1 to Figure 7) indicates an overview of all features of the BOTZ data.
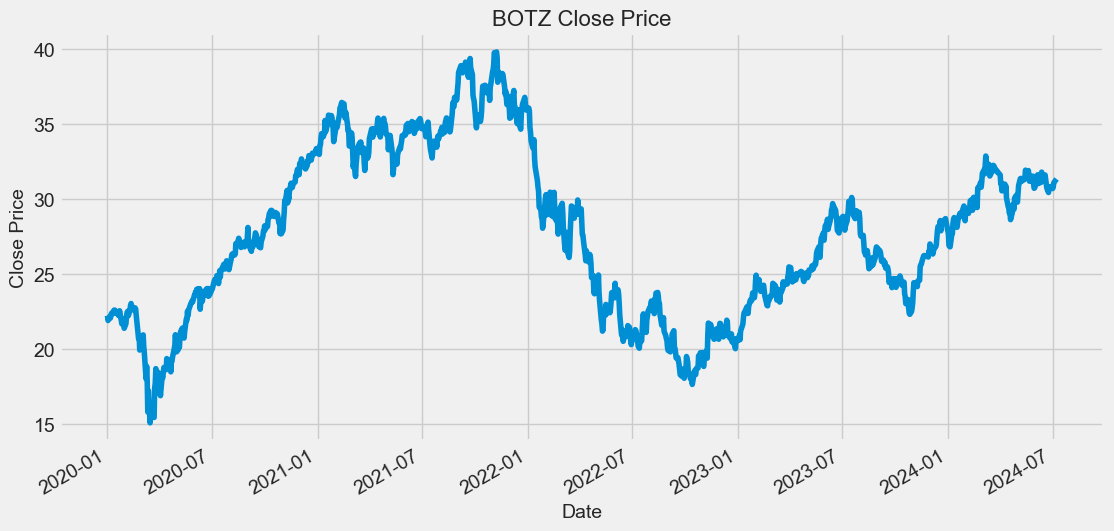
Figure 1: BOTZ Close Price Tracking.
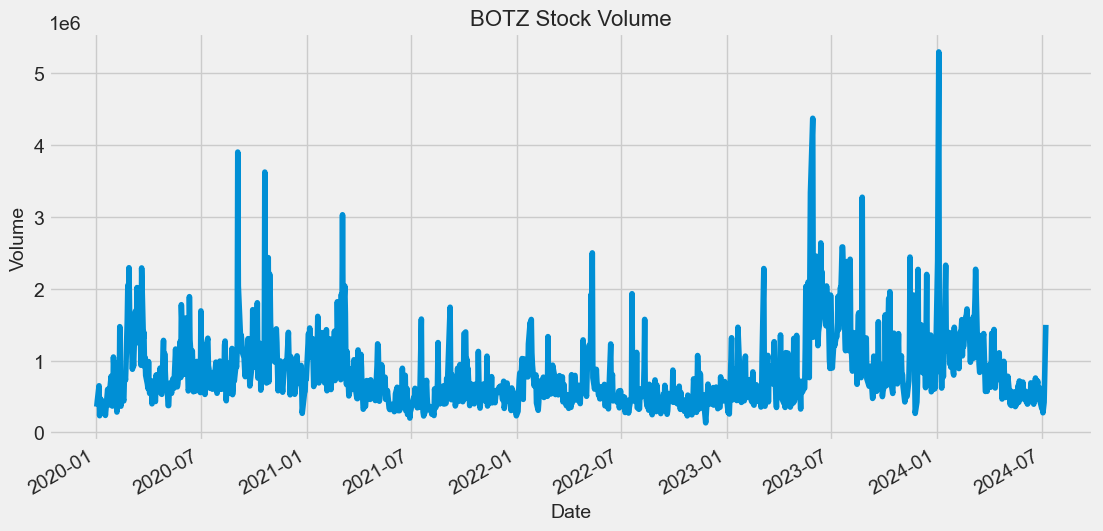
Figure 2: BOTZ Volume.
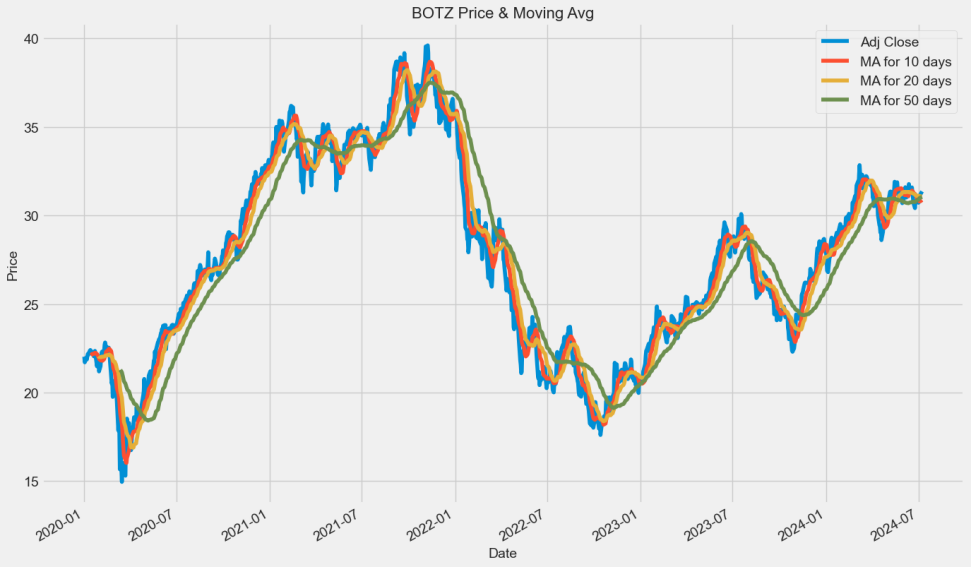
Figure 3: BOTZ Close Price & Moving Average.
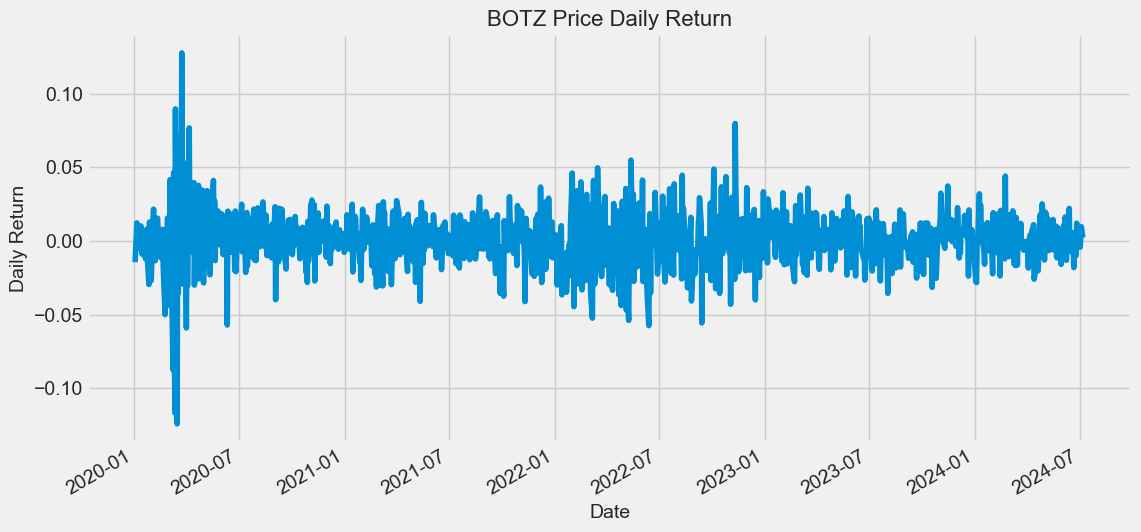
Figure 4: BOTZ Daily Return Overview.
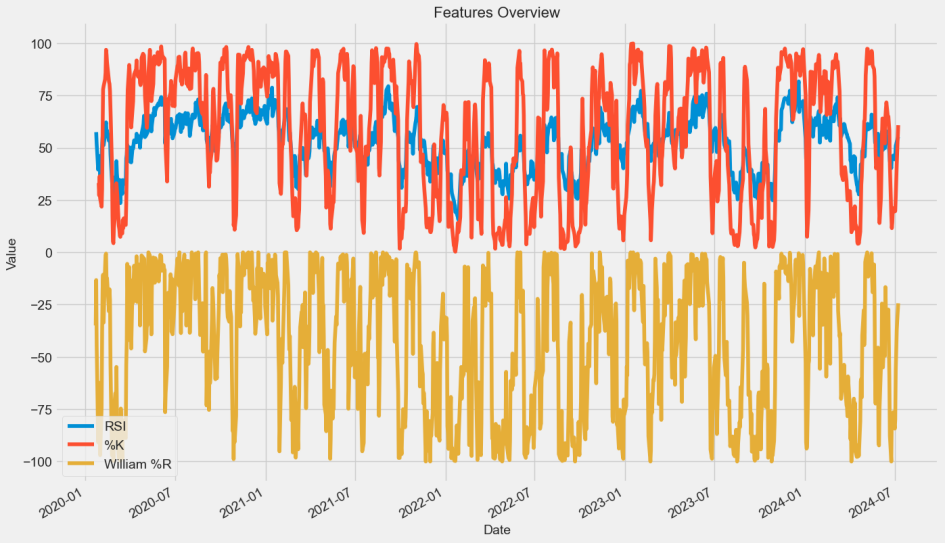
Figure 5: BOTZ RSI & %K & William%R Overview.
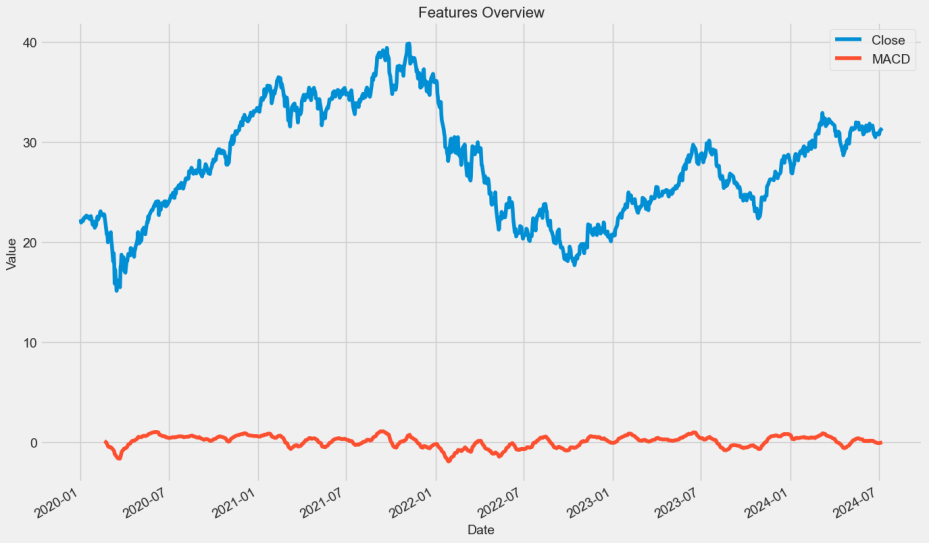
Figure 6: BOTZ MACD Overview.
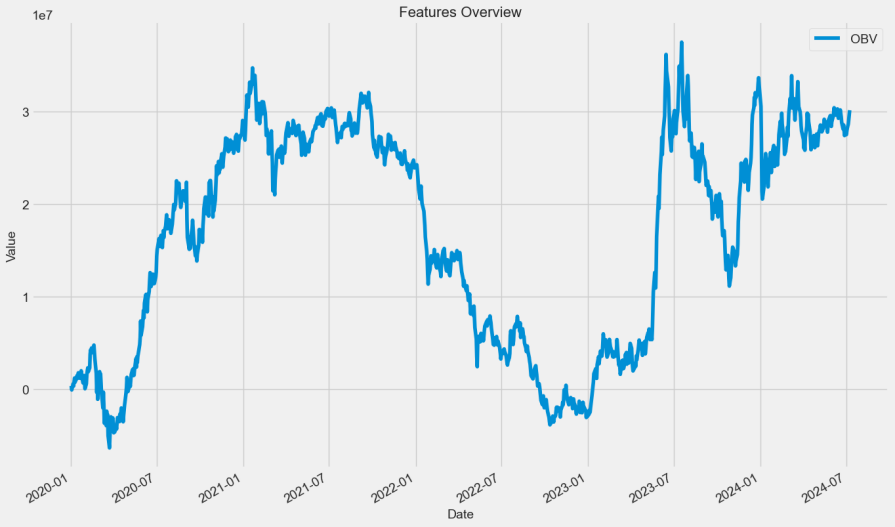
Figure 7: BOTZ OBV Overview.
4. Method
4.1. Models
Initially, we attempted to use Long Short-Term Memory (LSTM) networks for prediction. However, due to the high dimensionality of our feature set and inconsistencies in data formats, the LSTM model did not yield satisfactory results. Consequently, we opted for two ensemble learning methods: Random Forest and XGBoost.
4.1.1. Indicators for evaluating model predictions
In this project, two methods, mean-squared-error (MSE) and r-squared (R²), are selected to compare and measure the prediction effect of the two models, Random Forest and XGBoost; the smaller the MSE is, the better the prediction effect is; the larger the value of r-squared is, the better the prediction effect is.
4.1.2. Random Forest
Random Forest is an ensemble learning method that operates by constructing multiple decision trees during training and outputting the mean prediction of the individual trees for regression tasks. The algorithm can be represented as:
\( f(x)=\frac{1}{B}\sum _{b=1}^{B}{f_{b}}(x)\ \ \ (1) \)
Where f(x) is the Random Forest prediction, B is the number of trees, and f_b(x) is the prediction of the bth tree.
Random Forest offers several advantages for our stock return prediction task: It can handle high-dimensional data without feature selection. It's robust to outliers and non-linear data. It provides feature importance rankings, offering insights into which factors most influence the predictions.
We trained our Random Forest model using all calculated features. The model's performance was evaluated using Mean Squared Error (MSE) and R-squared metrics.
4.1.3. XGBoost
XGBoost (Extreme Gradient Boosting) is an optimized distributed gradient boosting library. It uses the following regularized objective function:
\( L(∅)=\sum _{i=1}^{n}l({y_{i}},{\hat{y}_{i}})+\sum _{k=1}^{K}Ω({f_{k}})\ \ \ (2) \)
Where l is the loss function, Ω is the regularization term, y_i is the target, ŷ_i is the prediction, and f_k represents the kth tree.
XGBoost is particularly suited for our task due to following characteristics: High performance and faster training speed compared to other algorithms. Built-in regularization, which helps prevent overfitting. Ability to handle missing data automatically. Capacity to provide feature importance scores.
We trained our XGBoost model using the same feature set as the Random Forest model. We evaluated its performance using MSE and R-squared metrics, allowing for a direct comparison with the Random Forest model.
Both models were implemented using scikit-learn and XGBoost libraries in Python, with hyperparameters tuned through cross-validation to optimize performance.
5. Results
5.1. Random Forest
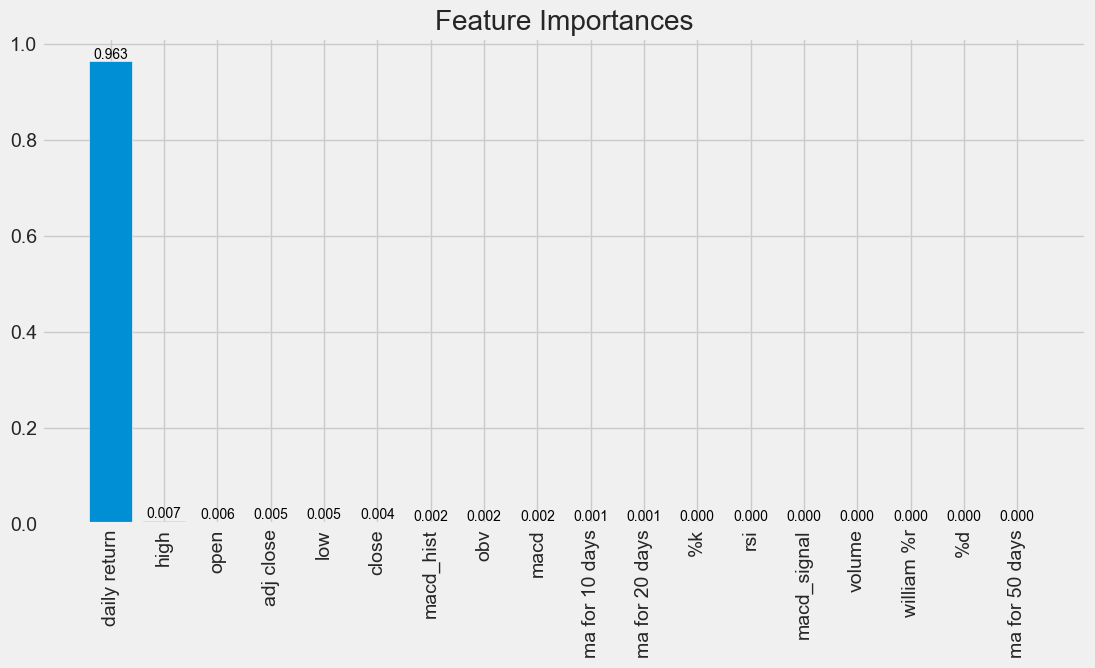
Figure 8: Feature Importance of Random Forest.
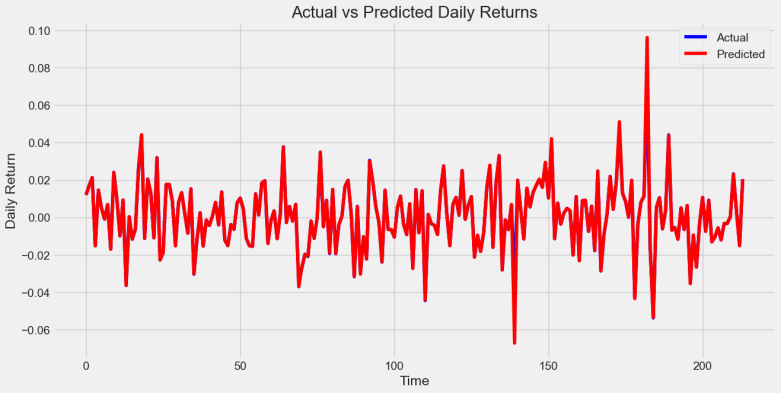
Figure 9: Actual vs. Predicted Daily Return by Random Forest.
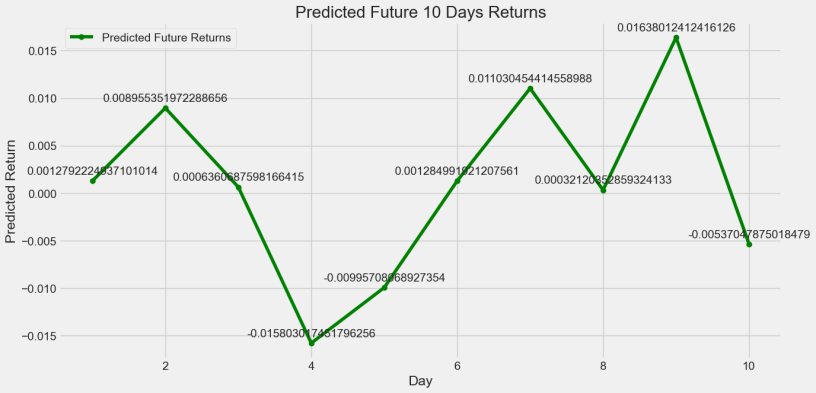
Figure 10: Predicted Future 10 Days Return by Random Forest.
5.2. XGBoost
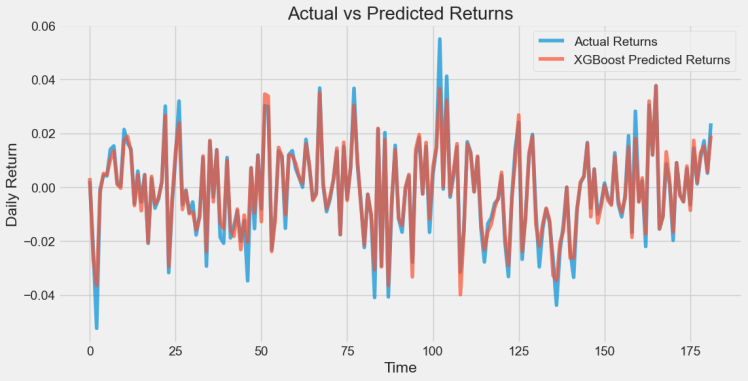
Figure 11: Actual vs. Predicted Returns by XGBoost.
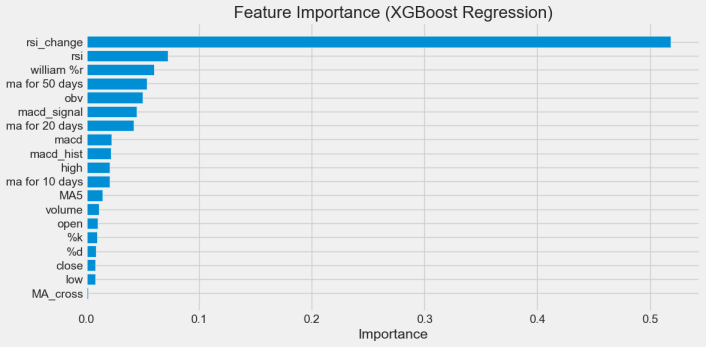
Figure 12: Feature Importance of XGBoost.
5.3. Model Performance
To evaluate the performance of our Random Forest and XGBoost models, we compared their MSE and R², and Accuracy scores. The results are summarized in Table 1.
Table 1: Performance Comparison of Random Forest and XGBoost Models.
Model | MSE | R-squared | Accuracy |
Random Forest | 7.8201e-06 | 0.9749 | 97.50% |
XGBoost | 1.2791e-05 | 0.9583 | 95.8% |
5.4. Model Suitability
Both Random Forest and XGBoost models demonstrated strong performance in predicting BOTZ ETF returns, with high R-squared values and low MSE.
The Random Forest model achieved a higher MSE and R-squared score compared to XGBoost (Table 1). The result shown in Figure 9, 10 and 11 also indicates that the predicted return by Random Forest is better than XGBoost. This suggests that Random Forest may better capture the overall variance in the data and provide more accurate predictions of stock prices. However, XGBoost’s superior performance in direction prediction indicates its strength in correctly identifying upward and downward trends in stock prices (Table 2).
Table 2: XGBoost Classification Result.
Accuracy | 1.0 | ||||
Confusion Matrix |
| ||||
Predicted next day return (XGBoost) | -0.0062 | ||||
Predicted next day direction (XGBoost) | Down |
These results highlight the complementary strengths of the two models and the potential benefits of combining them in an ensemble approach for improved predictive accuracy.
5.5. Feature Importance
The feature importance analysis revealed interesting differences between the two models. In the Random Forest model, 'daily return' emerged as the most important feature (Figure 8). This suggests that the model heavily relies on recent price movements to make its predictions, which aligns with the momentum effect often observed in financial markets.
Conversely, in the XGBoost model, 'rsi_change' was identified as the most important feature (Figure 12). The Relative Strength Index (RSI) is a momentum oscillator that measures the speed and change of price movements. The importance of 'rsi_change' in the XGBoost model indicates that it places more emphasis on the rate of change in momentum rather than absolute price changes.
This difference in feature importance highlights the distinct approaches of the two models. The Random Forest model appears to be more sensitive to recent price action, while XGBoost seems to capture more complex, derivative features of price momentum.
5.6. Discussion
Our results align well with the findings reported in the literature review. The high accuracy and R-squared values of both models corroborate the findings of Zhao and Nguyen [1, 2], who reported strong performance of machine learning classifiers, particularly Random Forest, in stock return prediction.
The superior performance of our tree-based ensemble methods (Random Forest and XGBoost) compared to traditional approaches echoes the findings of Wang (2022), who found that both Random Forest and XGBoost significantly outperformed Ordinary Least Square models in stock return prediction.
This paper’s findings also support the findings of Hongjoong and Saetia & Yokrattanasak [7, 9], who demonstrated the effectiveness of XGBoost in stock price prediction and portfolio optimization. The perfect directional accuracy achieved by our XGBoost model underscores its potential in capturing complex market dynamics.
The strong predictive performance of our models on the BOTZ ETF data provides several insights into the AI industry's representation in the stock market and the viability of machine learning applications in financial forecasting.
Firstly, the high R-squared values suggest that the BOTZ ETF, and by extension the AI industry it represents, exhibits predictable patterns that can be captured by machine learning models. This predictability could be attributed to the consistent growth and innovation in the AI sector, which may translate to more stable and trend-driven stock performance.
The importance of technical indicators like RSI change in our XGBoost model indicates that momentum plays a significant role in the performance of AI-focused stocks. This could reflect the market's forward-looking stance on AI technologies, where positive developments in the field quickly translate to bullish market sentiment.
The success of our machine learning models in predicting BOTZ ETF returns demonstrates the feasibility of applying these techniques to stock market analysis, particularly for tech-centric and innovation-driven sectors like AI. The models' ability to capture complex relationships among various technical indicators showcases the potential of machine learning to enhance traditional financial analysis methods.
However, it's important to note that while our models show promising results, the stock market is influenced by numerous factors beyond technical indicators, including macroeconomic conditions, geopolitical events, and company-specific news. Therefore, these models should be used as part of a comprehensive investment strategy rather than as standalone decision-making tools.
In conclusion, our results not only validate the effectiveness of machine learning in stock return prediction but also provide valuable insights into the behavior of AI-focused investments in the stock market. The strong performance of both Random Forest and XGBoost models underscores the potential of these techniques in capturing the unique dynamics of the rapidly evolving AI industry.
6. Conclusion
This study demonstrated the efficacy of machine learning techniques in predicting the returns of the BOTZ ETF. Using Random Forest and XGBoost models, we analyzed the complex market dynamics associated with AI sector stocks. The analysis included processing historical data, implementing the models, and evaluating their performance through various metrics. The results revealed that these machine learning models could effectively capture intricate patterns in the market, providing reliable predictions. Specifically, the BOTZ ETF, with substantial investments in leading AI companies like NVIDIA, served as a robust proxy for assessing the AI industry’s impact on the stock market. The findings highlighted the significant influence of AI’s rapid development on market behavior, driven by technological advancements and commercialization. This has resulted in heightened investor interest in AI companies, influencing stock price movements and contributing to overall market growth.
Looking ahead, there are several avenues for enhancing this project. Future improvements could include incorporating more sophisticated machine learning models, such as Long Short-Term Memory (LSTM) networks and other neural network architectures, to improve the prediction of closing prices and returns. Additionally, exploring ensemble methods that combine multiple models could enhance prediction accuracy. Integrating alternative data sources, such as social media sentiment, news articles, and economic indicators, could provide a more comprehensive view of market dynamics and further refine predictions. Finally, conducting a more in-depth hyperparameter tuning and feature engineering process could optimize model performance. By leveraging these advanced techniques, the predictive capabilities of the models can be significantly enhanced, providing even more valuable insights for investors and stakeholders in the financial market.
References
[1]. Zhao, S. (2022). Stock Return Prediction Using Machine Learning Classifiers. In 2022 2nd International Conference on Enterprise Management and Economic Development (ICEMED 2022), 1347-1351.
[2]. Nguyen, T. N., Ho-Phuoc, T., Nguyen, D. T., & Mac, M. N. (2020). Stock Return Prediction using Machine Learning-Based Techniques. Journal of Science and Technology: Issue on Information and Communications Technology, 18(12.2), 49-56.
[3]. Choi, W., Jang, S., Kim, S., Park, C., Park, S., & Song, S. (2024). Return prediction by machine learning for the Korean stock market. Journal of the Korean Statistical Society, 53(1), 248-280.
[4]. Meher, B. K., Anand, A., Kumar, S., Birau, R., & Singh, M. (2024). Effectiveness of random forest model in predicting stock prices of solar energy companies in India. International Journal of Energy Economics and Policy, 14(2), 426-434.
[5]. Wang, J. (2022). The Comparsion of Stock Return Prediction for Random Forest, Ordinary Least Square, and XGBoost. BCP Business & Management, 26, 686-695.
[6]. Hongjoong, K. I. M. (2021). Mean-variance portfolio optimization with stock return prediction using XGBoost. Economic Computation & Economic Cybernetics Studies & Research, 55(4).
[7]. Ye, F., Wang, J., Li, Z., Jihan, Z., & Yang, C. (2021). Jane Street Stock prediction model based on LightGBM. 2021 6th International Conference on Intelligent Computing and Signal Processing (ICSP), 385-388.
[8]. Saetia, K., & Yokrattanasak, J. (2022). Stock movement prediction using machine learning based on technical indicators and Google trend searches in Thailand. International Journal of Financial Studies, 11(1), 5.
[9]. Xiao, H. (2023). Econometrics and Machine Learning Approach on Correlation in Stock Return between US Firms and Chinese Suppliers. Advances in Economics, Management and Political Sciences. Retrieved from: https://www.semanticscholar.org/search?q=Econometrics%20and%20Machine%20Learning%20Approach%20on%20Correlation%20in%20Stock%20Return%20between%20US%20Firms%20and%20Chinese%20Suppliers&sort=relevance.
[10]. Chen, X. (2024). Machine Learning Based Stock Return Prediction and Portfolio Research. Operations Research and Fuzziology. Retrieved from: https://www.semanticscholar.org/paper/Machine-Learning-Based-Stock-Return-Prediction-and-%E6%AC%A3/affe5fe897cf2fcb46239615a38ff2c5e70825f9.
Cite this article
Li,J. (2024). The Impact of AI Industry Growth on U.S. AI Sector Stocks: A Machine Learning Analysis. Advances in Economics, Management and Political Sciences,94,175-186.
Data availability
The datasets used and/or analyzed during the current study will be available from the authors upon reasonable request.
Disclaimer/Publisher's Note
The statements, opinions and data contained in all publications are solely those of the individual author(s) and contributor(s) and not of EWA Publishing and/or the editor(s). EWA Publishing and/or the editor(s) disclaim responsibility for any injury to people or property resulting from any ideas, methods, instructions or products referred to in the content.
About volume
Volume title: Proceedings of ICFTBA 2024 Workshop: Finance in the Age of Environmental Risks and Sustainability
© 2024 by the author(s). Licensee EWA Publishing, Oxford, UK. This article is an open access article distributed under the terms and
conditions of the Creative Commons Attribution (CC BY) license. Authors who
publish this series agree to the following terms:
1. Authors retain copyright and grant the series right of first publication with the work simultaneously licensed under a Creative Commons
Attribution License that allows others to share the work with an acknowledgment of the work's authorship and initial publication in this
series.
2. Authors are able to enter into separate, additional contractual arrangements for the non-exclusive distribution of the series's published
version of the work (e.g., post it to an institutional repository or publish it in a book), with an acknowledgment of its initial
publication in this series.
3. Authors are permitted and encouraged to post their work online (e.g., in institutional repositories or on their website) prior to and
during the submission process, as it can lead to productive exchanges, as well as earlier and greater citation of published work (See
Open access policy for details).
References
[1]. Zhao, S. (2022). Stock Return Prediction Using Machine Learning Classifiers. In 2022 2nd International Conference on Enterprise Management and Economic Development (ICEMED 2022), 1347-1351.
[2]. Nguyen, T. N., Ho-Phuoc, T., Nguyen, D. T., & Mac, M. N. (2020). Stock Return Prediction using Machine Learning-Based Techniques. Journal of Science and Technology: Issue on Information and Communications Technology, 18(12.2), 49-56.
[3]. Choi, W., Jang, S., Kim, S., Park, C., Park, S., & Song, S. (2024). Return prediction by machine learning for the Korean stock market. Journal of the Korean Statistical Society, 53(1), 248-280.
[4]. Meher, B. K., Anand, A., Kumar, S., Birau, R., & Singh, M. (2024). Effectiveness of random forest model in predicting stock prices of solar energy companies in India. International Journal of Energy Economics and Policy, 14(2), 426-434.
[5]. Wang, J. (2022). The Comparsion of Stock Return Prediction for Random Forest, Ordinary Least Square, and XGBoost. BCP Business & Management, 26, 686-695.
[6]. Hongjoong, K. I. M. (2021). Mean-variance portfolio optimization with stock return prediction using XGBoost. Economic Computation & Economic Cybernetics Studies & Research, 55(4).
[7]. Ye, F., Wang, J., Li, Z., Jihan, Z., & Yang, C. (2021). Jane Street Stock prediction model based on LightGBM. 2021 6th International Conference on Intelligent Computing and Signal Processing (ICSP), 385-388.
[8]. Saetia, K., & Yokrattanasak, J. (2022). Stock movement prediction using machine learning based on technical indicators and Google trend searches in Thailand. International Journal of Financial Studies, 11(1), 5.
[9]. Xiao, H. (2023). Econometrics and Machine Learning Approach on Correlation in Stock Return between US Firms and Chinese Suppliers. Advances in Economics, Management and Political Sciences. Retrieved from: https://www.semanticscholar.org/search?q=Econometrics%20and%20Machine%20Learning%20Approach%20on%20Correlation%20in%20Stock%20Return%20between%20US%20Firms%20and%20Chinese%20Suppliers&sort=relevance.
[10]. Chen, X. (2024). Machine Learning Based Stock Return Prediction and Portfolio Research. Operations Research and Fuzziology. Retrieved from: https://www.semanticscholar.org/paper/Machine-Learning-Based-Stock-Return-Prediction-and-%E6%AC%A3/affe5fe897cf2fcb46239615a38ff2c5e70825f9.