


1. Introduction
The soft drink industry is a routine market that many people spend in. According to Statista, the average volume consumed per person is projected to reach 37.66 liters in 2024 in the soft drink industry [1]. The revenue contribution percentage shows the structure of the soft drink industry. According to the industry report, carbonated soft drinks account for 45% of the soft drink industry revenue, and the following industry revenue from high to low is fruit beverages, bottled waters, functional beverages, and sports drinks [2]. Research shows the soft drink industry’s revenue is expected to reach USD 169920 million by 2031 with a high compound annual growth rate, meanwhile, USA, China, and Europe are the leading regions in the soft drink market [3]. To emphasize, soft drink consumption has grown fast over the past 50 years, and the demand is caused by consumer behavior and the industry’s constant evolution and innovation [4]. Furthermore, Raihan and his colleagues found that the soft drink industry is facing high competition with rapid growth, on the other hand, its supply chain is prone to be challenged by consumer preference changes and new environmental policies [5]. Promotional tactics, including social media advertising, educational approach, emotional evoking, and sports team sponsoring, can help relieve the challenges [2].
Monster Beverage Corporation (MNST) in comparison with Coca-Cola (KO), PepsiCo (PEP), and Keurig Dr Pepper (KDP) are 4 of the top 10 soft drink companies in the world [6]. To begin with, Monster Beverage Corporation sold its products in 158 countries. The company has profitability growth, outstanding cost and risk management, and brand expansion with high consumer demand for energy drinks, which make it a strong potential stock [7]. Additionally, Madrid made a comparison analysis by the balance sheet and income statement of PEP and KO, and then focuses on several financial ratios such as activity ratios, profitability ratios, solvency ratios, etc. PEP and KO have decreasing revenue and face decreasing market volume, and each company has different advantages and disadvantages after analyzing the financial ratios [8]. KO has better overall financial indicators than PEP. For example, though KO has higher revenue, it is not better than PEP since KO is difficult to convert free cash flow [9]. Furthermore, Coca-Cola performed better than Keurig Dr Pepper is a better stock, in the fact of KO’s higher revenue growth and net profit though both underperformed the S&P 500 over the last three years [10].
Most present papers are about the single analysis of one company or a comparison analysis of two companies in the soft drink industry, but there is no comparison for the four companies, i.e., MNST, KO, PEP, and KDP. However, comparing analysis for these four companies of the top 10 soft drink companies by adopting calculations and concluding suggestions is important for value investing. Thus, this paper that helps compare the financial performances of MNST, KO, PEP, and KDP will fill in the gaps in existing research. The paper is structured as follows. The next section is to present the sources of data, competition, and methodology. Section 3 is for results and discussions based on the comparison analysis, explanations, and limitations. Section 4 concludes this research paper.
2. Data and Method
This study used data from financial websites (Nasdaq and Estimize) and companies’ annual reports. All data are obtained by June 26th, 2024. To begin with, the best way to characterize the soft drink market is as an oligopoly with multiproduct companies [11]. The Coca-Cola Company (KO), PepsiCo, Inc. (PEP), Monster Beverage Corporation (MNST), and Keurig Dr Pepper, Inc. (KDP) are the leading soft drink companies in the US. Coca-Cola, PepsiCo and Keurig Dr Pepper have carbonated soft drinks; Coca-Cola, PepsiCo and Monster have energy drinks; and each of them has ready-to-drink teas and coffees.
Main products are the main competition from those four companies, and meanwhile, strong brand recognition, diverse products, health initiatives etc. are other competing factors. To be more specific, the Coca-Cola Company (KO) is a long-established company with strong brand influence even in the global market, which also shows its leading position in the soft drink industry. Moreover, PepsiCo’s extensive coverage in the worldwide market presents a direct challenge to Coca-Cola’s dominance. PepsiCo's ability to innovate and diversify its products ensures its competitive edge, making it a formidable rival. Furthermore, for Monster Beverage Corporation, the high growth rate shows it’s expanding rapidly in the global market, especially in North America, Europe and Asia. Monster focuses on the energy drink segment, an area of increasing consumer interest, especially for people who pursue health and wellness ideas. Similarly, Keurig Dr Pepper also has strong brand recognition and a diverse product range.
This paper is based on the calculation of several financial metrics. The stock price is the company’s current price for trading, showing the market value of the company. Then, stock price times outstanding shares is market capitalization. The market capitalization reflects the company’s value with its outstanding shares. EPS has two types, NTM and TTM, and is the indicator meaning earnings per share. TTM EPS is the net income (past 12 months) divided by outstanding shares, while NTM EPS is the projected net income (next 12 months) divided by outstanding shares. Hence, each of them is for the profitability for the traditional 12 months and the future profitability. Similarly, the TTM P/E ratio and NTM P/E ratio are current stock prices divided by TTM EPS or NTM EPS, indicating the market expectation for past and future periods. Revenue growth rate indicates the increase in a company’s sales over a specific period and EPS growth rate is the increase rate in EPS during a period.
One of the most important financial indicators is the PEG ratio, which is a prospect to evaluate the company by comparing P/E with growth rates usually expressed as a percentage. The PEG ratio is lower the better since a lower PEG ratio (typically below 1) means the stock might be undervalued considering its expected growth. GP/A ratio is gross profit to total assets. It measures the efficiency of a company's assets in generating gross profit. Annual gross margin and annual net profit margin are gross profit to revenue and net profit to income respectively. Annual gross margin displays the proportion of income that is higher than the cost of products sold, which is a measure of production efficiency, whereas annual net profit represents the portion of income left over after all costs are paid. The above metrics can help evaluate the healthiness of companies, growth competencies, and profitability, which can provide effective insights to assess companies’ investing value more accurately.
3. Results and Discussion
3.1. Comparison Analysis
According to the Table 1, there are several observations. Firstly, all four companies’ forward P/E ratios are slightly lower than the current P/E ratios, suggesting an increase in earnings over the next year. Furthermore, Monster Beverage Corporation has the lowest PEG ratio, which indicates it might be undervalued relative to its growth, that is, high quality of earnings growth. Moreover, Monster Beverage Corporation's wedge between revenue growth rate and EPS growth rate is much larger than the others. The main reason for the wedge is the optimized cost control, which means the company’s net income, and then EPS, might increase more quickly than revenue. On the other hand, there might be the high leverage, caused by using debt to grow, and at the same time, EPS growth rates are amplified and financial risk emerges. In addition, Keurig Dr. Pepper, Inc. has the lowest GP/A ratio, which means the efficiency for converting assets to gross profit is low.
Table 1: Key financial ratios for KO, PEP, MNST, and KDP in June 2024.
Coca-Cola Company | PepsiCo, Inc | Monster Beverage Corporation | Keurig Dr Pepper, Inc. | |
Stock price | $63.84 | $167.35 | $50.14 | $34.41 |
TTM EPS | 2.73 | 7.73 | 1.59 | 1.83 |
NTM EPS | 2.86 | 8.31 | 1.84 | 1.95 |
TTM P/E | 23.38 | 21.65 | 31.53 | 18.80 |
NTM P/E | 22.32 | 20.14 | 27.25 | 17.65 |
Revenue growth rate | 0.01% | 3.87% | 9.22% | 4.49% |
EPS growth rate | 4.76% | 7.50% | 15.72% | 6.56% |
PEG | 4.91 | 2.89 | 2.01 | 2.87 |
GP/A | 27.87% | 49.35% | 39.17% | 15.50% |
Number of shares outstanding | 4,310,000,000 | 1,375,000,000 | 1,041,081,000 | 1,380,700,000 |
Market Capitalization (in billion) | 275150400000 | 230106250000 | 52199801340 | 47509887000 |
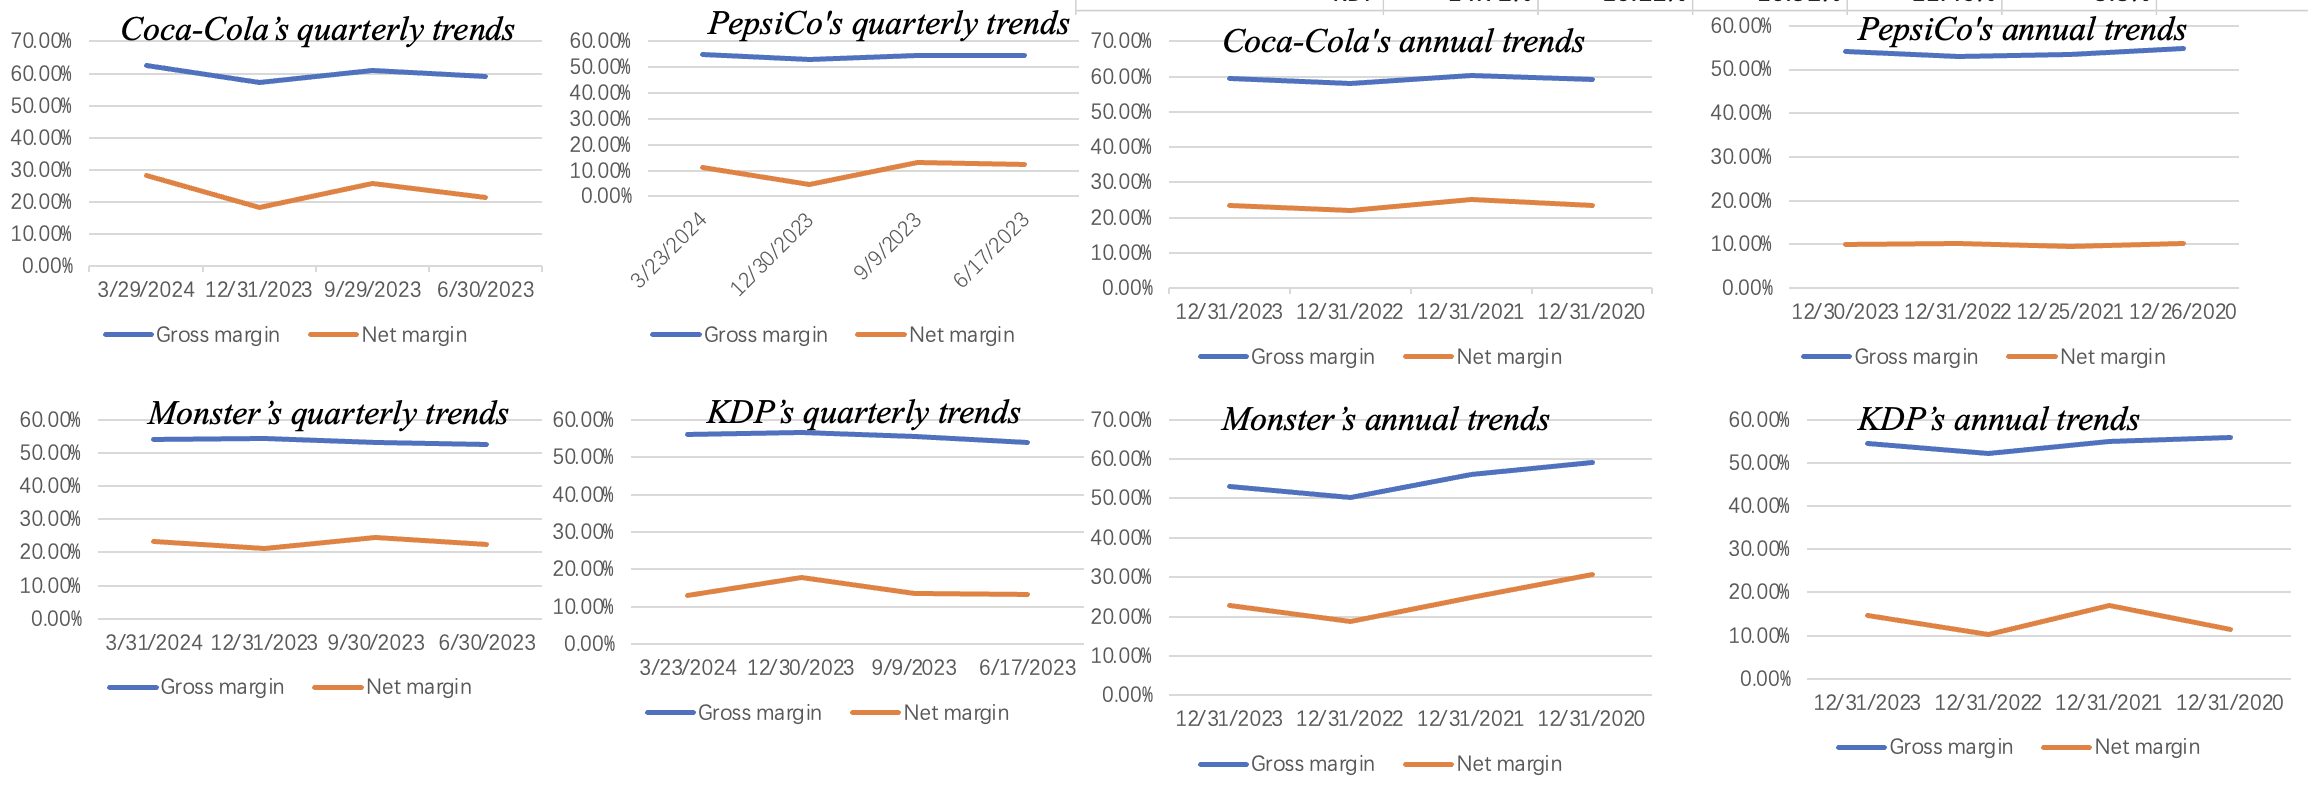
Figure 1: Annual gross margin and annual net profit margin trends for KO, PEP, MNST, and KDP.
Table 2: Annual gross margin and annual net profit margin for KO, PEP, MNST, and KDP.
Annual gross margin | 2024 | 2023 | 2022 | 2021 | Diff between 2024 & 2021 |
KO | 59.5% | 58.1% | 60.3% | 59.3% | 0.2% |
PEP | 54.2% | 53.0% | 53.3% | 54.8% | -0.6% |
MNST | 53.14% | 50.30% | 56.10% | 59.23% | -6.1% |
KDP | 54.54% | 52.10% | 55.01% | 55.83% | -1.3% |
Annual net profit margin | 2024 | 2023 | 2022 | 2021 | Diff between 2024 & 2021 |
KO | 23.4% | 22.2% | 25.3% | 23.5% | 0.0% |
PEP | 9.9% | 10.3% | 9.6% | 10.1% | -0.2% |
MNST | 22.84% | 18.88% | 24.86% | 30.65% | -7.8% |
KDP | 14.72% | 10.22% | 16.92% | 11.40% | 3.3% |
According to Table 2 and Fig. 1, over the last 4 years, Monster Beverage Corporation experienced a significant decline in annual gross margin and annual net profit margin, while the other three companies are relatively at the same level during the four years. Besides, annual and quarterly trends are almost consistent, but quarterly data show more short-term volatility and seasonal changes. Thus, analysts' expectation that Monster Beverage Corporation's EPS will grow at 15.72% might be overly optimistic.
3.2. Explanation and Implications
Investing in Monster Beverage Corporation is a wise choice for the following reasons. Firstly, for financial factors, MNST has the lowest PEG ratio and high growth rates, which is good for long-term investment. Secondly, external factors including the innovation of new flavors, market expansion, and market demand, prove MNST’s sustainability and are conducive to investors.
There are several risks to investing in MNST. Firstly, seen from the results, investing in Monster Beverage Corporation might take on a financial risk caused by the declining annual net profit margin. However, MNST has a high growth potential which shows the long-term investment value. Additionally, operational risks including the dependency on relationships with TCCC and the increasing competition emerge. However, according to MNST’s annual report, they have independent companies that are not aligned with TCCC’s interest and have robust brand positions and market shares in the soft drink market [12]. Besides, industry risks, such as the change in consumer preferences in the future, might be a consideration. To solve this problem, the company will develop new innovative beverages based on new trends to appeal to consumers continuously. Therefore, though investing in MNST has risks, investors are worth trying and taking on the risk since MNST will bring more benefits over risks and the risks can be managed.
3.3. Limitations and Prospects
The paper may not consider the market conditions, including inflation, global economic trends, consumer preferences change etc. Moreover, for the comparison analysis, different companies have different geographic scopes which may influence the profitability metrics. To improve, future research should use more predicting tools such as machine learning and large-language model to identify trends more accurately. In addition, the paper should consider long-term trends including tracing data for a longer period and considering sustainability competency. By addressing the limitations and exploring the prospects, future research can be more accurate and comprehensive for gaining insights into both financial and macro aspects.
4. Conclusion
To sum up, this study discussed the financial performance between MNST, KO, PEP and KDP. Monster Beverage Corporation stands out in the four companies because of its great financial metrics including its lower PEG ratio and higher revenue growth rate and EPS growth rate. Additionally, external factors such as innovation in flavor in MNST make it a sustainable competency. This paper fills out the vacancy for investment suggestions based on the four companies in the soft drink industry, which helps investors make decisions in value investing. However, the paper analyzed data based on the present data and industry status without predicting the future market condition by using model tools. Future studies should build more models for predicting market development, so as to make the investment suggestion more reliable.
References
[1]. Statista. (2020) Soft drinks - worldwide: Statista market forecast. Retrieved from: https://www.statista.com/outlook/cmo/non-alcoholic-drinks/soft-drinks/worldwide
[2]. Huse, O., Reeve, E., Bell, C., Sacks, G., Baker, P., Wood, B. and Backholer, K. (2022) Strategies used by the soft drink industry to grow and sustain sales: a case-study of The Coca-Cola Company in East Asia. BMJ global health, 7(12), e010386.
[3]. Medical And Pharmaceutical Updates. (2024, March 13). Soft drink market 2024 : Trends and future growth analysis | 2031. LinkedIn. Retrieved from: https://www.linkedin.com/pulse/soft-drink-market-2024-trends-future-xf6ff/
[4]. Pinna, C., Demartini, M., Tonelli, F. and Terzi, S. (2018) How soft drink supply chains drive sustainability: Key performance indicators (KPIs) identification. Procedia CIRP, 72, 862-867.
[5]. Raihan, A.S., Ali, S.M., Roy, S., Das, M., Kabir, G. and Paul, S.K. (2022) Integrated model for soft drink industry supply chain risk assessment: Implications for sustainability in emerging economies. International Journal of Fuzzy Systems, 24(2), 1148-1169.
[6]. Vinut, G. (2023) Top 10 Soft Drink Companies Leading the Global Beverage Industry. Retrieved from: https://vinut.com.vn/2023/blogs/top-10-soft-drink-companies-leading-the-global-beverage-industry/
[7]. Manturov, M. (2024) Top 2 stocks with strong prospects in the energy drinks market. Monster: major beverage company with 31.3% upside potential. TURLOV family office securities, 15097.
[8]. Madrid. (2019) Financial Analysis of the Financial Statements and Industry Comparison: THE COCA-COLA COMPANY and PEPSICO. Colegio Universitario de Estudios Financieros. Retrieved from: https://biblioteca.cunef.edu/files/documentos/TFG_Juan_Errandonea.pdf
[9]. Farooque, F. (2023) Coca-Cola vs. PepsiCo: A Financial Showdown Reveals the King of Carbonated Efficiency. Yahoo Finance. Retrieved from https://finance.yahoo.com/news/coca-cola-vs-pepsico-financial-195103383.html
[10]. Forbes. (2024). Is Keurig Dr Pepper Stock A Better Beverage Pick Over Coca-Cola? Retrieved from: https://www.forbes.com/sites/greatspeculations/2024/07/08/is-keurig-dr-pepper-stock-a-better-beverage-pick-over-coca-cola/
[11]. Dube, J. (2005) Product differentiation and mergers in the carbonated soft drink industry. Journal of Economics & Management Strategy, 14(4), 879-904.
[12]. Monster Energy Corporation. (2024) Monster Energy Corporation 2023 Annual Report. Retrieved from: https://investors.monsterbevcorp.com/static-files/b63bf10a-4504-4605-87dd-b95efb2cfce1
Cite this article
Wang,Y. (2024). Analysis of Financial Performances for Monster Beverage: Comparison with KO, PEP and KDP. Advances in Economics, Management and Political Sciences,108,160-165.
Data availability
The datasets used and/or analyzed during the current study will be available from the authors upon reasonable request.
Disclaimer/Publisher's Note
The statements, opinions and data contained in all publications are solely those of the individual author(s) and contributor(s) and not of EWA Publishing and/or the editor(s). EWA Publishing and/or the editor(s) disclaim responsibility for any injury to people or property resulting from any ideas, methods, instructions or products referred to in the content.
About volume
Volume title: Proceedings of the 3rd International Conference on Financial Technology and Business Analysis
© 2024 by the author(s). Licensee EWA Publishing, Oxford, UK. This article is an open access article distributed under the terms and
conditions of the Creative Commons Attribution (CC BY) license. Authors who
publish this series agree to the following terms:
1. Authors retain copyright and grant the series right of first publication with the work simultaneously licensed under a Creative Commons
Attribution License that allows others to share the work with an acknowledgment of the work's authorship and initial publication in this
series.
2. Authors are able to enter into separate, additional contractual arrangements for the non-exclusive distribution of the series's published
version of the work (e.g., post it to an institutional repository or publish it in a book), with an acknowledgment of its initial
publication in this series.
3. Authors are permitted and encouraged to post their work online (e.g., in institutional repositories or on their website) prior to and
during the submission process, as it can lead to productive exchanges, as well as earlier and greater citation of published work (See
Open access policy for details).
References
[1]. Statista. (2020) Soft drinks - worldwide: Statista market forecast. Retrieved from: https://www.statista.com/outlook/cmo/non-alcoholic-drinks/soft-drinks/worldwide
[2]. Huse, O., Reeve, E., Bell, C., Sacks, G., Baker, P., Wood, B. and Backholer, K. (2022) Strategies used by the soft drink industry to grow and sustain sales: a case-study of The Coca-Cola Company in East Asia. BMJ global health, 7(12), e010386.
[3]. Medical And Pharmaceutical Updates. (2024, March 13). Soft drink market 2024 : Trends and future growth analysis | 2031. LinkedIn. Retrieved from: https://www.linkedin.com/pulse/soft-drink-market-2024-trends-future-xf6ff/
[4]. Pinna, C., Demartini, M., Tonelli, F. and Terzi, S. (2018) How soft drink supply chains drive sustainability: Key performance indicators (KPIs) identification. Procedia CIRP, 72, 862-867.
[5]. Raihan, A.S., Ali, S.M., Roy, S., Das, M., Kabir, G. and Paul, S.K. (2022) Integrated model for soft drink industry supply chain risk assessment: Implications for sustainability in emerging economies. International Journal of Fuzzy Systems, 24(2), 1148-1169.
[6]. Vinut, G. (2023) Top 10 Soft Drink Companies Leading the Global Beverage Industry. Retrieved from: https://vinut.com.vn/2023/blogs/top-10-soft-drink-companies-leading-the-global-beverage-industry/
[7]. Manturov, M. (2024) Top 2 stocks with strong prospects in the energy drinks market. Monster: major beverage company with 31.3% upside potential. TURLOV family office securities, 15097.
[8]. Madrid. (2019) Financial Analysis of the Financial Statements and Industry Comparison: THE COCA-COLA COMPANY and PEPSICO. Colegio Universitario de Estudios Financieros. Retrieved from: https://biblioteca.cunef.edu/files/documentos/TFG_Juan_Errandonea.pdf
[9]. Farooque, F. (2023) Coca-Cola vs. PepsiCo: A Financial Showdown Reveals the King of Carbonated Efficiency. Yahoo Finance. Retrieved from https://finance.yahoo.com/news/coca-cola-vs-pepsico-financial-195103383.html
[10]. Forbes. (2024). Is Keurig Dr Pepper Stock A Better Beverage Pick Over Coca-Cola? Retrieved from: https://www.forbes.com/sites/greatspeculations/2024/07/08/is-keurig-dr-pepper-stock-a-better-beverage-pick-over-coca-cola/
[11]. Dube, J. (2005) Product differentiation and mergers in the carbonated soft drink industry. Journal of Economics & Management Strategy, 14(4), 879-904.
[12]. Monster Energy Corporation. (2024) Monster Energy Corporation 2023 Annual Report. Retrieved from: https://investors.monsterbevcorp.com/static-files/b63bf10a-4504-4605-87dd-b95efb2cfce1