


1. Introduction
In the domestic and international stock investment market, investors must have a set of scientific and effective theories and methods of investment activities that are suitable for their own investment concepts in order to reduce the errors and risks arising from their own investments. In the past, domestic and foreign research has mainly focused on the use of traditional stock value analysis methods such as the price-earnings ratio method and the price-to-book ratio method, but there is still a relative lack of research on the return on net assets reflected in the financial statements.
And due to the growing concern for national education in today's society, the investment in education industry funding continues to increase, and education industry stocks have become popular investment objects in the stock market. Therefore, this paper takes listed companies in the education industry as an example and constructs a new comprehensive multi-indicator evaluation system that is different from the traditional comprehensive evaluation system of financial indicators, so as to provide guidance and reference for investors.
Scholars have carried out various researches on stock value assessment. Zhang et al. studied whether the listed company's stock has investment value, using traditional stock investment methods, the company's stock valuation, through a variety of analyses to study whether Jichuan Pharmaceuticals shares have investment value [1]. The new Crown Pneumonia epidemic that started in 2020 has affected not only the domestic economic situation, but also the ensuing downturn in the international economic situation. Song believed that the relationship between stock prices and the intrinsic value of a company should be considered and then used relative valuation methods [2]. In recent years, China has attached more and more importance to the concept of sustainable development and environmental protection, so green finance has flourished and gradually appeared in front of people. In order to assess the overall value of green stocks more realistically, Hu divided the selected cases into pure stocks and "green" options, and adopted the traditional income approach and B-S option pricing model respectively [3].
To address the issue of assessing the investment value of the stocks on the Science and Technology Innovation Board (STB), Gu et al. analyzed the latest financial statement data of the 25 companies listed in the first batch of the STB. They used factor analysis to provide clear investment strategy recommendations to help investors narrow down the scope more precisely, so as to visualize and maximize returns, which is conducive to reducing investment risks [4]. In terms of the macro-industry, in order to study whether shares of listed companies in beverage and food products have investment value, Hua took the concept of value investment as the theoretical basis and the fundamental analysis as the overall framework, and analyses the macro-environment of the food and beverage industry based on the (Politics, Economy, Society, Technology) PEST Analysis [5].
Many foreign scholars have carried out extensive research on investment strategies, expanding the content to subjective judgement and prediction. Lin et al. used a large sample of Chinese a-shares to test the ability of sentiment indicators to predict stock volatility across different forecast ranges and over different time horizons, controlling for the indicator [6]. Jagirdar et al. aimed to analyze the value of investment strategies and inverse investment using empirical evidence by the creation of return portfolios of stocks listed on the Bombay Stock Exchange (BSE) in India from 1990 to 2018. A Wayne diagram is created, from which stock selection under both investment strategies and analysts' forecast recommendations are obtained [7]. Currently people are investing with high risk in stock market without proper analysis. Therefore, Manjunath argued that it is crucial to recognize equity market value forecasts through the available data sets of the stock market and such analysis can be carried out through machinery learning algorithms [8]. Li et al. proposed a modelling strategy based on machine learning methods and econometric models, thus introducing a reliable forecasting model. Based on the identification of the various frequency components of the timeseries, an optimized Support Vector Machine (SVM) is used to achieve the non-linear features of stock prices [9]. Dai et al. conducted a principal component analysis (PCA) of policy uncertainty indices of 20 major global economies. It is found that the PCA-based index of uncertainty in economic policy around the world is a well proxy for the policy uncertainty in the economy at the global level, which matches quite well with the GDP-weighted index of uncertainty in economic policy around the world [10].
2. Methodology
2.1. Data Source and Description
The data below are all from the official website of the National Bureau of Statistics, the Oriental Wealth Network, the official website of each listed company's annual financial report data in the past five years, and the quarterly report of the company in the past year (with 2023 as the main year). When selecting the stock data of the companies in the field of education, this paper selects the representative 18 companies according to their development status in recent years and the completeness of the listed companies' financial report data.
Due to the different collection methods and measurement standards of some listed companies' financial report data, resulting in missing and incomplete data in some indicators, so this paper has firstly processed, deleted and standardized the missing data.
2.2. Indicators Selection and Description
This paper reflects the stock investment value of the last company from four first-level indicators: solvency, profitability, development ability, operational ability, and these four first-level indicators can be reflected by nine second-level indicators. The basic framework of the comprehensive evaluation system of financial indicators determined in this paper is shown in Table 1. This paper has selected the following nine secondary indicators:
Table 1: Summary of indicators related to annual financial reports of listed companies in the education sector.
Indicator | Data | Symbol | |
Solvency | Cash flow ratio | \( {x_{1}} \) | |
Cash ratio | \( {x_{2}} \) | ||
Gearing Ratio | \( {x_{3}} \) | ||
Revenue capacity | Gross Profit Ratio Net Profit Ratio | \( {x_{4}} \) \( {x_{5}} \) | |
Development capacity | Sales Expense Ratio | \( {x_{6}} \) | |
Total Assets Growth Rate | \( {x_{7}} \) | ||
Operational Capacity | Total Assets Turnover Ratio | \( {x_{8}} \) | |
Current Assets Turnover Ratio | \( {x_{9}} \) | ||
2.3. Methodology
This paper adopts the financial report data of listed companies' financial statements in the past five years, takes the education field as an example, and uses the combination of principal component analysis and entropy value method to carry out the construction of multi-indicator comprehensive evaluation system model, assesses and analyses the stock data, and obtains the comprehensive scores of the stocks, and then compares the obtained results with the traditional principal component analysis method. Finally, cluster analysis is used to classify the stocks and judge the value of the stocks, so as to help decision makers to make investment.
3. Results and Discussion
3.1. Descriptive Analysis
The cluster analysis allows people to classify the investment value of 18 family company stocks. The clustering results are obtained by running the data through SPSS, and the 18 company stocks are clustered into 3 types. As shown in Figure 1, the cluster analysis divides all the samples into 3 categories based on the data characteristics, which are named as high-value stocks, potential stocks, and low-value stocks.
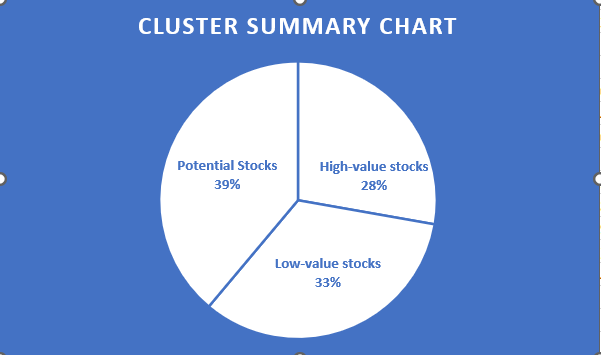
Figure 1: Cluster summary chart
The first category is potential stocks, including Meijim, Qinshang, Kevin Education, ST Sansheng, Tong Tong Education, Borui Communication, and Dongfang Fashion. The second category is the low-value stock category, i.e. Xueda Education, Zhonggong Education, ST Dou Shen, KeDe Education, Kaiyuan Education, and Angli Education. The third category is the high-value stock category, which specifically includes TranSwitch Education, Venture Horse, National New Culture, China Gaoke, and Action Education.
It can be seen that 28% of the stocks of the 18 companies fall into the third category, all of which are high-value stocks worth investing in. In addition, 39% of these stocks have potential and are worth considering for investment.
3.2. Principal Component Analysis
For principal component analysis, the nine indicators of the selected samples are used as the original variables, and the R language is used to analyze the principal components of the financial data of 18 listed companies in the market in the past five years after taking the mean value, in order to achieve the purpose of dimensionality reduction. For the entropy weight method, the following formula is utilized for the calculation of the values of indicators of different nature.
First of all, for the indicators with smaller and better values, the analysis uses the ascending half trapezoidal distribution function, as shown in equation (1).
\( f(x)=\begin{cases} \begin{array}{c} 0 {a_{2}} ≤ x \\ ({a_{2}}-x)/({a_{2}}-{a_{1}}) {a_{1}}≤ x \lt {a_{2}} \\ 1 0≤ x \lt {a_{1}} \end{array} \end{cases} \) (1)
Secondly, for the indicators with larger and larger values, the analysis was done using the descending half trapezoidal distribution function, as shown in equation (2).
\( f(x)=\begin{cases} \begin{array}{c} 0 0≤ x{ \lt a_{1}} \\ (x-{a_{2}})/({a_{2}}-{a_{1}}) {a_{1}}≤ x \lt {a_{2}} \\ 1 {a_{2}}≤ x \end{array} \end{cases} \) (2)
For the indicator that exists between two values (set as \( {a_{1}} \) 、 \( {a_{2}} \) ) where a certain value \( a \) is the best, a triangular distribution function is used, as shown in equation (3).
\( f(x)=\begin{cases} \begin{array}{c} (x-{a_{1}})/(a-{a_{1}}) {a_{1}}≤ x \lt a \\ ({a_{2}}-x)/({a_{2}}-a) a≤ x \lt {a_{2}} \\ 0 {a_{2}}≤ x or x \lt {a_{1}} \end{array} \end{cases} \) (3)
The parameters \( {a_{1}}, {a_{2}}, a \) in equations (1), (2) and (3) are set separately according to the specific characteristics of each indicator.
3.3. Model Results
Table 2 shows the results of KMO test and Bartlett's Spherical test, the results show that the value of KMO is 0.616 and the P-value of significance is 0.047**, thus justifying the rejection of the original hypothesis, thus proving that the variables are correlated. In this regard, it was concluded that principal component analysis is effective.
Table 2: KMO test and Bartlett's test
KMO values | 0.616 | |
Bartlett's test of sphericity | Approximate chi-square | 54.697 |
df | 36 | |
P | 0.047** | |
The eigen-roots, variance contributions and cumulative variance contributions of the correlation coefficient matrix are given in Table 3.
Table 3: Eigenvalues (variance) and principal component contributions of the standardized matrices
ingredient | characteristic root | ||
characteristic root | Variance contribution (%) | Cumulative variance contribution (%) | |
1 | 2.972 | 33.026 | 33.026 |
2 | 1.971 | 21.901 | 54.927 |
3 | 1.703 | 18.919 | 73.846 |
4 | 0.828 | 9.203 | 83.048 |
5 | 0.455 | 5.06 | 88.108 |
6 | 0.409 | 4.539 | 92.647 |
7 | 0.278 | 3.089 | 95.736 |
8 | 0.201 | 2.228 | 97.965 |
9 | 0.183 | 2.035 | 100 |
From Table 3, it can be concluded that when the number of principal components is four, the characteristic root explained by the total variance is lower than one, while at the same time the contribution of the variable explanation reaches 83.048, so four principal components were selected.
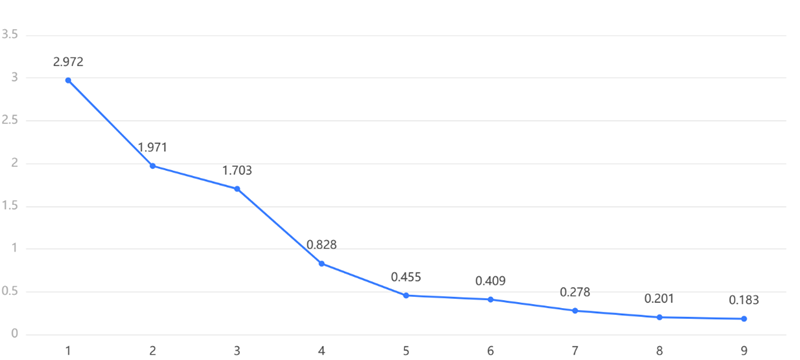
Figure 2: Gravel diagram (The horizontal coordinates indicate the number of factors and the vertical coordinates indicate the characteristic roots)
Similarly, as Figure 2 shows that at the number of principal components of 4, the characteristic root reaches 82.8%, which is more than 80%, and the trend tends to stabilize with the growth of the number of principal components, so the most appropriate number of principal components is chosen as 4 in this paper.
Finally, the scores are ranked and the linear combinations of the original variables are used to calculate the principal components, and the component matrix is shown in Table 4.
Table 4: Component matrix
norm | ingredient F1 | ingredient F2 | ingredient F3 | ingredient F4 | |
x1 | -0.142 | 0.123 | 0.268 | 0.843 | |
x2 | 0.224 | 0.292 | 0.045 | 0.241 | |
x3 | 0.282 | 0.016 | 0.215 | 0.147 | |
x4 | 0.036 | 0.425 | -0.169 | -0.053 | |
x5 | -0.036 | 0.206 | 0.46 | -0.249 | |
x6 | -0.037 | 0.415 | -0.198 | -0.229 | |
x7 | 0.186 | -0.036 | 0.351 | -0.476 | |
x8 | -0.262 | 0.075 | 0.246 | -0.103 | |
x9 | 0.281 | -0.067 | -0.063 | 0.251 |
Taking the variance contribution ratio of the four principal components as weights, the comprehensive evaluation index F for listed companies in the education sector is constructed:
\( F=(0.33×F1+0.219×F2+0.189×F3+0.092×F4)/0.83 \) (4)
According to formula (4), the comprehensive evaluation index scores (principal component analysis and rankings) of the investment value of 18 stocks are calculated as shown in Table 5. As can be seen, the principal component analysis method yields that the investment value of Guoxin Culture is the largest, China Hi-Tech is the second largest, and ST Dou Shen is the smallest. China Hi-Tech is the second largest, and ST Dou Shen has the smallest investment value.
Table 5: Composite scores and rankings of principal component method
aggregate score | principal component 1 | principal component 2 | principal component 3 | principal component 4 | rankings | |
Guoxin Culture | 1.258 | 1.446 | 1.872 | 0.462 | 0.759 | 1 |
China High Tech | 0.727 | 1.548 | 1.305 | -0.884 | -0.285 | 2 |
Transnational Education | 0.505 | 0.523 | 0.622 | 0.713 | -0.263 | 3 |
Action Education | 0.414 | 0.132 | 1.510 | -0.087 | -0.148 | 4 |
Qinshang | 0.358 | 0.630 | -0.569 | 0.578 | 1.132 | 5 |
KD Education | 0.227 | -0.573 | -0.317 | 1.867 | 1.026 | 6 |
BORI Communication | 0.168 | 0.742 | -0.580 | 0.375 | -0.532 | 7 |
Venture Horse | 0.141 | 0.187 | 0.396 | 0.058 | -0.463 | 8 |
Kevin Education | 0.032 | 0.519 | -1.339 | 0.230 | 1.139 | 9 |
Oriental Fashion | -0.057 | -0.104 | -0.567 | 0.640 | -0.105 | 10 |
Alltone Education | -0.129 | -0.066 | -0.945 | 0.534 | 0.224 | 11 |
Angli Education | -0.196 | -0.864 | 0.548 | 0.252 | -0.491 | 12 |
*ST Sansheng | -0.375 | 1.210 | -1.638 | -0.509 | -2.784 | 13 |
Xueda Education | -0.403 | -1.214 | -0.521 | 0.969 | -0.038 | 14 |
Meijim | -0.501 | 0.357 | -0.900 | -2.604 | 1.694 | 15 |
Zhonggong Education | -0.667 | -1.595 | 0.600 | -0.358 | -0.989 | 16 |
Kaiyuan Education | -0.687 | -1.691 | 0.825 | -0.890 | -0.262 | 17 |
*ST Dou Shen | -0.816 | -1.188 | -0.301 | -1.346 | 0.386 | 18 |
The principal component scores obtained using principal component analysis are weighted by the entropy weighting method to obtain a composite stock value evaluation score, the entropy weight information calculated by processing the indicators as shown in Table 6, F1 weight is 31.751%, F2 weight is 36.333%, F4 weight is 16.508%, F3 weight is 15.408%, which the weight of the indicator The maximum value is F2 (36.333%) and the minimum value is F3 (15.408%) The order of importance of the indicators is shown in table 6.
Table 6: Entropy weight calculation results
Standardized indicator | Information entropy value e | Information utility value d | Weight (%) |
F1 | 0.927 | 0.073 | 31.751 |
F2 | 0.916 | 0.084 | 36.333 |
F3 | 0.965 | 0.035 | 15.408 |
F4 | 0.962 | 0.038 | 16.508 |
Therefore, the comprehensive evaluation index F^' under the entropy weighting method is calculated as in Equation (5):
\( {F^{ \prime }}=0.31751×F1+0.36333×F2+0.15408×F3+0.16508×F4 \) (5)
Using the component coefficients in Table 4, Equation (6) reduces the initial nine indicators to obtain the linear combination \( {F^{ \prime }} \) formula as follows:
\( {F^{ \prime }}=0.069*{x_{6}}+0.018*{x_{7}}-0.037*{x_{8}}+0.13*{x_{4}}+0.099*{x_{9}}+0.153*{x_{3}}+0.182*{x_{1}}+0.225*{x_{2}}+0.089*{x_{5}} \) (6)
Table 7: Comprehensive evaluation results under the combination of principal components and entropy weighting method
Comprehensive Evaluation | Ranking | |
Guoxin Culture | 0.8955 | 1 |
China High Tech | 0.7764 | 2 |
Transnational Education | 0.6689 | 3 |
Action Education | 0.6370 | 4 |
Qinshang | 0.5765 | 5 |
KD Education | 0.5549 | 6 |
BORI Communication | 0.5156 | 7 |
Venture Horse | 0.5022 | 8 |
Kevin Education | 0.4747 | 9 |
Oriental Fashion | 0.4657 | 10 |
Alltone Education | 0.4562 | 11 |
Angli Education | 0.4500 | 12 |
*ST Sansheng | 0.4316 | 13 |
Xueda Education | 0.3907 | 14 |
Meijim | 0.3611 | 15 |
Zhonggong Education | 0.3535 | 16 |
Kaiyuan Education | 0.3508 | 17 |
*ST Dou Shen | 0.3401 | 18 |
According to the analysis of the weighted results of the indicators, the two indicators, cash ratio and cash flow ratio, dominate the comprehensive evaluation, and their weights are 0.182 and 0.225, respectively.
From equation (6), the comprehensive evaluation of investment value of 18 stocks under the combination of principal components and entropy weighting method is shown in Table 7. It can be seen that the combination of principal component and entropy weighting method results in the largest investment value of Guoxin Culture, followed by China Gaoke, and the smallest investment value of ST Dou Shen.
3.4. Comparative Analysis
Table 8 compares the rankings of 18 companies under the evaluation method of entropy weight method combined with principal component analysis with the rankings of 18 companies under the evaluation method of traditional principal component analysis.
Table 8: Combined entropy weighting method versus traditional principal component method ranking
Stock Name | Traditional Principal Components Ranking | Ranking by Principal Components Combined with Entropy Weighting | |
Guoxin Culture | 1 | 1 | |
China High Tech | 2 | 2 | |
Transnational Education | 3 | 4 | |
Action Education | 4 | 3 | |
Qinshang | 5 | 5 | |
KD Education | 6 | 8 | |
BORI Communication | 7 | 7 | |
Venture Horse | 8 | 6 | |
Kevin Education | 9 | 9 | |
Oriental Fashion | 10 | 12 | |
Alltone Education | 11 | 13 | |
Angli Education | 12 | 10 | |
*ST Sansheng | 13 | 17 | |
Xueda Education | 14 | 16 | |
Meijim | 15 | 11 | |
Zhonggong Education | 16 | 15 | |
Kaiyuan Education | 17 | 14 | |
*ST Dou Shen | 18 | 18 | |
Firstly, among the top five stocks in the ranking, Guoxin Culture is ranked No.1 in the traditional principal component analysis method and No.1 in the analysis of principal component combined with entropy weighting method, which is in line with the reality. Meanwhile, China Hi-Tech and Qinshang ranked 2nd and 5th respectively in the combined entropy power method, which is consistent with the traditional method, and the rankings of Chuanzhi Education and Action Education are also close to the same. The rest of the ranking matches are Borealis, Kevin Education, and *ST Dou Shen, respectively, which are ranked consistently in both methods. On the contrary, *ST Sansheng is ranked 13th in the traditional method, but its score is ranked 17th in the method combining entropy weighting.
Of all the stocks, 80% of the rankings derived by with the two methods are closer, indicating that the conclusions drawn by the principal component combined with entropy weight method are more effective.
Secondly, this paper compares and analyzes the results of the integrated evaluation of financial indicators of the last five listed companies ranked by the two methods of analysis with the stocks traditionally ranked in the last five, and this paper can find that the last ones are *ST Dou Shen, which is much weaker in terms of its capacity for equity expansion and profitability compared to the other listed companies selected.
The above two methods of comparative analysis of the results obtained although there is still a slight difference, but for most of the stocks, its development trend and the actual compared to the basic match, so the results of data analysis reflect the model of this paper's research and analysis is more objective and accurate, investors in the stock investment have a certain significance of guidance.
4. Conclusion
This paper uses innovative thinking to combine the two methods for the construction of the model, which not only achieves the purpose of dimensionality reduction, but also avoids the bias of the results of principal component analysis caused by the weak correlation between the indicators, and the results obtained by the combination of the methods are more intuitive and operationally simpler compared with the traditional principal component analysis.
Comparing the rankings of the 18 selected stocks obtained from the combination of principal component analysis and entropy weighting method with the rankings calculated by the traditional method, it can be seen that the rankings obtained from the two methods can reach 80% and above for the comprehensive multi-indicator evaluation analysis in the past five years. Due to the unstable fluctuation of the stock market, the analysis results and investment recommendations obtained from this paper can also match the actual investment situation of the stock market by more than 60%.
Through the construction of a comprehensive multi-indicator stock value evaluation model to judge the investment value of the stock, the stock with a higher comprehensive score and higher ranking indicates that its investment value is greater, investors can buy the stock accordingly; on the contrary, this paper should not consider buying or sell appropriately. This application is more specifically manifested in finding the value of a company's stock to realize the investment decision. According to the results of the study, Transn Education, Venture Dark Horse, National New Culture, China High Tech, and Action Education are all high value stocks in the education category and are worth investing in, while Meijim, Chinshang, and Kelvin Education are potential education stocks and can be invested in considering their development status.
The stock market is changing rapidly and there are many factors affecting the development of stocks. The data selected for this paper comes from the financial data statements of listed companies for the last five years. In terms of timeliness, this may only be able to reflect the development of companies in a certain period of time. In terms of scope, it also does not provide a more complete picture of the development of the stock market as a whole. In the future, it is hoped that the selection of data will be more comprehensive so that the results of the analysis will be more valuable. In addition, the models made by principal component analysis and entropy weight method in this paper still need to do further research to make the analysis results more objective and accurate.
Through the experimental analysis in this paper, the use of principal component analysis and entropy weight method to extract information in a large number of financial indicators of listed companies, according to the breakdown of the solvency, profitability, development capacity, operational capacity and other indicators of public companies, can be more objective, scientific and systematic. It also improves the correctness and reliability of the selected financial indicators of listed companies. Although, after using these methods to analyze the raw financial data of listed companies, people can get some more objective guidance conclusions, but the author of this paper has limited ability, and the guidance given is relatively shallow. As a large number of domestic and foreign scholars believe that there are many uncontrollable factors in the stock market itself, which precisely shows that investors cannot rely on speculative psychology when investing, but to seek a more reasonable method of analyzing the value of stock investment. However, this paper still needs to make further efforts to get some more accurate and objective guidance conclusions. The author hopes to use statistical algorithms to carry out in-depth research in the future, and at the same time become more familiar with the use of statistical analysis methods, in order to provide strategies for stock investors who are looking for effective investment methods.
References
[1]. Zhang, Y.K., Liu, Y.P. and Zhang, W.D. (2024) Investment Value Analysis of Jichuan Pharmaceutical. Co-operative Economy and Technology, 6, 62-65.
[2]. Song, Z.H. (2023) Investment Value Analysis of Listed Companies Based on Stock Valuation Methods--Taking Ping An Bank as an Example. Modern Marketing (Lower Decade), 12, 29-31.
[3]. Hu, H.M. (2020) Research on Green Stock Investment Value Assessment. Chongqing University of Technology.
[4]. Gu, B.T., Zhu, J.M. and Huang, T.L. (2020) Research on the investment value of science and innovation board stocks based on factor analysis and cluster analysis. Journal of Jilin College of Agricultural Science and Technology, 29(03), 44-49.
[5]. Hua, P.P. (2024). Research on Investment Value of Stocks of Listed Companies in Food and Beverage Industry-Based on PEST Model and Factor Analysis Model. Journal of Business and Management, 2, 1-13.
[6]. Lin, P., Ma, S.H. and Fildes, R. (2024) The extra value of online investor sentiment measures on forecasting stock return volatility: A large-scale longitudinal evaluation based on Chinese stock market. Expert Systems With Applications, 238, 121-128.
[7]. Jagirdar, S.S., and Gupta, P.K. (2023) Value and contrarian investment strategies: evidence from Indian stock market. Journal of Risk and Financial Management, 16(2), 113.
[8]. Manjunath K.V., and Chandra S.M. (2023) Efficient prediction of future stock values with Gann square using machine learning algorithm. International Journal of Modeling, Simulation, and Scientific Computing, 14(01), 203-208.
[9]. Li, R., Han, T. and Song, X. (2022) Stock price index forecasting using a multiscale modelling strategy based on frequency components analysis and intelligent optimization. Applied Soft Computing Journal, 124.
[10]. Dai, P.F., Xiong, X. and Zhou, W.X. (2020) A global economic policy uncertainty index from principal component analysis. Finance Research Letters.
Cite this article
Tan,J. (2024). Research on Statistical Assessment Methods of Stock Investment Value-Taking Education Industry as Example. Advances in Economics, Management and Political Sciences,118,8-18.
Data availability
The datasets used and/or analyzed during the current study will be available from the authors upon reasonable request.
Disclaimer/Publisher's Note
The statements, opinions and data contained in all publications are solely those of the individual author(s) and contributor(s) and not of EWA Publishing and/or the editor(s). EWA Publishing and/or the editor(s) disclaim responsibility for any injury to people or property resulting from any ideas, methods, instructions or products referred to in the content.
About volume
Volume title: Proceedings of the 3rd International Conference on Financial Technology and Business Analysis
© 2024 by the author(s). Licensee EWA Publishing, Oxford, UK. This article is an open access article distributed under the terms and
conditions of the Creative Commons Attribution (CC BY) license. Authors who
publish this series agree to the following terms:
1. Authors retain copyright and grant the series right of first publication with the work simultaneously licensed under a Creative Commons
Attribution License that allows others to share the work with an acknowledgment of the work's authorship and initial publication in this
series.
2. Authors are able to enter into separate, additional contractual arrangements for the non-exclusive distribution of the series's published
version of the work (e.g., post it to an institutional repository or publish it in a book), with an acknowledgment of its initial
publication in this series.
3. Authors are permitted and encouraged to post their work online (e.g., in institutional repositories or on their website) prior to and
during the submission process, as it can lead to productive exchanges, as well as earlier and greater citation of published work (See
Open access policy for details).
References
[1]. Zhang, Y.K., Liu, Y.P. and Zhang, W.D. (2024) Investment Value Analysis of Jichuan Pharmaceutical. Co-operative Economy and Technology, 6, 62-65.
[2]. Song, Z.H. (2023) Investment Value Analysis of Listed Companies Based on Stock Valuation Methods--Taking Ping An Bank as an Example. Modern Marketing (Lower Decade), 12, 29-31.
[3]. Hu, H.M. (2020) Research on Green Stock Investment Value Assessment. Chongqing University of Technology.
[4]. Gu, B.T., Zhu, J.M. and Huang, T.L. (2020) Research on the investment value of science and innovation board stocks based on factor analysis and cluster analysis. Journal of Jilin College of Agricultural Science and Technology, 29(03), 44-49.
[5]. Hua, P.P. (2024). Research on Investment Value of Stocks of Listed Companies in Food and Beverage Industry-Based on PEST Model and Factor Analysis Model. Journal of Business and Management, 2, 1-13.
[6]. Lin, P., Ma, S.H. and Fildes, R. (2024) The extra value of online investor sentiment measures on forecasting stock return volatility: A large-scale longitudinal evaluation based on Chinese stock market. Expert Systems With Applications, 238, 121-128.
[7]. Jagirdar, S.S., and Gupta, P.K. (2023) Value and contrarian investment strategies: evidence from Indian stock market. Journal of Risk and Financial Management, 16(2), 113.
[8]. Manjunath K.V., and Chandra S.M. (2023) Efficient prediction of future stock values with Gann square using machine learning algorithm. International Journal of Modeling, Simulation, and Scientific Computing, 14(01), 203-208.
[9]. Li, R., Han, T. and Song, X. (2022) Stock price index forecasting using a multiscale modelling strategy based on frequency components analysis and intelligent optimization. Applied Soft Computing Journal, 124.
[10]. Dai, P.F., Xiong, X. and Zhou, W.X. (2020) A global economic policy uncertainty index from principal component analysis. Finance Research Letters.