


1. Introduction
With the rapid development of financial markets, securities price prediction has become a crucial topic in financial research. Accurate price predictions can help investors make informed decisions, enhance market stability, and reduce systemic risks. Traditional prediction methods mainly include time series analysis, technical analysis, and fundamental analysis. While these methods can explain and predict changes in security prices to some extent, their limitations become evident when faced with the complexity and nonlinearity of the market.
In recent years, advances in computing technology and data science have led to the increasing application of machine learning methods in the financial field. Compared to traditional methods, machine learning can better handle high-dimensional, nonlinear, and large datasets, thus showing higher predictive accuracy and applicability in securities price forecasting. This paper reviews several related studies, explore the application and effectiveness of different machine learning models in stock price prediction, and conducts empirical research with actual data to provide valuable references for future research and practice.
2. Research on Methods for Predicting Securities Prices
The prediction of market prices has always been a hot topic in financial research, as the accuracy of predictions directly affects investors' decisions and market stability. Traditional methods such as time series analysis, technical analysis, and fundamental analysis have been widely applied in the securities market. However, with continuous advancements in computing technology and statistical methods, modern techniques like machine learning and neural networks have gradually become the focus of research. This paper reviews various prediction methods for securities prices, discussing their advantages, disadvantages, and their application effects.
2.1. Traditional Prediction Methods
Traditional prediction methods include fundamental analysis, technical analysis, and time series analysis. Fundamental analysis involves predicting prices by studying economic factors, industry prospects, and company financial conditions. Technical analysis relies on historical price and trading volume data, using charts and indicators such as moving averages and relative strength index to predict price trends. Li Suping analyzed the application of fundamental and technical analysis in securities price forecasting, noting that fundamental analysis relies on a deep understanding of the macroeconomic environment and company fundamentals, while technical analysis mainly uses technical indicators and chart patterns for prediction. She proposed a model combining wavelet neural networks and grey system theory, which was empirically tested in the Shanghai Stock Market and found to be effective.
Time series analysis is a classical prediction method, including models like the Autoregressive Integrated Moving Average (ARIMA) and Generalized Autoregressive Conditional Heteroskedasticity (GARCH)[1]. These methods predict future prices by analyzing historical patterns in time series data. Liu Yezheng et al. proposed a method integrating time series analysis and morphological theory for securities price forecasting. Their study showed that the ARIMA model excels in short-term forecasting, while the GARCH model effectively captures the volatility characteristics of financial time series. By combining these two models, they developed a new composite prediction method, which was empirically validated to be effective in the Chinese securities market[2].
2.2. Modern Prediction Methods
Modern prediction methods are mainly based on machine learning and neural networks. With the growing computational power of computers, machine learning methods have shown significant advantages in securities price prediction due to their reliability. Li Xiaojie and Xia Chang conducted an empirical study using Sklearn's linear regression module, constructing a specific trading environment with JiuGuiJiu in the liquor industry as a case. Using historical trading volume and closing price data as input variables, the linear regression model was trained and predicted, yielding satisfactory results with RMSE=0.0254. The results indicate that machine learning algorithms can improve prediction accuracy to some extent[3]. Cheng Yanqiu studied stock price prediction methods based on Support Vector Machines (SVM). Through comparative experiments, she verified the stability and predictive accuracy of the SVM model in different market environments, proving the practicality of SVM in securities price prediction and its significant advantages in handling high-dimensional and nonlinear data[4].
Neural networks, especially deep learning, are increasingly applied in securities price prediction. Dou Wei proposed a stock price prediction model based on Long Short-Term Memory (LSTM) networks. LSTM can effectively capture long-term dependencies in time series data, significantly improving prediction accuracy. An empirical study on the CSI 300 Index validated the superiority of the LSTM model, demonstrating its excellent performance in handling complex financial data[5]. Niu Xiaonan researched the application of a combined model integrating LSTM and LightGBM in predicting CSI 300 stock index futures prices. The study showed that LSTM is adept at handling time series data, while LightGBM excels in managing high-dimensional data and preventing overfitting. The empirical study confirmed the effectiveness of the combined model, showing its stability and high predictive accuracy in various market conditions[6].
2.3. Special Prediction Methods
Special prediction methods mainly include composite prediction methods and grey system theory. Composite prediction methods enhance overall prediction performance by combining multiple single prediction methods and leveraging their respective advantages. Wang Yingying proposed research on securities prices based on composite prediction. She integrated various prediction models, such as ARIMA,GARCH,SVM, using a weighted average method to combine their prediction results. Empirical research showed that composite prediction methods outperform single prediction models in handling complex market environments, significantly improving prediction accuracy and stability.
Liu Yezheng et al. proposed a new composite prediction method combining time series analysis and morphological theory. They used the ARIMA model for short-term prediction while integrating morphological theory to assess market trends. Empirical studies revealed that this composite method effectively reduces prediction errors and enhances accuracy, providing more reliable decision-making support for investors.
Grey system theory performs well in dealing with uncertainty and small data samples. Li Suping researched grey prediction methods, proposing a model combining grey systems and neural networks. Empirical research on the Shanghai Stock Exchange Index showed that this model achieved good predictive results. The author noted that grey system theory provides effective predictions in situations with insufficient or incomplete data, highlighting its importance in addressing financial market complexities.
2.4. Summary and Analysis of Methods
There are numerous methods for predicting securities prices, each with its own strengths and weaknesses. Traditional methods like time series analysis and fundamental analysis are theoretically mature but practically limited; modern methods like machine learning and neural networks show higher predictive accuracy and applicability; composite prediction methods effectively enhance overall prediction performance by integrating the advantages of various methods. Future research should focus more on the integration and optimization of emerging methods to provide more reliable prediction tools in the ever-changing market environment.
3. Research Methods
3.1. Literature Review Method
The literature review method involves summarizing, analyzing, and synthesizing domestic and international literature on stock price prediction methods and machine learning models. This method aims to gather and summarize the current research outcomes and status of applying machine learning strategies to stock price prediction. By sifting through numerous literature sources, relevant theories and research findings are selected, categorized, and organized. Analyzing and reviewing these documents helps identify prediction models and methods pertinent to this study, providing theoretical support and guidance for subsequent empirical analysis and model construction.
3.2. Empirical Research Method
This study collected daily data of Meituan-W (3690), a representative constituent stock of the Hang Seng Index, up to June 20, 2024, from the Wind database. Data preprocessing was conducted through steps such as data cleaning, data standardization, and data splitting. Based on the results of the literature review, this study used five models—Support Vector Machine (SVM), Long Short-Term Memory network (LSTM), LightGBM, a combination of LSTM and LightGBM, and Convolutional Neural Network (CNN)—to predict the stock price of Meituan. The aim was to evaluate the applicability of machine learning methods in stock price prediction and propose corresponding improvement measures.
4. Model Introduction
4.1. SVM
Support Vector Machine (SVM) is a supervised learning algorithm widely used for classification and regression tasks. The goal of SVM is to find an optimal separating hyperplane that maximizes the margin between different classes of data points to achieve the best classification or regression results. SVM works by finding a hyperplane that separates different classes of data points. The optimal hyperplane is the one that maximizes the margin (i.e., the distance between the support vectors and the hyperplane) between the two classes. For data that is not linearly separable, SVM uses kernel functions ,such as Gaussian or polynomial kernels, to map the data into a higher-dimensional space where it becomes linearly separable. Support Vector Regression (SVR) is a variant of SVM that is used for regression problems. SVR works by finding a hyperplane that minimizes the distance of the data points to the hyperplane within a certain threshold. In stock price prediction, SVM is used to transform low-dimensional and nonlinear problems into high-dimensional and linear problems, making the data linearly separable in the high-dimensional space. In this study, the SVM model is constructed using the Radial Basis Function (RBF) kernel, which is a localized kernel function that depends on the distance between data points. The RBF kernel applies a Gaussian function between data points in the input space, effectively handling nonlinear data classification and regression problems, making the problem linearly separable in the high-dimensional space. It is widely used in SVM for classification, regression, and density estimation tasks.
4.2. LSTM
Long Short-Term Memory (LSTM) is a special type of recurrent neural network (RNN) specifically designed to process and predict time series data. By designing input gates, forget gates, and output gates, the unique gate structure of LSTM ensures that the model remembers useful information over long periods, avoiding the problem of forgetting long-term useful information. This solves the issues of gradient explosion and vanishing in recurrent neural networks. Gradient vanishing can cause uneven parameter tuning speeds in neural networks, while gradient explosion can cause instability in learning. The gate structure of the LSTM model helps retain memories of previously trained data, reducing the occurrence of gradient vanishing. LSTM can effectively address the long-term dependency issues in traditional RNNs, making it perform excellently in handling complex time series data. In stock price prediction, LSTM can leverage its powerful time series modeling capabilities to capture long-term trends and short-term fluctuations in stock prices, generating accurate prediction results. The gating mechanism of LSTM allows it to filter out irrelevant noise while retaining important information, improving the predictive performance and stability of the model.
4.3. LightGBM
Light Gradient Boosting Machine (LightGBM) is a gradient boosting framework based on decision trees that features high efficiency, low memory usage, and high accuracy. LightGBM iteratively trains a series of weak learners (typically decision trees), where each iteration's model is based on the residuals of the previous model. It uses a leaf-wise growth strategy instead of a level-wise growth strategy, allowing it to capture more complex data patterns within the same time frame. By continuously optimizing residuals, it progressively approximates the true values. The leaf-wise growth strategy starts growing from leaf nodes rather than root nodes, enhancing the model's complexity and accuracy.
4.4. LSTM and LightGBM Combined Model
While LightGBM can handle rich feature data, it is not inherently good at dealing with the temporal dependencies of time series data. In contrast, LSTM excels in processing time series data and capturing long-term dependencies. Stock prices and related indicators typically have time series characteristics, and LSTM can effectively model these time series data, capturing long-term trends and seasonal variations. Therefore, combining the two models can leverage their respective strengths. First, LSTM is used to process the time series data, and then the features extracted by LSTM are used as inputs to the LightGBM model. When dealing with complex time series data, LSTM may face overfitting issues, but by inputting the features extracted by LSTM into LightGBM, overfitting can be effectively mitigated, as LightGBM can perform ensemble learning across multiple decision trees, enhancing the model's generalization ability. LSTM captures dynamic changes in time series data, while LightGBM handles complex nonlinear relationships of features. Theoretically, combining LSTM and LightGBM models can utilize the strengths of both, improving overall prediction accuracy.
4.5. Convolutional Neural Network (CNN)
Convolutional Neural Networks (CNN) are specialized in processing data with grid-like topology. CNN consists of output layers, input layers, activation layers, convolutional layers, fully connected layers, and pooling layers. These layer structures give CNN characteristics like weight sharing, local perception, and multiple kernels. CNN has broad applications in image, speech, and text processing and has been researched for predicting financial time series. The convolutional layer is the core layer of the CNN structure where most computations occur. The convolutional layer can be considered an output of neurons, where each neuron observes a small portion of the data and shares parameters with neighboring neurons, reducing the number of parameters and computational load, thus preventing overfitting. The pooling layer's operations include average pooling and max pooling, with max pooling generally performing better. The pooling layer in the CNN structure can reduce the dimensionality of feature space. Fully connected layers connect all nodes in the current layer to the next layer.
5. Empirical Analysis
This study obtained stock price data of Meituan-W (3690) from the Wind database and used it as the analysis target. The dataset includes daily open price, close price, highest price, lowest price, trading volume, and price change percentage from January 2, 2020, to June 20, 2024. After data preprocessing, five models—Support Vector Machine (SVM), Long Short-Term Memory network (LSTM), LightGBM, a combination of LSTM and LightGBM, and Convolutional Neural Network (CNN)—were used to predict Meituan's stock price, and the results were analyzed.
5.1. Data Preprocessing
(1)Handling Missing Values: To ensure data integrity and prevent the model's predictive performance from being affected, missing values were handled first.
(2)Data Standardization: Data was read and sorted by date, and non-numeric characters in trading volume and price change percentage were removed and converted to numeric types. MinMaxScaler was used to standardize the closing prices, scaling the data to the [0, 1] range.
(3)Creating Time Series Data: The create_dataset function was defined to convert closing price data into time series data. The look_back parameter was used to represent how many past days' data were used to predict future closing prices.
(4)Splitting Training and Validation Sets: Time series data were split into training and test sets based on dates, ensuring the training set used data before March 1, 2024, and the test set used data from March 1, 2024, to June 20, 2024.
5.2. Model Evaluation Metrics
Machine learning model performance is often evaluated using multiple error analysis methods to determine the pros and cons of various prediction methods. Evaluating prediction results using a single error analysis method is not sufficiently reliable. Therefore, this section uses the following three metrics to evaluate the prediction results:
(1) Mean Squared Error (MSE): Measures the average squared difference between predicted and actual values.
\( MSE=\frac{\sum _{i=1}^{n}{({y_{t}}-\hat{{y_{t}}})^{2}}}{n} \)
(2) Root Mean Squared Error (RMSE): Represents the square root of the second moment of the differences between predicted and observed values.
\( RMSE=\sqrt[]{\frac{\sum _{i=1}^{n}{({y_{t}}-\hat{{y_{t}}})^{2}}}{n}} \)
(3) Mean Absolute Error (MAE): Measures the average absolute difference between predicted and actual values.
\( MAE=\frac{\sum _{i=1}^{n}|{y_{t}}-\hat{{y_{t}}}|}{n} \)
where n represents the number of samples in the test set, \( {y_{t}} \) represents the actual observed value at time t, and \( \hat{{y_{t}}} \) represents the predicted value at time t. The model's performance is evaluated based on these three metrics. Finally, a line chart of the actual values and predicted values is plotted to visualize the model's predictive effectiveness.
5.3. Model Construction and Analysis
Support Vector Machine (SVM), Long Short-Term Memory network (LSTM), LightGBM, a combination of LSTM and LightGBM, and Convolutional Neural Network (CNN) were used to predict the stock price data of Meituan. The performance of each model was calculated, and corresponding line charts were created for comparative analysis.
Table 1: Comparison of Model Performance | |||
Model | MSE | MAE | RMSE |
SVM | 21.39 | 3.81 | 4.63 |
LSTM | 17.65 | 3.37 | 4.2 |
LightGBM | 13.78 | 3.07 | 3.71 |
LSTM+LightGBM | 19.57 | 3.53 | 4.42 |
CNN | 25.36 | 3.87 | 5.04 |
5.3.1. SVM Model
The SVM model was trained using the Radial Basis Function (RBF) kernel. The fitting results showed a Mean Squared Error (MSE) of 21.39, Root Mean Squared Error (RMSE) of 4.63, and Mean Absolute Error (MAE) of 3.81. These results indicate relatively weak performance in stock price prediction. Although SVM can handle nonlinear data, the complexity and nonlinearity of stock price time series, coupled with the high training time complexity of SVM, make it inefficient for large-scale data processing. Additionally, SVM's inadequate handling of temporal dependencies means it cannot effectively capture long-term dependencies in time series data, resulting in lower prediction accuracy.
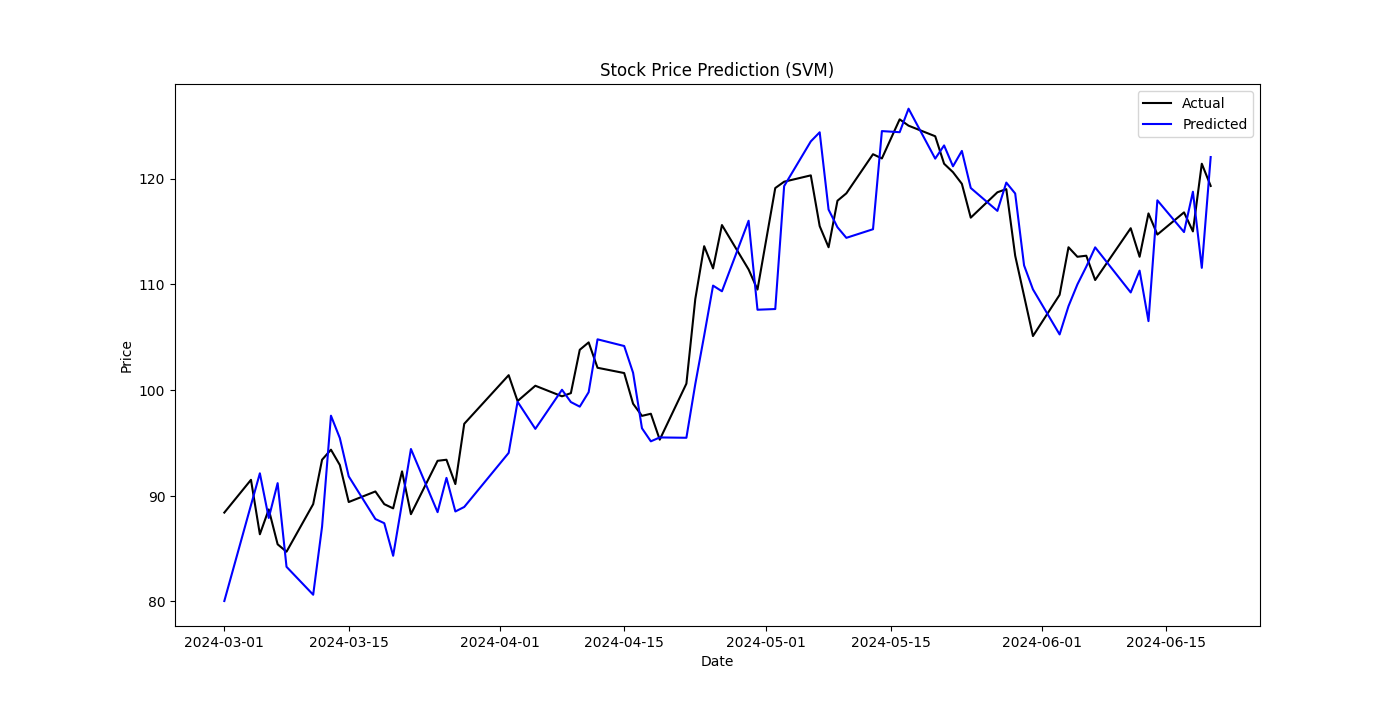
Figure 1: Stock Price Prediction(SVM)
5.3.2. LSTM Model
For the LSTM model, the objective was set to regression, the metric to Mean Squared Error (MSE), boosting type to Gradient Boosting Decision Tree (GBDT), learning rate to 0.01, and number of leaves to 31. The LightGBM model was then trained using `lgb.train` with early stopping to prevent overfitting.
The LSTM model's fitting results showed an MSE of 17.65, RMSE of 4.20, and MAE of 3.37, which is an improvement over the SVM model. LSTM's advantage lies in its ability to capture long-term dependencies, making it suitable for time series prediction. Its gate structure, input gate, forget gate, output gate, allows selective memory and forgetting of information, alleviating issues of gradient vanishing and exploding. However, LSTM requires longer training times and higher computational resources, and it is highly sensitive to hyperparameter settings. With increasing epochs, the model's fit can initially improve and then worsen due to overfitting. Although LSTM performs excellently in time series prediction, its effectiveness is limited by data scale and parameter tuning.
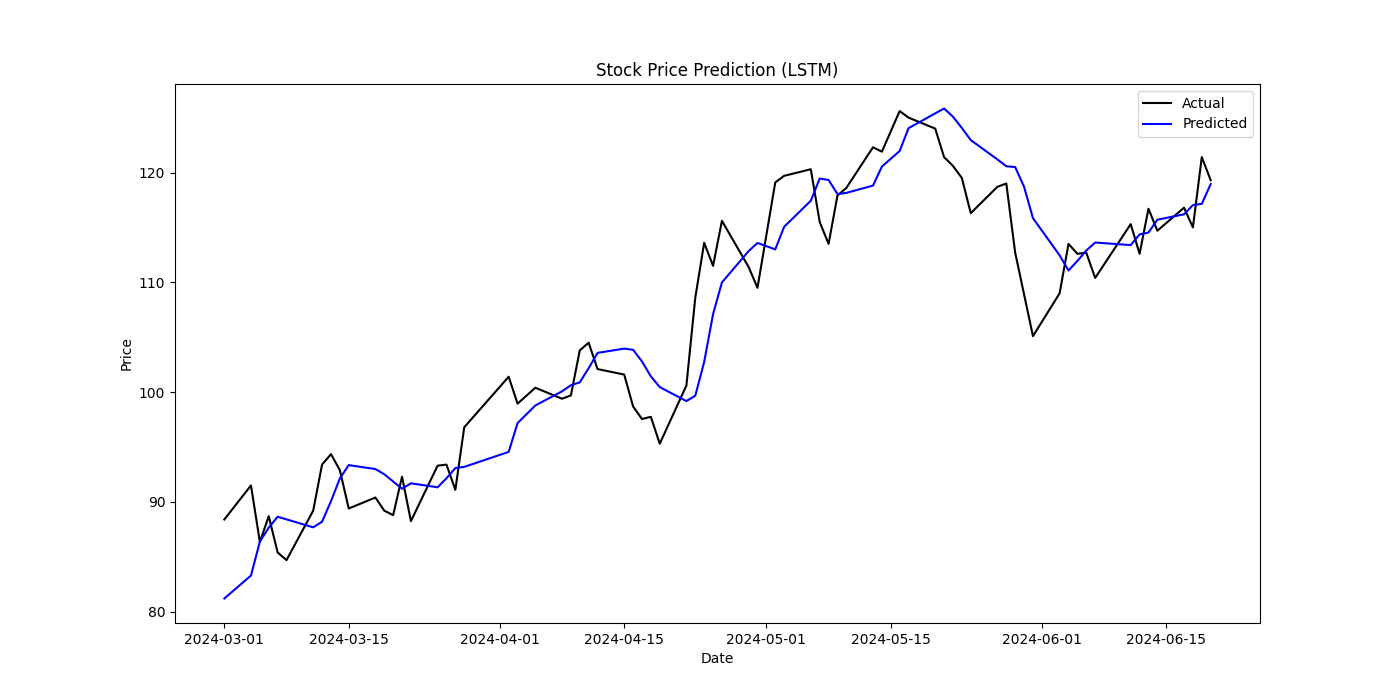
Figure 2: Stock Price Prediction(LSTM)
5.3.3. LightGBM Model
In constructing the LightGBM model, the objective was set to regression, the metric to Mean Squared Error (MSE), boosting type to Gradient Boosting Decision Tree (GBDT), learning rate to 0.01, and number of leaves to 31. The model was trained using `lgb.train` with early stopping to prevent overfitting.
The final fitting results were an MSE of 13.78, RMSE of 3.71, and MAE of 3.07, making LightGBM the best-performing model in this study. LightGBM's automatic feature selection and residual optimization effectively capture complex nonlinear relationships in the data. Its fast training and efficient memory usage give LightGBM significant advantages in stock price prediction.
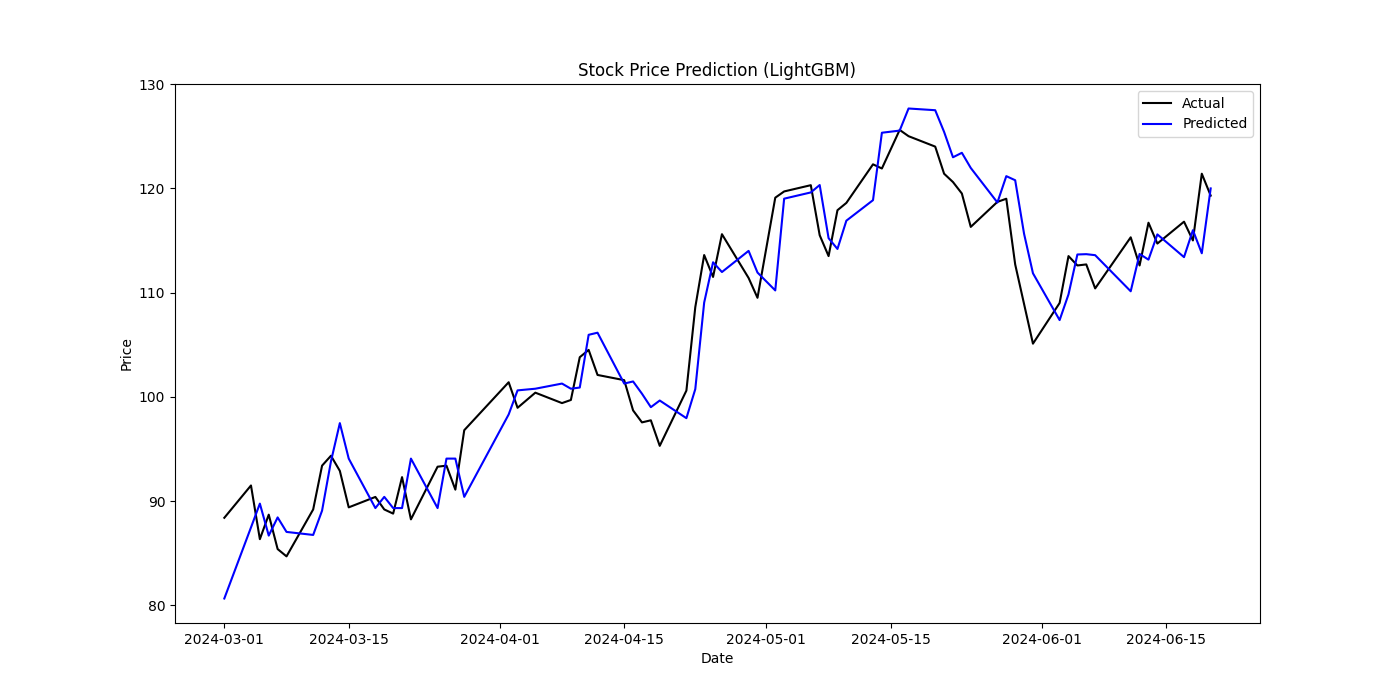
Figure 3: Stock Price Prediction(LightGBM)
5.3.4. LSTM + LightGBM Combined Model
The combined model was constructed in two parts. The first part involved training the LSTM model and extracting LSTM features. A two-layer LSTM with a dense layer was built, compiled with the Adam optimizer and mean squared error loss function, and trained with 50 epochs and a batch size of 32. The trained LSTM model's features for the training and test sets were then used as inputs for the LightGBM model. The second part involved training the LightGBM model using the extracted LSTM features and the original target values, with early stopping to prevent overfitting.
The combined model's MSE was 19.57, RMSE was 4.42, and MAE was 3.53, which did not surpass the standalone LightGBM model's performance. This may be due to the LSTM features not sufficiently capturing the key patterns in the time series data, or improper parameter tuning. The observed outcome indicates that the simplistic amalgamation of features is insufficient to enhance stock prediction accuracy. This finding underscores the necessity for more sophisticated feature engineering techniques and meticulous model tuning in order to achieve improved performance in stock prediction tasks.
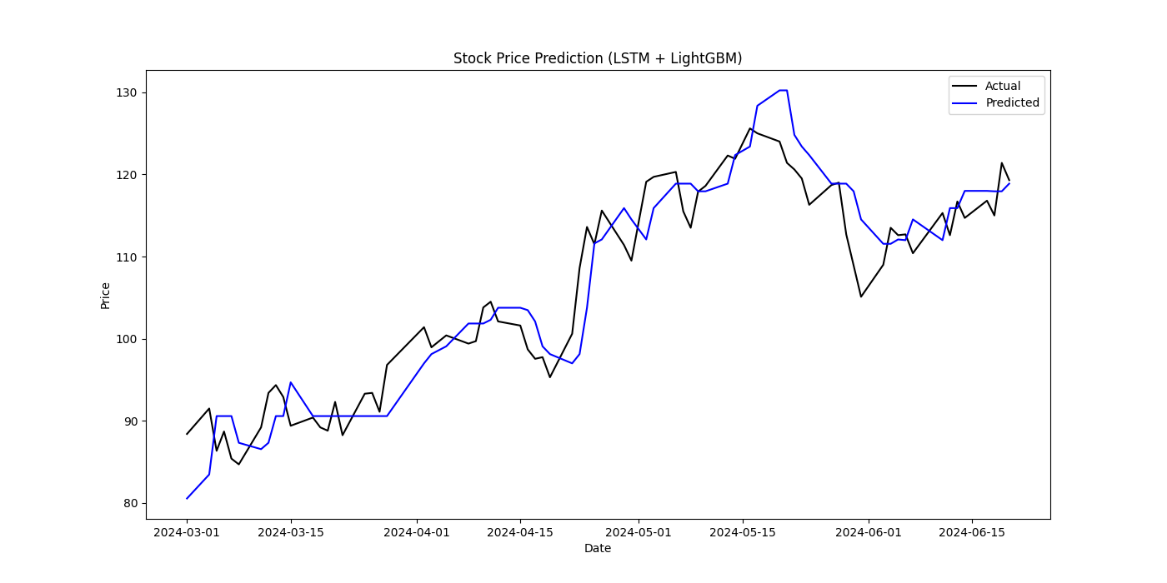
Figure 4: Stock Price Prediction(LSTM+LightGBM)
5.3.5. CNN Model
The CNN model was constructed using Conv1D and MaxPooling1D layers to extract features, Flatten layers to unfold the data, and Dense layers for regression prediction. The model was compiled with the Adam optimizer and mean squared error loss function, and trained with 50 epochs and a batch size of 32.
The CNN model's MSE was 25.36, RMSE was 5.04, and MAE was 3.87, making it the poorest performer. This indicates that while CNN performs well on data with local features like images and can reduce the risk of overfitting by lowering parameter count, it is not well-suited for data with strong temporal dependencies. The local nature of convolution operations limits its ability to capture global temporal dependencies, leading to ineffective stock price prediction.
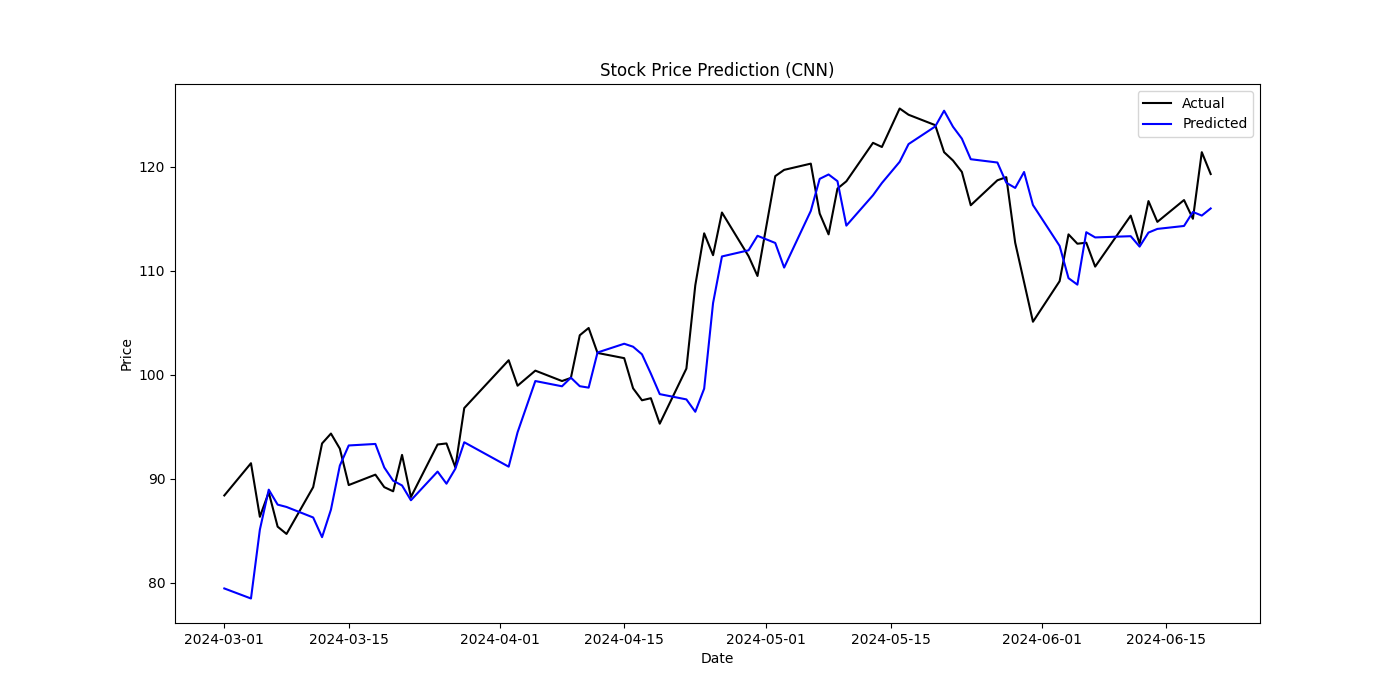
Figure 5: Stock Price Prediction(CNN)
6. Conclusion
Through experimental analysis, this paper draws the following conclusions:
(1)Feasibility of Machine Learning Methods for Stock Price Prediction
The models presented in this study show varying degrees of fit, but all demonstrate some effectiveness in stock price prediction, indicating significant potential and feasibility of machine learning methods in this field. The prediction results show that the LightGBM model performs best in terms of MSE, MAE, and RMSE, proving its significant advantages in handling large-scale, high-dimensional, and nonlinear data. Conversely, the CNN model performs the worst due to its unsuitability for data with strong temporal dependencies. Each model has its strengths and weaknesses, and model selection should consider data scale, feature dimensions, computational resources, and application scenarios.
(2)Limitation of Feature Extraction and Combined Models
Despite the theoretical advantages of the LSTM and LightGBM combined model, simply combining them did not achieve the expected results. This highlights the importance of feature extraction quality and model parameter tuning in combined models. Future research should address these areas and consider using cross-validation to improve model fit, especially given the short time span and limited trading day data in this study. More testing is needed to explore effective feature extraction, selection, and model configuration to enhance the combined model's predictive performance.
(3)Advantages of Combining Multiple Models
Machine learning methods can be applied to more practical financial scenarios, such as risk management, asset allocation, and quantitative investment. It is also necessary to continuously explore and validate more models and combined models, such as ensemble learning and stacking models, to fully leverage different models' strengths and improve prediction accuracy and stability. Through these improvements and explorations, the application of machine learning methods in stock price prediction and related financial market applications will become more widespread and in-depth, providing stronger support for financial market analysis and investment decisions.
References
[1]. Li Suping. Several forecasting methods and empirical research on securities prices [D]. Jiangsu University,2009.
[2]. Liu Yezheng,Wang Yi,Yang Pan. A security price prediction method integrating time series analysis and morphology theory[J]. Journal of Applied and Computational Mathematics,2006(01):10-18.
[3]. Li Xiaojie,Xia Chang. Research on stock price regression prediction based on machine learning algorithm[J]. Science and Technology Information,2023,21(14):227-231.DOI:10.16661/j.cnki.1672-3791.2211-5042-9348.
[4]. Cheng Yanqiu. Research on security price prediction method based on support vector machine[D]. Dalian University of Technology,2008.
[5]. Dou Wei. Stock price trend prediction based on LSTM[D]. Tianjin University, 2023.DOI:10.27356/d.cnki.gtjdu.2020.003177.
[6]. Niu Xiaonan. CSI 300 stock index futures price prediction based on LSTM-LightGBM combined model[D]. Zhongnan University of Economics and Law,2022.DOI:10.27660/d.cnki.gzczu.2022.002851.
Cite this article
Yu,Y. (2024). Research on the Feasibility of Machine Learning Methods in Stock Price Prediction. Advances in Economics, Management and Political Sciences,118,28-38.
Data availability
The datasets used and/or analyzed during the current study will be available from the authors upon reasonable request.
Disclaimer/Publisher's Note
The statements, opinions and data contained in all publications are solely those of the individual author(s) and contributor(s) and not of EWA Publishing and/or the editor(s). EWA Publishing and/or the editor(s) disclaim responsibility for any injury to people or property resulting from any ideas, methods, instructions or products referred to in the content.
About volume
Volume title: Proceedings of the 3rd International Conference on Financial Technology and Business Analysis
© 2024 by the author(s). Licensee EWA Publishing, Oxford, UK. This article is an open access article distributed under the terms and
conditions of the Creative Commons Attribution (CC BY) license. Authors who
publish this series agree to the following terms:
1. Authors retain copyright and grant the series right of first publication with the work simultaneously licensed under a Creative Commons
Attribution License that allows others to share the work with an acknowledgment of the work's authorship and initial publication in this
series.
2. Authors are able to enter into separate, additional contractual arrangements for the non-exclusive distribution of the series's published
version of the work (e.g., post it to an institutional repository or publish it in a book), with an acknowledgment of its initial
publication in this series.
3. Authors are permitted and encouraged to post their work online (e.g., in institutional repositories or on their website) prior to and
during the submission process, as it can lead to productive exchanges, as well as earlier and greater citation of published work (See
Open access policy for details).
References
[1]. Li Suping. Several forecasting methods and empirical research on securities prices [D]. Jiangsu University,2009.
[2]. Liu Yezheng,Wang Yi,Yang Pan. A security price prediction method integrating time series analysis and morphology theory[J]. Journal of Applied and Computational Mathematics,2006(01):10-18.
[3]. Li Xiaojie,Xia Chang. Research on stock price regression prediction based on machine learning algorithm[J]. Science and Technology Information,2023,21(14):227-231.DOI:10.16661/j.cnki.1672-3791.2211-5042-9348.
[4]. Cheng Yanqiu. Research on security price prediction method based on support vector machine[D]. Dalian University of Technology,2008.
[5]. Dou Wei. Stock price trend prediction based on LSTM[D]. Tianjin University, 2023.DOI:10.27356/d.cnki.gtjdu.2020.003177.
[6]. Niu Xiaonan. CSI 300 stock index futures price prediction based on LSTM-LightGBM combined model[D]. Zhongnan University of Economics and Law,2022.DOI:10.27660/d.cnki.gzczu.2022.002851.