


1. Introduction
1.1. Research Background and Significance
Primarily due to the impact of COVID-19, the world experienced a severe recession, leading to a significant decline in employment for a period. It has been reported that the 2020 recession was much deeper than the 2009 “great recession” [1]. As a common term in macroeconomics, unemployment rate has been continuously considered as an important index in doing economic analysis. This dissertation evaluates and analyzes the fluctuations in the unemployment rate in the United States, with a focus on individuals categorized by four levels of educational attainment. It's important to note that this thesis examines unemployment rates in the United States for 20 years in addition to the rates during the epidemic.
This paper will investigate the precise relationships that exist between unemployment rates and educational attainment. The author will also look into whether the unemployment rates of individuals with varying educational attainments differ significantly from one another. The concept is important because it directs government policy initiatives aimed at addressing unemployment. In addition, the value lies in helping individuals make judgments about which degree of education to pursue and how much of it to pursue.
1.2. Literature Review
Previous studies have used tools such as MATLAB and Python to predict economic indicators such as national unemployment rates. Based on the application of autoregressive integrated moving average (ARIMA) model in time series forecasting, the time series is decomposed into trends, seasonality, and noise [2]. Similarly, Zhong collected real GDP and unemployment rate data in the United States from 1948 to 2023, studied their relationship through linear and nonlinear regression, and predicted their future trends using ARIMA models [3]. In addition, Lu et al. used the MIDAS-LASSO model, which represents a penalty method designed for mixed frequency data to predict US GDP growth rates, while considering a large number of macroeconomic indicators, including Fisher et al.'s Macroeconomic Attention Index (MAI) [4].
These studies collectively provide in-depth analyses of economic indices within the U.S., primarily focusing on general economic trends. However, a notable gap in these works is the lack of attention to internal influence factors. To address this gap, this study focuses on four different educational attainment levels as internal factors influencing unemployment rates. The analysis aims to examine the relationship between unemployment rates and these educational factors. Additionally, a comparative analysis will be conducted to explore disparities in unemployment rates across the four educational groups.
1.3. Research Contents
The study aims to forecast how unemployment rates might evolve for people with different educational backgrounds. Additionally, it seeks to determine whether there are significant disparities in unemployment rates across these educational groups. A quantitative approach, including a regression model, will be employed to examine unemployment trends, while log differences will be used to compare rates across education levels, revealing new insights. The study focuses on individuals who are 25 years old or older.
1.4. Research Methods
1.4.1. Regression Model
Time series classification and regression models are important and challenging tasks [5]. To derive a formula that captures the patterns in unemployment rates over time, a time series regression model is used to analyze the relationships between unemployment rates and educational attainments. This approach offers accurate insights into the interactions between these variables, enhancing the precision of the analysis and uncovering key trends across different periods.
1.4.2. Logarithmic Difference
For machines, automated log analysis plays a crucial role in software maintenance as it allows for efficient identification and resolution of issues [6]. As for time series analysis, using logarithmic differences enables comparisons of unemployment rates across different educational attainments, allowing for the identification of significant patterns and trends. This method provides a more detailed analysis, potentially leading to new insights and discoveries regarding the variations in unemployment rates based on education levels.
2. Method
2.1. Regression Model
From Figure 1 it’s already known that the factors that influence the unemployment rate are date as well as four different educational attainments. As show in Figure 1, the author can easily find out the plots of these four series look similar. That is to say, these four series seem to follow similar or even identical patterns. The question is whether there is a global model that simultaneously satisfies these relations? Mathematically, these four series can all be quantitatively characterized by using regression model. By using panel data and dummy variables as well as R code, it’ll be feasible to derive a global model.
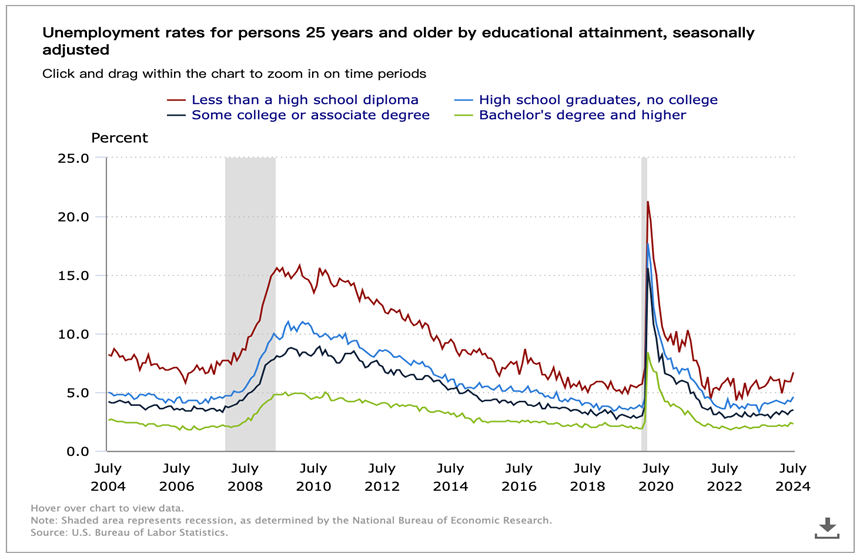
Figure 1: Unemployment rates for persons 25 years and older by educational attainment, seasonally adjusted.
Source: U.S. Bureau of Labor Statistics.
2.1.1. Panel Data Structure:
In this case, this article combines data from cross-sectional and time series elements. The cross-sectional element refers to the four different educational attainment groups, while the time series element refers to the unemployment rates observed over a certain period. Treating this data as panel data allows us to analyze the variations across groups and over time simultaneously.
2.1.2. Dummy Variables
Time Dummy Variables: A dummy variable is also known as an “indicator variable” [7]. Represent the different time periods in the data. In this dissertation, time dummy variables are created to account for changes over monthly time periods.
Educational Attainment Dummy Variables: Given the four groups based on educational attainment— "less than a high school diploma," "high school graduates, no college," "some college or associate degree," and "Bachelor's degree and higher"— dummy variables are introduced to represent each group. This approach enables the model to distinguish how unemployment rates differ across these varying levels of education.
Consider “Less than a high school diploma” as the intercept term. Hence, there are four dummy variables.
2.1.3. Setting Up the Regression Model
The regression model can be set up as follows:
\( {Unemployment_{Rate}}={β_{0}}+{β_{1}}Date+{β_{2}}{High_{School}}+{β_{3}}{Some_{College}}+{β_{4}}{Bachelor_{{and_{Higher}}}}+{ε_{t}} \) | (1) |
Where \( {β_{0}} \) is the intercept term, \( {β_{1}} \) is the coefficient for Date, \( {β_{2}} \) is the coefficient for High_School, \( {β_{3}} \) is the coefficient for Some_College, \( {β_{4}} \) is the coefficient for Bachelor_and_Higher. \( {ε_{t}} \) is a random error term.
2.2. Logarithmic Difference
In the earlier sections, the discussion focused on whether a global regression model could simultaneously capture the patterns of the four time series. Now, an intriguing analysis will be conducted to compare unemployment rates across different educational attainments. By treating one of the series, specifically "Bachelor’s degree and higher," as the baseline, and subtracting the logarithmic values of data from this baseline series, new insights can be uncovered. This method allows for a comparative analysis that reveals previously unnoticed differences and patterns in unemployment rates between various educational levels.
3. Results
3.1. Results of the Regression Model
This article uses R-studio to estimate parameters, and the estimation results are shown in Table 1.
Table 1: The estimation of Coefficients.
Estimate | Std. Error | t value | Pr ( > | t | ) | |
(Intercept) | 13.2290 | 0.5879 | 22.503 | < 2e-16 *** |
Date | -0.00027 | 0.000035 | -7.664 | 4.42e-14*** |
EducationHigh_School | -2.8195 | 0.2096 | -13.449 | < 2e-16 *** |
EducationSome_College | -3.8568 | 0.2096 | -18.398 | < 2e-16 *** |
EducationBachelor_and_Higher | -5.9025 | 0.2096 | -28.156 | < 2e-16 *** |
From the results, the author can know the coefficients and their values as well as the intercepts (assuming “less than high school diploma” as the intercept). Ultimately, the global model can be derived:
The equation of the model is:
\( {Unemployment_{Rate}}=13.2290\%-0.0002682\%∙Date-2.8195\%∙{High_{School}}-3.8568\%∙Some\_College-5.9025\%∙Bachelor\_and\_Higher \) | (2) |
This equation is the ultimate version of the global model.
3.2. Insights and Findings Regarding Logarithmic Differences
Figure 2 is quite intriguing, resembling a splash of ink on paper. However, drawing definitive conclusions from this graph is challenging, as it represents a composite of three separate logarithmic difference graphs. Therefore, the following operations are performed.
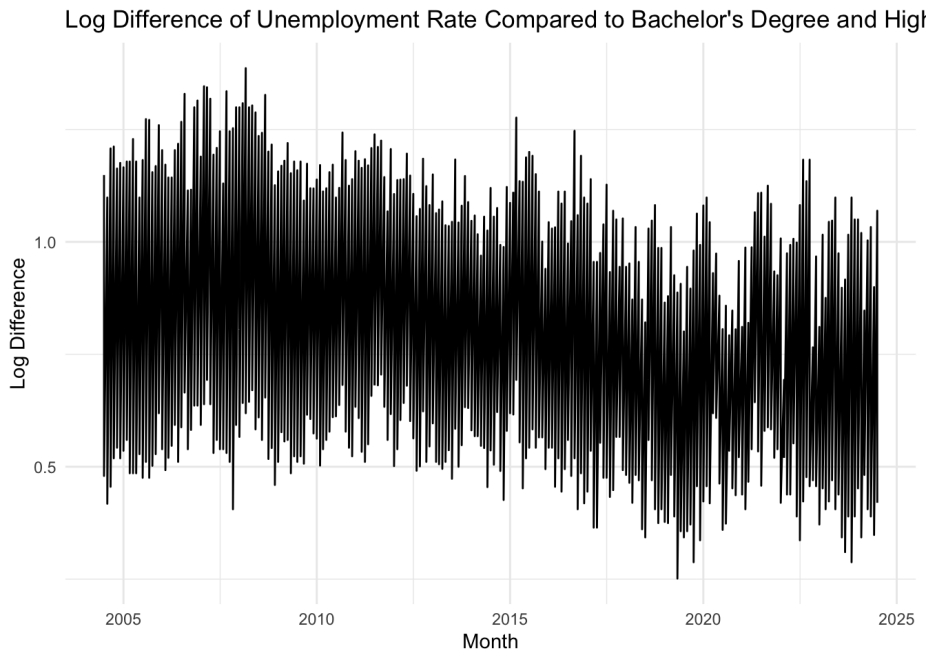
Figure 2: Log Difference of Unemployment Rate Compared to Bachleor’s.
At present, Figure 3 is available, showing the logarithmic difference between "less than a high school diploma" and the baseline category. This graph, according to the research, displays the most significant phenomena and characteristics. Consequently, the analysis will concentrate on the plot on the right.
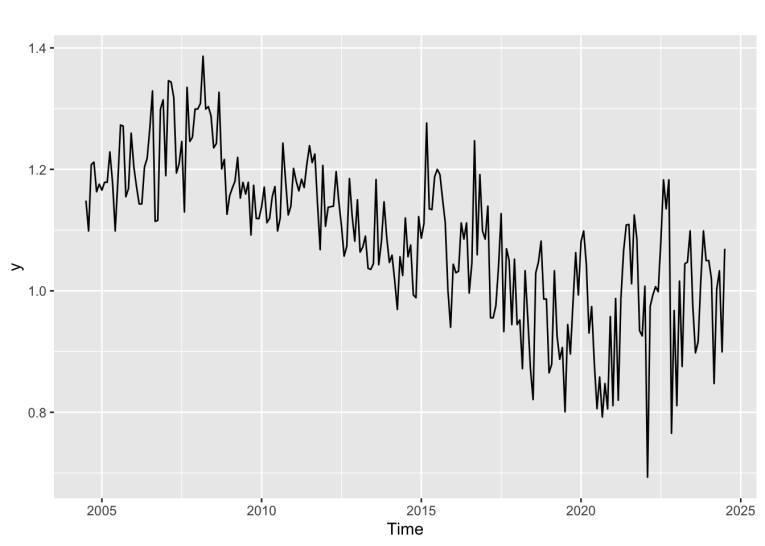
Figure 3: “Less than high school diploma” log difference.
To better analyze the characteristics, Seasonal and Trend decomposition using Loess (STL), which partitions the new time series plot into seasonal, trend, and residual elements, is in use as Figure 4 [8]. In addition, additive decomposition are utilized as Figure 5:
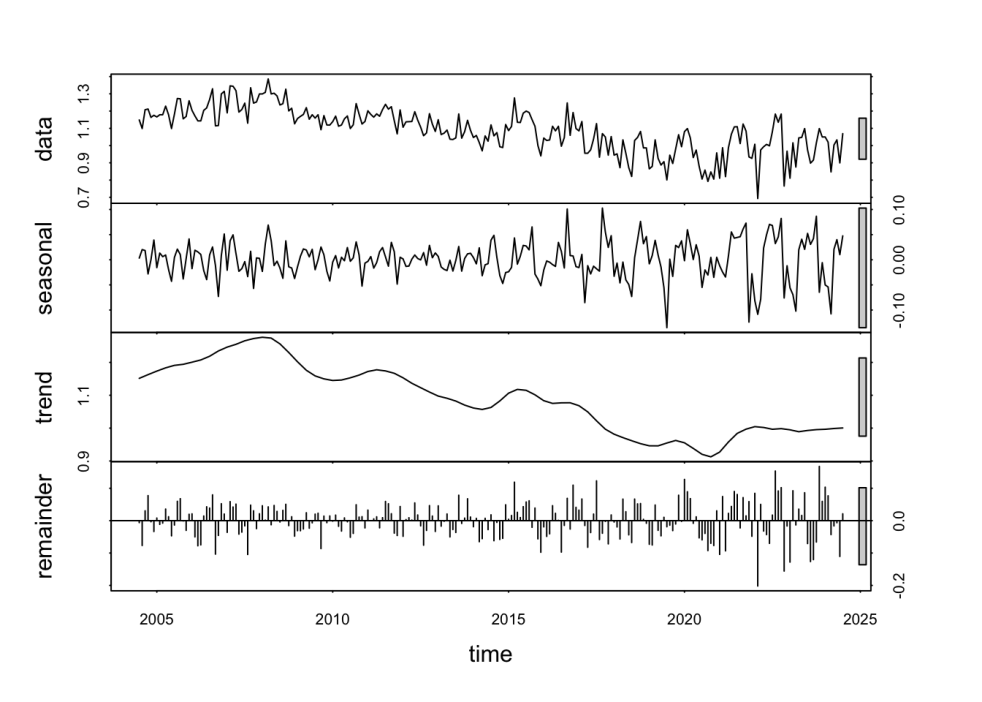
Figure 4: Decomposition of STL time series.
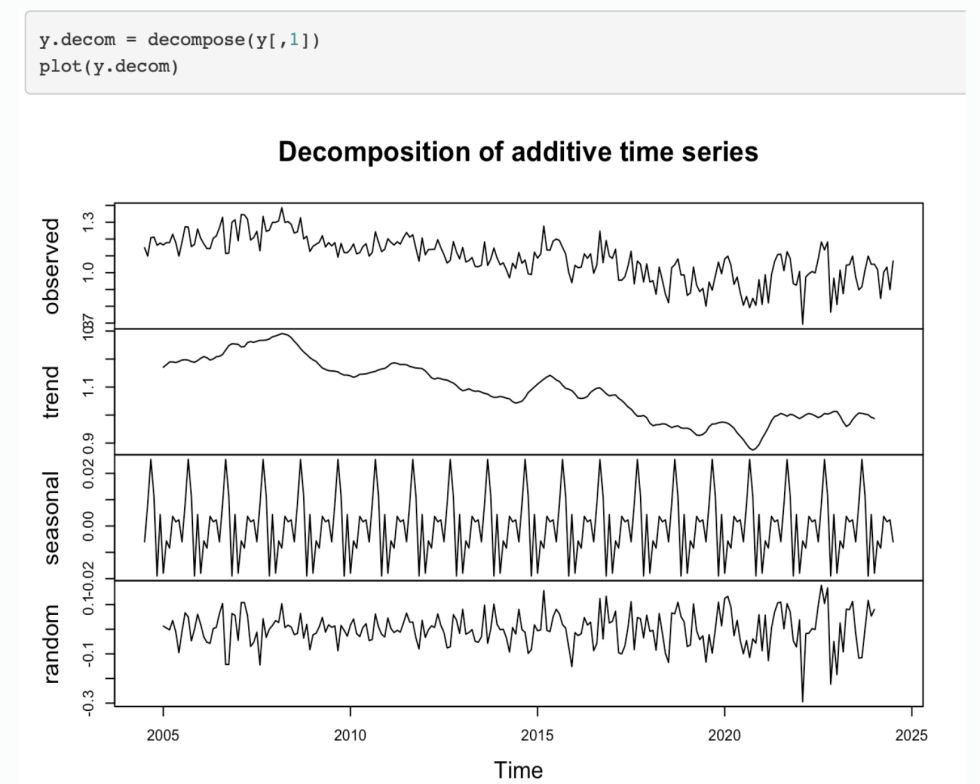
Figure 5: Decomposition of additive time series.
The STL decomposition indicates a clear downward trend, which is further validated by Figure 4 . This trend suggests that over time, the employment gap between the two educational levels has been progressively narrowing and is expected to converge. This finding is both significant and novel. Furthermore, a closer examination of the additive decomposition graph (Figure 5) reveals that the new series also exhibits notable seasonal patterns. This additional observation highlights the complexity of the data and provides deeper insights into the temporal dynamics and recurring fluctuations in unemployment rates.
4. Discussion
The analysis of U.S. unemployment rates across different educational attainments, supported by regression modeling and log difference calculations, provides significant insights into labor market dynamics, particularly during periods of economic turbulence.
4.1. Analysis of the Outlier and Historical Background
The spike in U.S. unemployment rates represents a notable outlier in the data. From February to April of 2020, the unemployment rate spiked from 3.5% to 14.8% [9]. Apparently, unemployment rates surged dramatically, reaching approximately 22-23% for those with less than a high school diploma, 16-17% for high school graduates with no college, 13-14% for those with some college or an associate degree, and 8-9% for individuals with a bachelor’s degree or higher. This unprecedented increase is closely tied to the COVID-19 pandemic, which caused widespread economic disruption.
During this period, the U.S. experienced a severe economic contraction, with GDP falling by 31.4% in Q2 2020, the sharpest quarterly drop on record. New York, New Jersey, Michigan, and California are the worst-hit states [10]. Major incidents such as nationwide lockdowns, business closures, and the implementation of the CARES Act contributed to this economic downturn, explaining the significant spike in unemployment rates across all educational attainment groups.
4.2. Insights from Regression Model and Logarithmic Difference Analysis
The regression model provides valuable insights into the patterns of U.S. unemployment rates across different educational levels. By examining the four educational attainment groups, the model identifies specific trends and behaviors for each group.
The logarithmic difference analysis further enhances this understanding by revealing how disparities in unemployment rates between educational levels have evolved over time. The analysis demonstrates a gradual reduction in these differences, indicating a narrowing of the employment gap. This suggests that the disparities in unemployment rates across different education levels are diminishing and may continue to converge in the future.
The combination of regression modeling and logarithmic difference analysis highlights key trends: Decreasing Disparities: The regression model confirms a trend where the unemployment rate gaps between educational levels are narrowing. The logarithmic difference analysis supports this by quantifying the decreasing disparities, providing a clearer picture of how the employment situation is improving across different education levels.
Predictive Insights: These analyses offer predictive insights into future unemployment trends. The narrowing gap implies that educational attainment's impact on unemployment rates is diminishing, which could influence policy decisions and workforce development strategies.
5. Conclusion
The regression model and log difference analysis offer a detailed view of U.S. unemployment trends, particularly in relation to educational attainment. The unemployment rate in the United States is negatively correlated with both date and educational attainment. Aside from this, there is a decreasing and maybe closing difference in the job circumstances of individuals with varying educational backgrounds. The significant spike in 2020, driven by the COVID-19 pandemic, stands out as a critical event with far-reaching implications. The subsequent recovery phases, supported by government interventions, reflect the resilience of the labor market. The regression model and logarithmic difference analysis reveal important trends, including the ongoing reduction in unemployment rate disparities between educational levels. These findings underscore the importance of continued analysis and targeted policies to address educational disparities and economic fluctuations in the U.S.
The dissertation has several limitations. Firstly, it’s not possible to determine the particular patterns that each time series plot fulfills because the regression model for each time series plot isn’t provided. In addition, the author generated three new time series plots in the logarithmic portion; nevertheless, only one of the three plots for the study is chosen because figure n exhibits the most noteworthy phenomenon. Because of this, the plot's conclusions could not be applicable to a large audience or be compelling. Actually, there was no discernible declining trend or seasonal trends in the other two plots. As a result, in future research, the author will make attempts to use dummy variables to determine the linear regression model for each unique time series and investigate alternative, more suitable techniques for performing the comparison analysis.
References
[1]. Dominick Salvatore. (2021). The U.S. and the world economy after Covid-19. Journal of Policy Modeling, 43(4): 728-738.
[2]. Andrew Kyung, Steve Nam. (2019). Study on Unemployment Rate in USA Using Computational and Statistical Methods. 2019 IEEE 10th Annual Ubiquitous Computing, Electronics & Mobile Communication Conference (UEMCON).
[3]. Shan Zhong. (2024). The Research and Forecasts on Real GDP Growth and the Unemployment Rate in the United States. EMFRM 2023, 24.
[4]. Fei Lu, Qing Zeng, Elie Bouri, Ying Tao. (2024). Forecasting US GDP growth rates in a rich environment of macroeconomic data. International Review of Economics & Finance, 95.
[5]. Navid Mohammadi Foumani, Lynn Miller, Chang Wei Tan, Geoffrey I. Webb, Germain Forestier, Mahsa Salehi. (2024). Deep Learning for Time Series Classification and Extrinsic Regression: A Current Survey. ACM Computing Surveys, 56 (9): 1-45.
[6]. Yilun Liu, Shimin Tao, Weibin Meng, Feiyu Yao, Xiaofeng Zhao, Hao Yang. (2024). LogPrompt: Prompt Engineering Towards Zero-Shot and Interpretable Log Analysis. ICSE-Companion '24: Proceedings of the 2024 IEEE/ACM 46th International Conference on Software Engineering: Companion Proceedings, 364-365.
[7]. Rob J Hyndman, George Athanasopoulos. (2018). Forecasting: Principles and Practice. OTexts.
[8]. Bohan Ma, Yushan Xue, Jing Chen, Fangfang Sun. (2024). Meta-Learning Enhanced Trade Forecasting: A Neural Framework Leveraging Efficient Multicommodity STL Decomposition. International Journal of Intelligent Systems.
[9]. Robert E. Hall, Marianna Kudlyak. (2021). Comparing Pandemic Unemployment to Past U.S. Recoveries. FRBSF Economic Letter 2021-33, Research from the Federal Reserve Bank of San Francisco.
[10]. Sahu, Kamal Kant; Kumar, Raman. (2020). Current perspective on pandemic of COVID-19 in the United States. Journal of Family Medicine and Primary Care, 9(4): 1784-1791.
Cite this article
Jiang,L. (2024). The Impact of Educational Attainment on U.S. Unemployment Rates: A Regression and Log Difference Analysis. Advances in Economics, Management and Political Sciences,124,38-45.
Data availability
The datasets used and/or analyzed during the current study will be available from the authors upon reasonable request.
Disclaimer/Publisher's Note
The statements, opinions and data contained in all publications are solely those of the individual author(s) and contributor(s) and not of EWA Publishing and/or the editor(s). EWA Publishing and/or the editor(s) disclaim responsibility for any injury to people or property resulting from any ideas, methods, instructions or products referred to in the content.
About volume
Volume title: Proceedings of the 8th International Conference on Economic Management and Green Development
© 2024 by the author(s). Licensee EWA Publishing, Oxford, UK. This article is an open access article distributed under the terms and
conditions of the Creative Commons Attribution (CC BY) license. Authors who
publish this series agree to the following terms:
1. Authors retain copyright and grant the series right of first publication with the work simultaneously licensed under a Creative Commons
Attribution License that allows others to share the work with an acknowledgment of the work's authorship and initial publication in this
series.
2. Authors are able to enter into separate, additional contractual arrangements for the non-exclusive distribution of the series's published
version of the work (e.g., post it to an institutional repository or publish it in a book), with an acknowledgment of its initial
publication in this series.
3. Authors are permitted and encouraged to post their work online (e.g., in institutional repositories or on their website) prior to and
during the submission process, as it can lead to productive exchanges, as well as earlier and greater citation of published work (See
Open access policy for details).
References
[1]. Dominick Salvatore. (2021). The U.S. and the world economy after Covid-19. Journal of Policy Modeling, 43(4): 728-738.
[2]. Andrew Kyung, Steve Nam. (2019). Study on Unemployment Rate in USA Using Computational and Statistical Methods. 2019 IEEE 10th Annual Ubiquitous Computing, Electronics & Mobile Communication Conference (UEMCON).
[3]. Shan Zhong. (2024). The Research and Forecasts on Real GDP Growth and the Unemployment Rate in the United States. EMFRM 2023, 24.
[4]. Fei Lu, Qing Zeng, Elie Bouri, Ying Tao. (2024). Forecasting US GDP growth rates in a rich environment of macroeconomic data. International Review of Economics & Finance, 95.
[5]. Navid Mohammadi Foumani, Lynn Miller, Chang Wei Tan, Geoffrey I. Webb, Germain Forestier, Mahsa Salehi. (2024). Deep Learning for Time Series Classification and Extrinsic Regression: A Current Survey. ACM Computing Surveys, 56 (9): 1-45.
[6]. Yilun Liu, Shimin Tao, Weibin Meng, Feiyu Yao, Xiaofeng Zhao, Hao Yang. (2024). LogPrompt: Prompt Engineering Towards Zero-Shot and Interpretable Log Analysis. ICSE-Companion '24: Proceedings of the 2024 IEEE/ACM 46th International Conference on Software Engineering: Companion Proceedings, 364-365.
[7]. Rob J Hyndman, George Athanasopoulos. (2018). Forecasting: Principles and Practice. OTexts.
[8]. Bohan Ma, Yushan Xue, Jing Chen, Fangfang Sun. (2024). Meta-Learning Enhanced Trade Forecasting: A Neural Framework Leveraging Efficient Multicommodity STL Decomposition. International Journal of Intelligent Systems.
[9]. Robert E. Hall, Marianna Kudlyak. (2021). Comparing Pandemic Unemployment to Past U.S. Recoveries. FRBSF Economic Letter 2021-33, Research from the Federal Reserve Bank of San Francisco.
[10]. Sahu, Kamal Kant; Kumar, Raman. (2020). Current perspective on pandemic of COVID-19 in the United States. Journal of Family Medicine and Primary Care, 9(4): 1784-1791.