


1. Introduction
Lei Jun declared on March 30, 2021, that he would personally oversee Xiaomi's advancement in the area of intelligent electric cars. Previously, Xiaomi was famous as the third cell phone business in the world, and also had a professional R&D team, and these prerequisites provided economic and technical support for Xiaomi to develop auto cars [1]. After two years of research and development, Xiaomi announced various details of the Xiaomi car SU7 on December 28, 2023, including appearance design, performance, safety, etc., and also disclosed the breakthroughs of the five core technologies of Xiaomi cars. At the same time, Lei Jun stated that Xiaomi will work to break into the top five global automakers after a long struggle [2]. Three months later, on March 38, 2024, The Xiaomi SU7's price was revealed by Lei Jun; Priced at 299,900 yuan for the Max version, 245,900 yuan for the Pro version, and 215,900 yuan for the standard version. Lei Jun set the price between 200,000 yuan and 300,000 yuan with careful consideration. The pricing strategy above 200,000 yuan aims to create an upscale brand image; While keeping the price below 300,000 yuan reflects Lei Jun's assessment that electric cars priced above this level have limited market potential. Consequently, positioning the price below 300,000 yuan is deemed more appropriate [3]. Lei Jun's pricing strategy is smart, such reasonable pricing positions the Xiaomi SU7 as offering good value for money, thereby enhancing consumers' willingness to spend [4]. However, in August 2024, Xiaomi Group released its second-quarter results, revealing that its automotive business incurred a loss of 1.8 billion yuan. Lei Jun responded by stating that Xiaomi's car division is still in the investment phase and expressed confidence that the business will expand and achieve profitability in the future [5].
As investors consider the profitability of Xiaomi Auto, they will also assess whether it is worth investing. One of the simplest ways to understand Xiaomi Auto’s development is by analyzing its stock price. With Xiaomi’s entry into the automobile industry, predicting its stock price has become a key focus for investors. This paper aims to forecast Xiaomi Auto’s stock price using time series analysis in R. It focuses on building GARCH and ARIMA models. The goal is to understand the stock’s future performance. Based on the analysis, the paper also provides recommendations to investors. This study provides both theoretical and practical contributions to financial market analysis, specifically in the context of the emerging electric vehicle market. Using GARCH and ARGIMA models to analyze Xiaomi Auto's short-term pricing trends and volatility provides insightful information, enabling investors to make better decisions. Additionally, this research bridges the gap between time-series forecasting models and real-world financial behavior in the rapidly growing electric vehicle sector, thus contributing to better risk management and investment strategies.
2. Method
2.1. ARIMA Model
The Auto-Regressive Integrated Moving Average (ARIMA) model is a widely used statistical method for time series forecasting. In order to predict future values using current data, this model incorporates three components: moving average (MA), integrated (I), and auto-regressive (AR) [6]. The linear relationship between the values at present and its previous values is represented by the Auto-Regressive (AR) component. By differencing, the Integrated (I) component eliminates trends and seasonal influences from non-stationary time series, turning them into stationary ones. Through the simulation of the correlation between the current value and past errors, the Moving Average (MA) captures the structure of random errors.
2.1.1. ARIMA Model Construction
The construction of an ARIMA (p, d, q) model involves two main steps: (1) Differentiating is the first stage. It is important to remember that prediction is only possible for stationary series. Differentiating is not required if the time series under analysis is already stationary. However, if the time series is non-stationary, it must be differencing in order to become a stationary series. After one differencing, if the series becomes stationary, then d = 1. If two differencing rounds are needed for the system to become stationary, then d = 2. Plots of the autocorrelation function (ACF) and partial autocorrelation function (PACF) can be used by researchers to assess if a time series is stationary. A series that is stationary will show ACF values that decay rapidly after a few lags. (2) Identification of the model is the second step. To develop the ARIMA model, the numerical values of p and q in the ARIMA (p, d, q) model need to be determined. This study uses the R language's auto.arima code to automatically select the most accurate model parameters.
2.1.2. Review of ARIMA Model Applications in Financial Market Analysis
The ARIMA model has been used in many researches to examine the financial and economic domains. Adebiyi, Adewumi, and Ayo developed an ARIMA model to forecast Zenith Bank's and Nokia's stock prices [7]. Setyo Tri Wahyudi investigated the use of the ARIMA model for Indonesia's Composite Stock Price Index prediction. This research suggests that the model performs well in capturing short-term stock price movements [8].
Furthermore, Jarrett and Kyper used intervention analysis and the ARIMA model to study how the global financial crisis in 2008 affected the Chinese stock market [9]. In addition, Wahyudi developed an ARIMA model to examine and forecast event-driven changes in Austrian stock prices. The ARIMA model is very useful for financial market analysis because of its sensitive parameter choices, which allowed for accurate short-term prediction [10]. To assess and predict the level of financial asset volatility, a GARCH model is necessary to be built after the ARIMA model.
2.2. GARCH Model
A statistical method for modeling the volatility in financial time series data is the Generalized Autoregressive Conditional Heteroskedasticity (GARCH) model. Time dependence of volatility is the central hypothesis of the GARCH model. Research has shown that in financial markets where volatility clustering is evident, GARCH models can offer accurate volatility forecasts, aiding investors in understanding market dynamics [6].
The GARCH model has been used in many researches to examine volatility of the stock market. Using a GARCH model, Endri, Abidin, Simanjuntak, and Nurhayati evaluated the effects of global stock exchanges and macroeconomic factors on the IHSG in order to forecast and examine the Indonesian stock market's volatility [11]. To study the volatility of the Indonesian stock market, Chou built a GARCH model [12]. Aloui and Ben Aïssa employed a vine copula technique to build a GARCH model in order to analyze the relationship among oil, stock, and exchange rates [13]. In a different study, Ruslan and Mokhtar created GARCH models to examine how shipping stock prices fluctuate in response to changes in oil prices [14]. Herwartz also created a GARCH model to evaluate the independence of GARCH innovations and evaluate the predictability of stock returns empirically [15]. This study forecasts the stock price of Xiaomi Auto by using ARIMA and GARCH models using R.
2.3. Data Selection and Processing
This paper selects historical stock price data of Xiaomi Auto. The data covers daily closing prices from December 15, 2023, to August 28, 2024. Since financial data is typically non-stationary, this paper first tested for stationarity and then used differencing to make the data stationary if the data is not stationary.
R is used in this study to plot the time series graph (see Figure 1), the ACF plot (see Figure 2) and the PACF plot (see Figure 3).
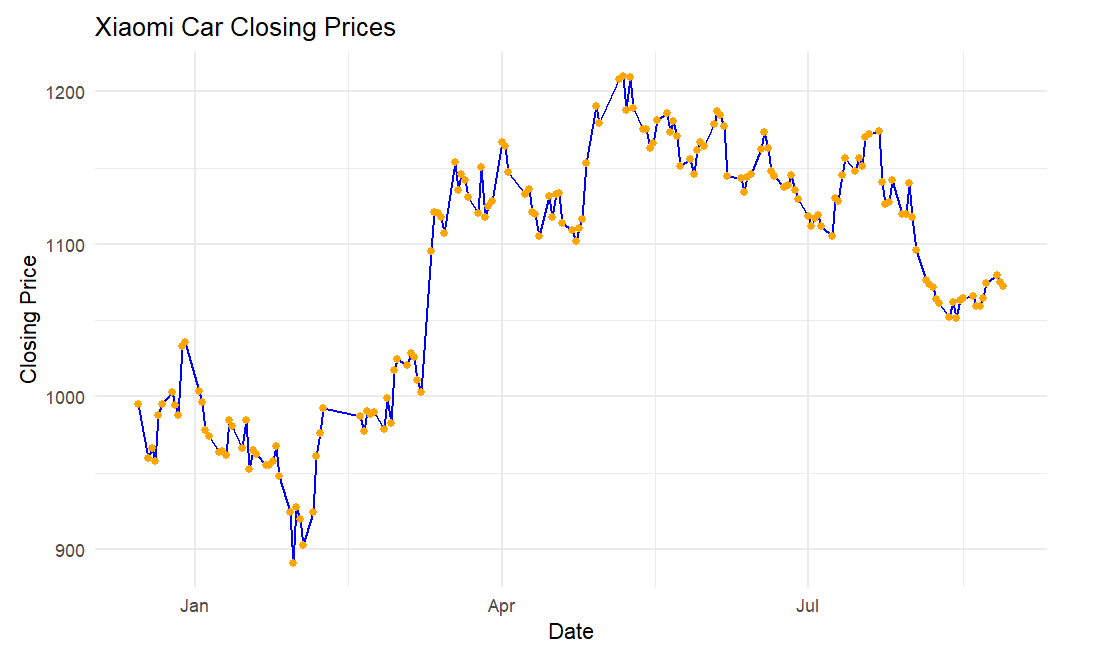
Figure 1: Time series graph of xiaomi car closing prices.
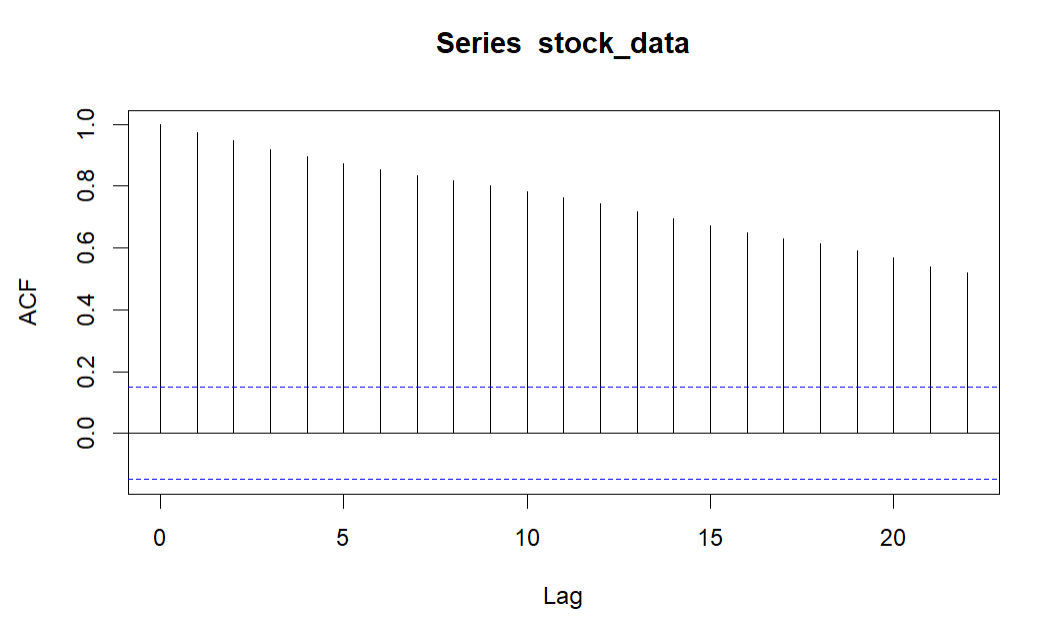
Figure 2: ACF plot.
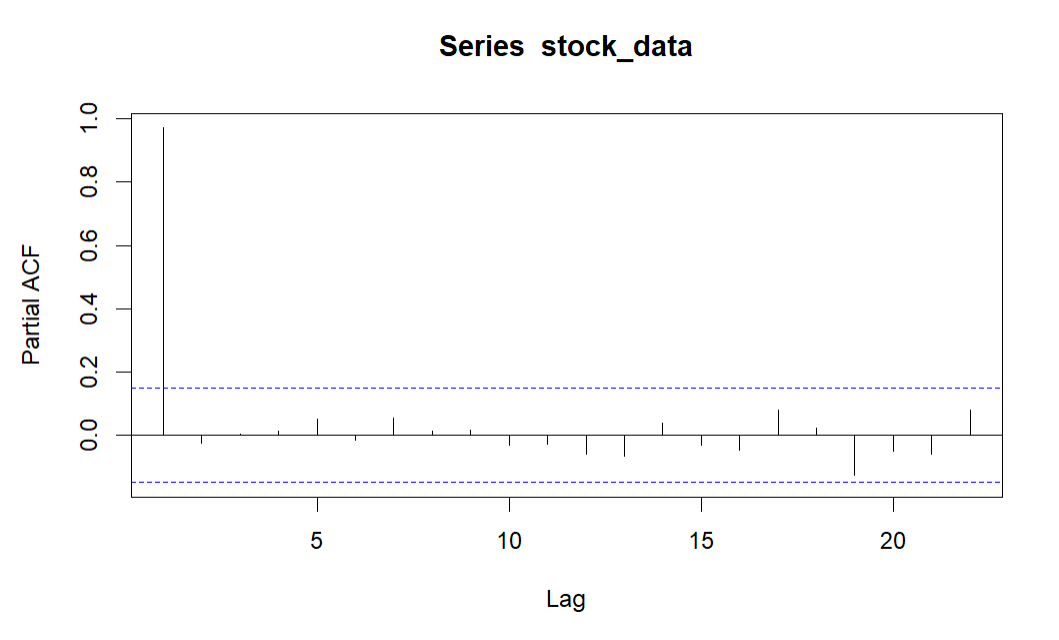
Figure 3: PACF plot.
By analyzing the time series plot, ACF plot, and PACF plot, this study observes that the original stock price data exhibited significant trends and volatility, indicating that the data might be non-stationary. To ensure stationarity, this study applies first-order differencing using R, resulting in Figure 4. Furthermore, R is used to visualize the ACF (see Figure 5) and PACF (see Figure 6) of the differenced time series.
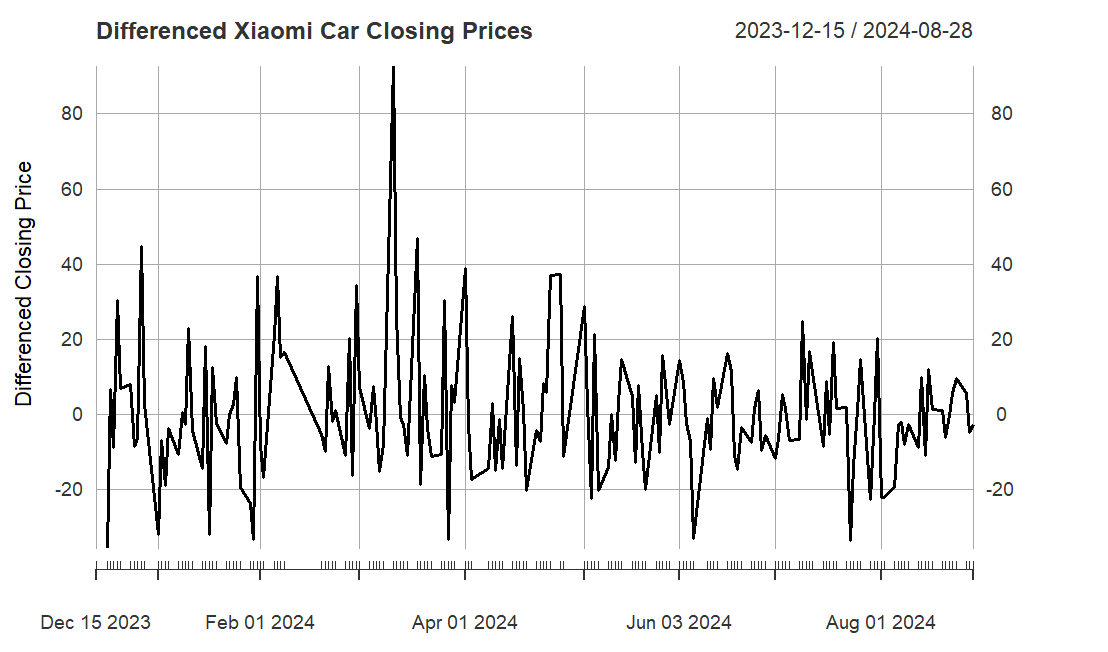
Figure 4: Time series graph of differenced xiaomi car closing prices.
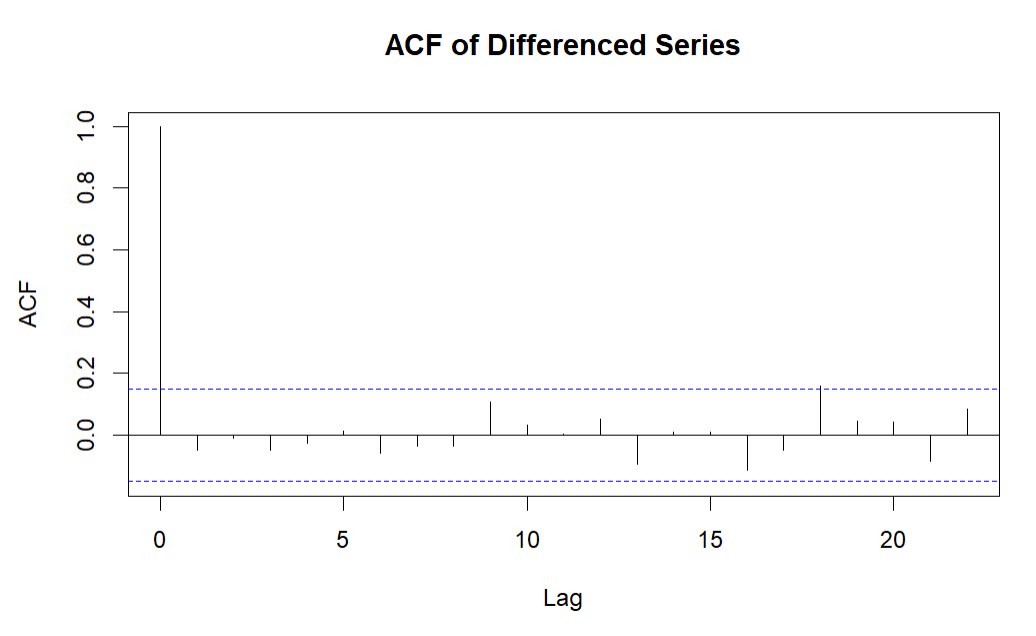
Figure 5: Differenced series ACF plot.
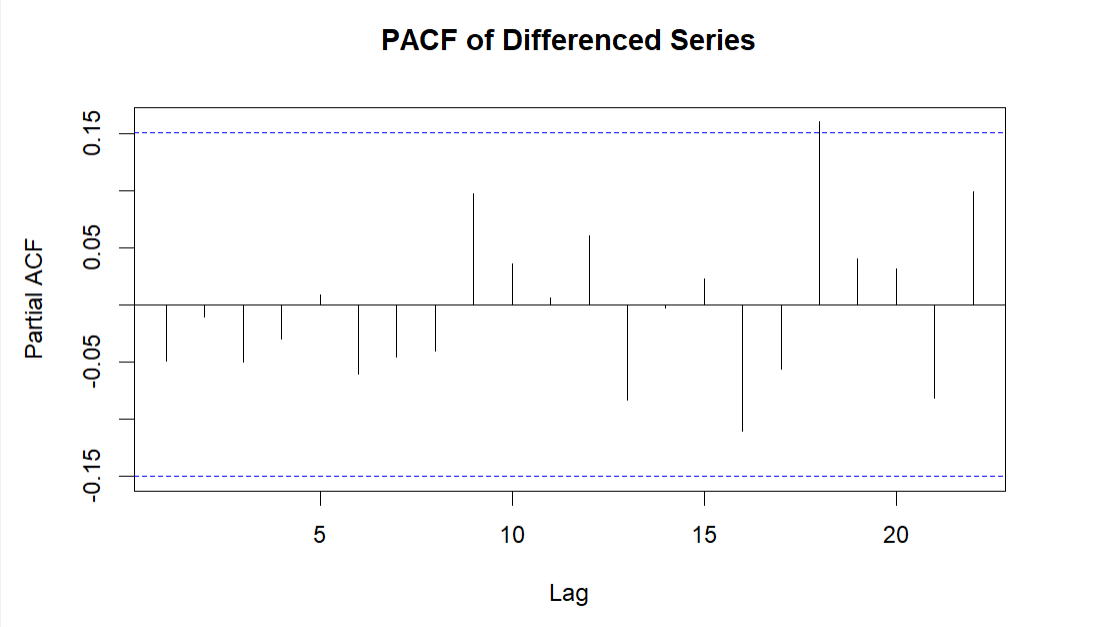
Figure 6: Differenced series PACF plot.
The differenced time series graphic shows that there has been a mean reversion to zero as well as relatively uniform volatility. Additionally, according to the ACF and PACF plots, the autocorrelation has been effectively removed, confirming that the data has reached a stationary state.
3. Empirical Results
3.1. The Construction of ARIMA Model
This work uses the R auto.arima code to automatically select the model parameters. To model the stationary data and forecast the stock price trend for the upcoming 30 days, the Arima (0,1,0) model is selected. Figure 7 presents the findings.
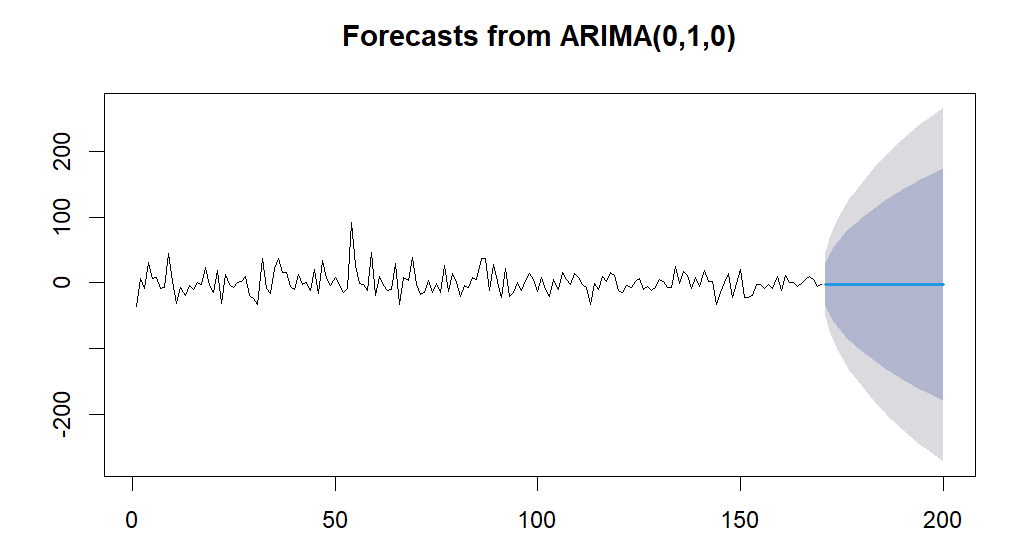
Figure 7: Forecasts the next 30 days of stock price from ARIMA (0,1,0).
The ARIMA (0,1,0) model's prediction results show that while the predicted stock price stays constant, the prediction interval widens significantly over time, implying that the long-term forecasts of the model are quite unclear.
3.2. The Construction of GARCH Model
In order to better capture the stock price volatility, a GARCH (1,1) model is constructed in this article. This method effectively captures time series data with volatility clustering, improving future volatility prediction. The findings of this paper's prediction of the stock price volatility over the next 30 days are displayed in Figure 8.
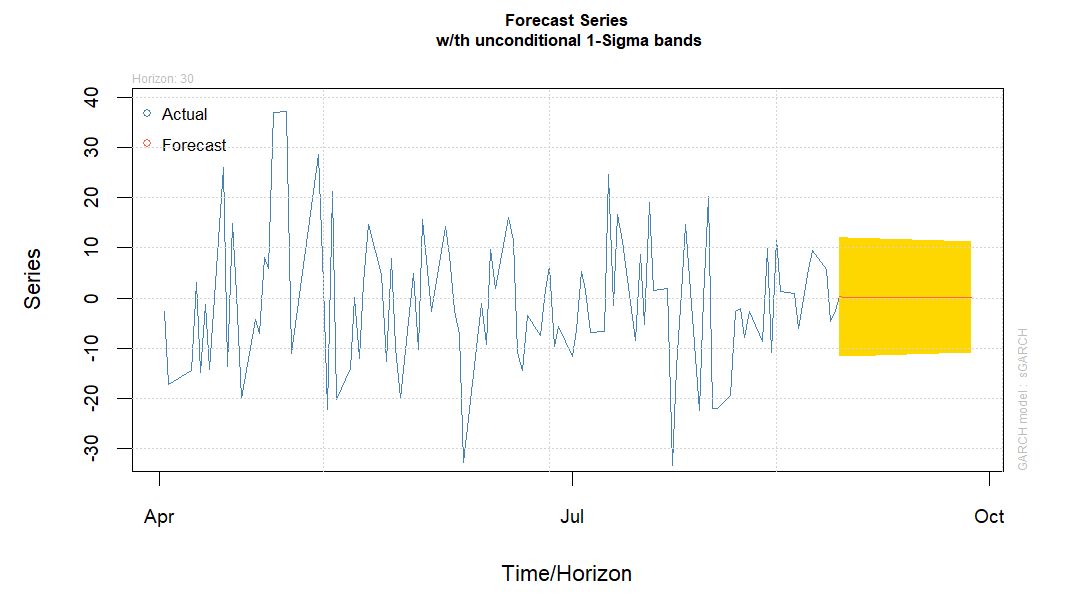
Figure 8: Forecasts the stock prices volatility for the next 30 days from GARCH (1,1).
The short-term volatility of stock prices is predicted by the GARCH model to be relatively constant, but as time goes on, the prediction interval increasingly widens, indicating an increase in volatility in the future.
4. Recommendations
4.1. Short-Term Strategy
The GARCH model predicts increased volatility over the next 30 days, which suggests that there could be notable price fluctuations in the market. For short-term investors, this volatility presents both opportunities and risks. Investors can limit potential losses by implementing flexible strategies, such as strictly defining take-profit and stop-loss thresholds, to effectively control this. Given the wide prediction intervals provided by the model, it is advisable to avoid high-leverage trades during this period, as they could lead to larger losses in a volatile market environment.
4.2. Medium- to Long-Term Strategy
The ARIMA model indicates that Xiaomi Auto’s stock price is likely to remain stable in the short term, with no clear trend emerging. Medium- to long-term investors should consider holding their positions, as sudden market shifts are less likely. Additionally, they could use a strategy of buying on dips, particularly when volatility increases. This strategy is especially useful for those who have a positive outlook on Xiaomi Auto's long-term prospects, as it allows them to accumulate shares at lower costs and reduce overall risk.
4.3. Overall Strategy
Combining ARIMA and GARCH predictions, investors should adopt a defensive approach, stay flexible in response to volatility, and consider gradual buying during price dips. Continuous monitoring of market dynamics and macroeconomic factors is crucial for timely strategy adjustments.
5. Conclusion
The ARIMA and GARCH models used in this study to forecast Xiaomi Auto's stock price during the next 30 days are created by R. According to the ARIMA (0,1,0) model, the stock price will remain relatively stable in the short term, but the prediction intervals widen as the forecast period extends, indicating a rise in uncertainty. Rising volatility is further predicted by the GARCH (1,1) model, suggesting that the market may experience greater price fluctuations in the near future. Based on these findings, this paper recommends a defensive investment strategy. Investors should be flexible to handle short-term volatility and consider gradual buying during market pullbacks to reduce overall risk exposure. This approach helps investors manage the risks from increased market volatility. It also allows them to take advantage of buying opportunities when prices are lower.
However, It is crucial to recognize the limits of the models this study. Both ARIMA and GARCH models are effective in short-term predictions, but they struggle to capture longer-term market trends and structural shifts in the stock price. To increase the precision of long-term forecasts, future studies could benefit from adding other models, such as machine learning algorithms or hybrid models, to improve the accuracy of long-term forecasts. Enhancing current models by integrating more macroeconomic factors, refining parameter selection, or including external shocks may also lead to more precise predictions. In conclusion, the ARIMA and GARCH models offer insightful predictions about the trend of Xiaomi Auto's stock price. Their use in forecasting stock price volatility demonstrates significant potential for practical applications in financial markets and investment decision-making.
References
[1]. Lei Jun. (2021). Making cars is the last time in my life, Xiaomi can afford the loss. Finance (05), 9.
[2]. Xiang Yantao. (2023). Xiaomi Motors unveils the “Full Ecosystem of People, Cars and Homes” and officially completes the closed loop. Securities Daily, B02.
[3]. Zheng Jie. (2024). Is Xiaomi “overvalued”? Automotive Observation (02), 6-10.
[4]. Liu Chunxin. (2024). Customer-centric marketing strategy of Internet platform: Taking Xiaomi Automobile as an example. Northern Economic and Trade (08), 136-138.
[5]. Huang Bowen. (2024). Xiaomi's automotive business lost 1.8 billion yuan. Lei Jun responded: It is still in the investment period. Daily Economic News, 004.
[6]. Bagalkot, S. S., & Naik, N. (2024). Novel grey wolf optimizer based parameters selection for GARCH and ARIMA models for stock price prediction. PeerJ Computer Science, 10, e1735.
[7]. Ariyo, A. A., Adewumi, A. O., & Ayo, C. K. (2014). Stock price prediction using the ARIMA model. In 2014 UKSim-AMSS 16th international conference on computer modelling and simulation, 106-112. IEEE.
[8]. WAHYUDI, S. T. (2017). The ARIMA Model for the Indonesia Stock Price. International Journal of Economics & Management, 11.
[9]. Jarrett, J. E., & Kyper, E. (2011). ARIMA modeling with intervention to forecast and analyze Chinese stock prices. International Journal of Engineering Business Management, 3, 17.
[10]. Mestel, R., & Gurgul, H. (2003). ARIMA Modeling of Event Induced Stock Price Reactions in Austria. Central European Journal of Operations Research, 11(4).
[11]. Endri, E., Abidin, Z., Simanjuntak, T. P., & Nurhayati, I. (2020). Indonesian stock market volatility: GARCH model. Montenegrin Journal of Economics, 16(2), 7-17.
[12]. Chou, R. Y. (1988). Volatility persistence and stock valuations: Some empirical evidence using GARCH. Journal of applied econometrics, 279-294.
[13]. Aloui, R., & Aïssa, M. S. B. (2016). Relationship between oil, stock prices and exchange rates: A vine copula based GARCH method. The North American Journal of Economics and Finance, 37, 458-471.
[14]. Ruslan, S. M. M., & Mokhtar, K. (2021). Stock market volatility on shipping stock prices: GARCH models approach. The Journal of Economic Asymmetries, 24, e00232.
[15]. Herwartz, H. (2017). Stock return prediction under GARCH—An empirical assessment. International Journal of Forecasting, 33(3), 569-580.
Cite this article
Cao,Y. (2024). Stock Price Forecasting for Xiaomi Auto: Application of ARIMA and GARCH Models. Advances in Economics, Management and Political Sciences,124,56-63.
Data availability
The datasets used and/or analyzed during the current study will be available from the authors upon reasonable request.
Disclaimer/Publisher's Note
The statements, opinions and data contained in all publications are solely those of the individual author(s) and contributor(s) and not of EWA Publishing and/or the editor(s). EWA Publishing and/or the editor(s) disclaim responsibility for any injury to people or property resulting from any ideas, methods, instructions or products referred to in the content.
About volume
Volume title: Proceedings of the 8th International Conference on Economic Management and Green Development
© 2024 by the author(s). Licensee EWA Publishing, Oxford, UK. This article is an open access article distributed under the terms and
conditions of the Creative Commons Attribution (CC BY) license. Authors who
publish this series agree to the following terms:
1. Authors retain copyright and grant the series right of first publication with the work simultaneously licensed under a Creative Commons
Attribution License that allows others to share the work with an acknowledgment of the work's authorship and initial publication in this
series.
2. Authors are able to enter into separate, additional contractual arrangements for the non-exclusive distribution of the series's published
version of the work (e.g., post it to an institutional repository or publish it in a book), with an acknowledgment of its initial
publication in this series.
3. Authors are permitted and encouraged to post their work online (e.g., in institutional repositories or on their website) prior to and
during the submission process, as it can lead to productive exchanges, as well as earlier and greater citation of published work (See
Open access policy for details).
References
[1]. Lei Jun. (2021). Making cars is the last time in my life, Xiaomi can afford the loss. Finance (05), 9.
[2]. Xiang Yantao. (2023). Xiaomi Motors unveils the “Full Ecosystem of People, Cars and Homes” and officially completes the closed loop. Securities Daily, B02.
[3]. Zheng Jie. (2024). Is Xiaomi “overvalued”? Automotive Observation (02), 6-10.
[4]. Liu Chunxin. (2024). Customer-centric marketing strategy of Internet platform: Taking Xiaomi Automobile as an example. Northern Economic and Trade (08), 136-138.
[5]. Huang Bowen. (2024). Xiaomi's automotive business lost 1.8 billion yuan. Lei Jun responded: It is still in the investment period. Daily Economic News, 004.
[6]. Bagalkot, S. S., & Naik, N. (2024). Novel grey wolf optimizer based parameters selection for GARCH and ARIMA models for stock price prediction. PeerJ Computer Science, 10, e1735.
[7]. Ariyo, A. A., Adewumi, A. O., & Ayo, C. K. (2014). Stock price prediction using the ARIMA model. In 2014 UKSim-AMSS 16th international conference on computer modelling and simulation, 106-112. IEEE.
[8]. WAHYUDI, S. T. (2017). The ARIMA Model for the Indonesia Stock Price. International Journal of Economics & Management, 11.
[9]. Jarrett, J. E., & Kyper, E. (2011). ARIMA modeling with intervention to forecast and analyze Chinese stock prices. International Journal of Engineering Business Management, 3, 17.
[10]. Mestel, R., & Gurgul, H. (2003). ARIMA Modeling of Event Induced Stock Price Reactions in Austria. Central European Journal of Operations Research, 11(4).
[11]. Endri, E., Abidin, Z., Simanjuntak, T. P., & Nurhayati, I. (2020). Indonesian stock market volatility: GARCH model. Montenegrin Journal of Economics, 16(2), 7-17.
[12]. Chou, R. Y. (1988). Volatility persistence and stock valuations: Some empirical evidence using GARCH. Journal of applied econometrics, 279-294.
[13]. Aloui, R., & Aïssa, M. S. B. (2016). Relationship between oil, stock prices and exchange rates: A vine copula based GARCH method. The North American Journal of Economics and Finance, 37, 458-471.
[14]. Ruslan, S. M. M., & Mokhtar, K. (2021). Stock market volatility on shipping stock prices: GARCH models approach. The Journal of Economic Asymmetries, 24, e00232.
[15]. Herwartz, H. (2017). Stock return prediction under GARCH—An empirical assessment. International Journal of Forecasting, 33(3), 569-580.