


1. Introduction
Brexit is undeniably a major event with international repercussions, particularly affecting the UK's local economy in profound ways. This study is dedicated to analyzing the short-term and long-term impacts of Brexit on the UK's local economy. In terms of methodology, the Generalized Autoregressive Conditional Heteroskedasticity (GARCH) model and its variants have been widely utilized in previous Brexit research [1-3], with some studies also incorporating the Vector Autoregression (VAR) model for enhanced analysis [3]. The event study method is another prevalent approach [4-7], often focusing on stock market abnormal returns as the dependent variable [4]. Additionally, paired t-tests and regression analyses have also been used [8-9]. Furthermore, although not within the context of Brexit articles, some studies on stock analysis have also utilized the Difference in Differences (DID) model. Regarding variable selection, Stoupos and Kiohos [2] selected the UK government bond yield, while Ngwakwe [8] chose the EUR/GBP exchange rate.
This research will select two stocks, one significantly impacted by Brexit and another less so, and apply the DID model to assess the impact of the Brexit referendum on the returns of the stock more significantly affected, along with the GARCH model and its variants to analyze the volatility of time series data. Additionally, the VAR model and Impulse Response Function (IRF) will be used to visualize how shocks to stock market abnormal returns impact the ten-year UK government bond yield and the GBP/USD exchange rate. The selected variables include the ten-year UK government bond yield, the GBP/USD exchange rate, and the closing prices of the two stocks.
The significance of this study lies in its innovative incorporation of the DID model into Brexit research, using multiple variants of the GARCH model to validate the analytical methods. Through the IRF, it meticulously demonstrates how shocks to stock market abnormal returns affect the government bond yield and GBP exchange rate, addressing gaps in prior research regarding variable changes.
2. Methodology & Analysis
2.1. Data
To analyze Brexit, the primary research points are the Brexit referendum on June 23, 2016, and the formal Brexit date of January 31, 2020. Due to the overlap of the official Brexit and the COVID-19 pandemic, many studies have preferred to use data from around the time of the referendum. This study adheres to the same approach.
The study period was initially defined, spanning from April 13, 2016, to August 30, 2016. Subsequently, data on the GBP/USD exchange rate is downloaded from Yahoo Finance, and datasets for the UK ten-year government bond yield, the FTSE100 index, and the FTSE250 index are obtained from Investing.com. According to Ngwakwe [8], who used the FTSE100 index and suggested exploring other FTSE indices, this research focuses on this broader context. The FTSE100 index, comprising large multinational corporations, is less sensitive to local economic shocks with its global exposure, while the FTSE250 index, with more UK-based companies, reflects domestic economic impacts and is more susceptible to Brexit effects. The disparity between these indices provides a measure of abnormal stock market returns, offering insight into the differential impact of Brexit. From these datasets, the date, prices of the FTSE100 and FTSE250 indices, and closing values of the government bond yield and the GBP/USD exchange rate are retained to form a new consolidated dataset. Given that the stock market is not open every day, there are 71 days before the Brexit referendum and 68 days after, ensuring a relatively balanced comparison across both periods.
2.2. DID & GARCH with its variants
The section starts with the application of the Difference-in-Differences (DID) model. This econometric tool assesses the Brexit referendum’s impact on financial markets by analyzing the closing prices of the FTSE250 (treatment group) relative to the FTSE100 (control group). By comparing price fluctuations before and after the referendum and evaluating the differential trends between these indices, the model systematically isolates and clarifies the referendum’s effects on market dynamics.
The econometric model used in this analysis is specified as follows:
\( FTSE250Retur{n_{it}}={β_{0}}+{β_{1}}*Treatmen{t_{i}}+{β_{2}}*Pos{t_{t}}+{β_{3}}*(Treatemen{t_{i}}*Pos{t_{t}})+{ε_{it}}\ \ \ (1) \)
Where:
• \( FTSE250Retur{n_{it}} \) represents the return calculated using the closing prices of FTSE250 index for each observation i at time t.
• \( Treatmen{t_{i}} \) is a dummy variable for the treatment group, assigned a value of 1 if the FTSE250 price is higher than the FTSE100 price, otherwise 0.
• \( Pos{t_{t}} \) is a post-referendum dummy variable, assigned a value of 1 if the date is after June 23, 2016, otherwise 0.
• \( Treatemen{t_{i}}*Pos{t_{t}} \) is an interaction term used to capture the effect of the treatment group in the post-referendum period.
The result is as follows:
Table 1: DID model results-Differential Impact of Brexit on FTSE250 Prices
Durbin-Watson: | 1.449 | AIC: | -533.2 |
BIC: | -528.1 |
From Table 1, it can be found that the AIC and BIC values are -533.2 and -528.1, respectively. Therefore, the model with the lower value should be selected, favoring the AIC criterion.
However, the Durbin-Watson statistic of 1.449, being close to 1.5, indicates a mild positive autocorrelation. This suggests that the current value of the series tends to be positively correlated with its previous value, implying that consecutive values tend to be similar. The results of this model also reveal that the Brexit referendum does not have a significant impact on the returns of the FTSE250, indicating low explanatory power and suggesting the need for a model revision.
Consequently, the analysis employs a time series model focusing on the volatility of the data. A GARCH (1,1) model can be utilized, and the conditional volatility fitted by the model is plotted.
Table 2: GARCH (1,1) Model Results-Volatility Model
Coef | Std err | t | P>|t| | |
omega | 0.1036 | 0.108 | 0.964 | 0.335 |
alpha [1] | 0.4963 | 0.254 | 1.954 | 5.069e-02 |
beta [1] | 0.5037 | 0.292 | 1.725 | 8.450e-02 |
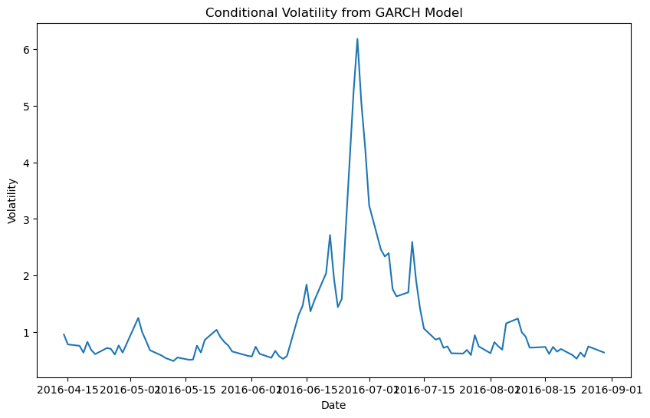
Figure 1: GARCH (1,1) volatility time series
Table 2 shows that both alpha[1], indicating the impact of new information on volatility, and beta[1], representing volatility persistence, are statistically significant. This suggests that past volatility significantly influences current volatility. Additionally, the volatility time series chart shows a significant increase in the FTSE250’s volatility on July 1, 2016(a notable peak in the figure), reflecting heightened market uncertainty or risk due to major events like Brexit.
Subsequently, attempts are made to modify the GARCH model in two directions to enhance its analytical capabilities. In the first direction, the lag order is increased by employing the GARCH (2,2) normal distribution and GARCH (2,2) t-distribution for analysis. In the second direction, influenced by Arshad et al.[1], who used the EGARCH model and suggested exploring TGARCH and PGARCH, GARCH variants including PGARCH, TGARCH, and EGARCH, are explored based on the GARCH (1,1) model.
Table 3: EGARCH model results
Coef | Std err | t | P>|t| | |
mu | 0.0867 | 5.236e-04 | 165.564 | 0.000 |
omega | -0.0113 | 0.154 | -7.353e-02 | 0.941 |
alpha [1] | 1.4224 | 0.333 | 4.275 | 1.911e-05 |
beta [1] | 0.5771 | 7.169e-02 | 8.049 | 8.319e-16 |
Among these models, the EGARCH variant exhibit the best performance. The EGARCH model is particularly noteworthy as it allows for differing impacts of positive and negative shocks on volatility. It demonstrates a t-value of 165.564, indicating a very high level of statistical significance with a P-value less than 0.0001, reflecting an extremely significant level. Furthermore, the P-values for alpha and beta are close to significant, indicating that new information has a considerable immediate impact on volatility, and that volatility possesses a high degree of persistence.
2.3. VAR & IRF
Clearly, Brexit significantly impacts stock market volatility, with financial markets reacting to the event and transmitting this response through volatility to other economic variables. Consequently, VAR model and impulse response functions (IRF) are used to analyze how stock market volatility impacts the ten-year UK government bond yield and the GBP/USD exchange rate over time, exploring both its short-term and long-term effects.
The econometric model used in this analysis is specified as follows:
\( {Y_{t}}={c_{1}}+\sum _{i=1}^{p}{α_{1i}}{Y_{t-i}}+\sum _{i=1}^{p}{β_{1i}}{E_{t-i}}+\sum _{i=1}^{p}{γ_{1i}}{AR_{t-i}}+{ε_{1t}}\ \ \ (2) \)
\( {E_{t}}={c_{2}}+\sum _{i=1}^{p}{α_{2i}}{Y_{t-i}}+\sum _{i=1}^{p}{β_{2i}}{E_{t-i}}+\sum _{i=1}^{p}{γ_{2i}}{AR_{t-i}}+{ε_{2t}}\ \ \ (3) \)
\( {AR_{t}}={c_{3}}+\sum _{i=1}^{p}{α_{3i}}{Y_{t-i}}+\sum _{i=1}^{p}{β_{3i}}{E_{t-i}}+\sum _{i=1}^{p}{γ_{3i}}{AR_{t-i}}+{ε_{3t}}\ \ \ (4) \)
Where:
• \( {Y_{t}} \) : Stands for the ten-year UK government bond yield at time t.
• \( {E_{t}} \) : Represents the GBP/USD exchange rate at time t.
• \( {AR_{t}} \) : According to Bashir et al. [4], who used the market model to calculate abnormal returns; \( {AR_{t}} \) of this model is calculated as the difference between the daily percentage returns of the FTSE 250 and the FTSE 100: \( A{R_{t}}=R{250_{t}}-R10{0_{t}} \)
• i : lag term. In this case, i is set to 5 days.
And the results are as follows:
VAR model results with a logarithmic transformation to all variables:
Table 4: Results for equation TenYearBondYield
Coef | Std err | t-stat | prob | |
L1.AR_t | 0.012994 | 0.008756 | 1.484 | 0.138 |
L2.AR_t | -0.016950 | 0.009393 | -1.805 | 0.071 |
L3.AR_t | 0.006447 | 0.009498 | 0.679 | 0.497 |
L4.AR_t | 0.007306 | 0.009690 | 0.754 | 0.451 |
L5.AR_t | 0.000500 | 0.008856 | 0.056 | 0.955 |
Table 5: Results for equation GBP/USDExchangeRate
Coef | Std err | t-stat | prob | |
L1.AR_t | 0.005402 | 0.001213 | 4.454 | 0.000 |
L2.AR_t | -0.000983 | 0.001301 | -0.755 | 0.450 |
L3.AR_t | 0.002169 | 0.001316 | 1.649 | 0.099 |
L4.AR_t | 0.001713 | 0.001342 | 1.276 | 0.202 |
L5.AR_t | 0.002369 | 0.001227 | 1.931 | 0.053 |
Initially, a 5-day lag period and the AIC criterion are chosen for model selection, but found that most coefficients are not statistically significant (high P-values). Therefore, variable transformation via logarithmic transformation is used to improve the VAR model's statistical significance and explanatory power. In the ten-year bond yield equation, AR_t’s effect improves, especially at the first lag (L1AR_t), approaching significance; a positive coefficient at L1AR_t indicates that higher AR_t tends to increase the bond yield. For the GBP/USD exchange rate, AR_t lags, particularly at the first and third lags (L1.AR_t and L3.AR_t), show better significance, indicating that past changes in AR_t significantly affect the current GBP/USD exchange rate, with the positive coefficient of L1.AR_t suggesting that an increase in AR_t tends to raise the GBP/USD exchange rate.(As shown by table 4 and table 5)
Then, IRF is utilized to illustrate the short-term and long-term impacts of shocks from stock market abnormal returns. Despite wide confidence intervals for some variables indicating significant volatility and uncertainty, most response curves remain within these bounds, showing the model’s effectiveness in capturing dynamic relationships. Additionally, most variables response begin to diminish soon after a shock, suggesting the system’s gradual return to equilibrium and confirming the model's stability and precision. The relevant charts for a 30-period pulse response analysis on the ten-year bond yield and the GBP/USD exchange rate are selected from this analysis.
IRF results
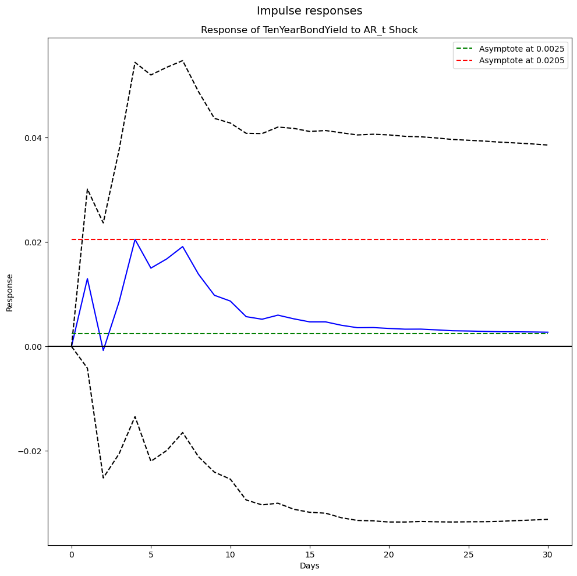
Figure 2: the impact of AR_t on the ten-year bond yield
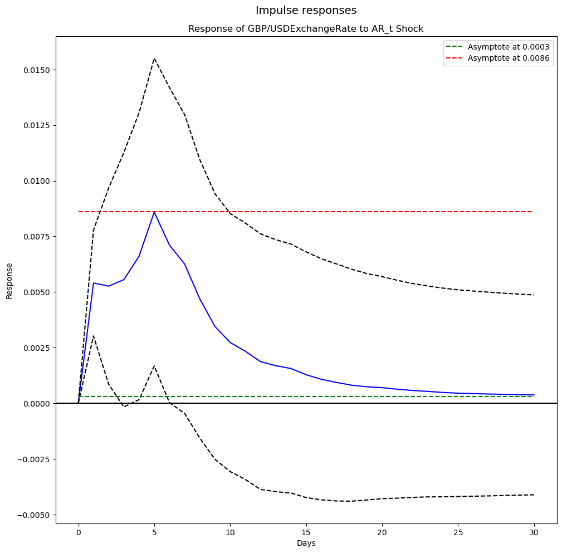
Figure 3: the impact of AR_t on the GBP/USD exchange rate
In these two charts, short-term effects are represented by the distance between the red and green lines, while long-term effects are indicated by the distance from the 0.00 axis to the green line. Observations reveal that the ten-year bond yield reacts quite dramatically to shocks in stock market abnormal returns, with significant fluctuations; the peak reaches 0.0205, the trough at 0.0025, short-term effect measures 0.018, and long-term effect at 0.0025. In contrast, the GBP/USD exchange rate response to the same stock market abnormal returns starts with a rise followed by a decline, exhibiting smaller fluctuations; the peak is at 0.0086, the trough at 0.0003, short-term effect measures 0.0083, and long-term effect at 0.0003.
3. Conclusion
From the analysis using DID, GARCH, and its variants, the GARCH (1,1) model confirms that Brexit has significantly impacted British businesses and the economy, with the EGARCH model providing the best fit. This indicates that Brexit, as new information incorporated into the model, has indeed caused immediate and relatively persistent effects on stock market volatility. Using the IRF, it shows that Brexit's impact on the UK's local economy is primarily short-term, with existing but milder long-term effects.
Regarding the limitations of this study, further improvements can be made when using the GARCH and VAR models. For instance, the GARCH model could incorporate macroeconomic variables or market sentiment indicators to more comprehensively capture market volatility; while the VAR model might incorporate indicators such as inflation rates to more accurately capture economic dynamics. Additionally, future studies on Brexit should focus on its more recent effects and explore its ongoing impact on the UK's local economy.
References
[1]. Arshad, S., Rizvi, S. A. R., & Haroon, O. (2020). Impact of Brexit vote on the London stock exchange: A sectorial analysis of its volatility and efficiency. Finance Research Letters, 34, 101240.
[2]. Stoupos, N., & Kiohos, A. (2021). BREXIT referendum’s impact on the financial markets in the UK. Review of World Economics, 157(1), 1-19.
[3]. Nagarakatte, S. G., & Natchimuthu, N. (2022). Return and volatility spillover between India, UK, USA and European stock markets: The Brexit impact. Investment Management and Financial Innovations, 19(1), 121-134.
[4]. Bashir, U., Zebende, G. F., Yu, Y., Hussain, M., Ali, A., & Abbas, G. (2019). Differential market reactions to pre and post Brexit referendum. Physica A: Statistical Mechanics and its Applications, 515, 151-158.
[5]. Kurecic, P., & Kokotovic, F. (2018). Empirical analysis of the impact of Brexit referendum and post-referendum events on selected stock exchange indexes. South East European Journal of Economics and Business, 13(1), 7-16.
[6]. Škrinjarić, T. (2019). Stock market reactions to Brexit: Case of selected CEE and SEE stock markets. International journal of financial studies, 7(1), 7.
[7]. Shahzad, K., Rubbaniy, G., Lensvelt, M. A. P. E., & Bhatti, T. (2019). UK's stock market reaction to Brexit process: A tale of two halves. Economic Modelling, 80, 275-283.
[8]. Ngwakwe, C. C. (2020). Analysis of the Differential Effect of Brexit on the FTSE Stock and Money Market Performance. Acta Universitatis Danubius. Œconomica, 16(1), 128-138.
[9]. Kim, J. C., Mazumder, S., & Su, Q. (2024). Brexit's ripple: Probing the impact on stock market liquidity. Finance Research Letters, 61, 105030.
Cite this article
Zhu,H. (2024). The Short-Term and Long-Term Economic Impacts of the Brexit Referendum: A DID and VAR Analysis Using Financial Market Variables to Examine the UK Local Economy. Advances in Economics, Management and Political Sciences,129,11-17.
Data availability
The datasets used and/or analyzed during the current study will be available from the authors upon reasonable request.
Disclaimer/Publisher's Note
The statements, opinions and data contained in all publications are solely those of the individual author(s) and contributor(s) and not of EWA Publishing and/or the editor(s). EWA Publishing and/or the editor(s) disclaim responsibility for any injury to people or property resulting from any ideas, methods, instructions or products referred to in the content.
About volume
Volume title: Proceedings of the 8th International Conference on Economic Management and Green Development
© 2024 by the author(s). Licensee EWA Publishing, Oxford, UK. This article is an open access article distributed under the terms and
conditions of the Creative Commons Attribution (CC BY) license. Authors who
publish this series agree to the following terms:
1. Authors retain copyright and grant the series right of first publication with the work simultaneously licensed under a Creative Commons
Attribution License that allows others to share the work with an acknowledgment of the work's authorship and initial publication in this
series.
2. Authors are able to enter into separate, additional contractual arrangements for the non-exclusive distribution of the series's published
version of the work (e.g., post it to an institutional repository or publish it in a book), with an acknowledgment of its initial
publication in this series.
3. Authors are permitted and encouraged to post their work online (e.g., in institutional repositories or on their website) prior to and
during the submission process, as it can lead to productive exchanges, as well as earlier and greater citation of published work (See
Open access policy for details).
References
[1]. Arshad, S., Rizvi, S. A. R., & Haroon, O. (2020). Impact of Brexit vote on the London stock exchange: A sectorial analysis of its volatility and efficiency. Finance Research Letters, 34, 101240.
[2]. Stoupos, N., & Kiohos, A. (2021). BREXIT referendum’s impact on the financial markets in the UK. Review of World Economics, 157(1), 1-19.
[3]. Nagarakatte, S. G., & Natchimuthu, N. (2022). Return and volatility spillover between India, UK, USA and European stock markets: The Brexit impact. Investment Management and Financial Innovations, 19(1), 121-134.
[4]. Bashir, U., Zebende, G. F., Yu, Y., Hussain, M., Ali, A., & Abbas, G. (2019). Differential market reactions to pre and post Brexit referendum. Physica A: Statistical Mechanics and its Applications, 515, 151-158.
[5]. Kurecic, P., & Kokotovic, F. (2018). Empirical analysis of the impact of Brexit referendum and post-referendum events on selected stock exchange indexes. South East European Journal of Economics and Business, 13(1), 7-16.
[6]. Škrinjarić, T. (2019). Stock market reactions to Brexit: Case of selected CEE and SEE stock markets. International journal of financial studies, 7(1), 7.
[7]. Shahzad, K., Rubbaniy, G., Lensvelt, M. A. P. E., & Bhatti, T. (2019). UK's stock market reaction to Brexit process: A tale of two halves. Economic Modelling, 80, 275-283.
[8]. Ngwakwe, C. C. (2020). Analysis of the Differential Effect of Brexit on the FTSE Stock and Money Market Performance. Acta Universitatis Danubius. Œconomica, 16(1), 128-138.
[9]. Kim, J. C., Mazumder, S., & Su, Q. (2024). Brexit's ripple: Probing the impact on stock market liquidity. Finance Research Letters, 61, 105030.