


1. Introduction
Along with the change of time, technology is developing rapidly. The transition from traditional brick-and-mortar shopping to e-commerce is an important part of this development. The first-ever e-commerce transaction trade was made on August 11st, 1994, when the band Sting sold a CD to his friend through an American online platform called NetMarket [1]. Since then, the popularity of e-commerce has steadily grown, and it now plays a significant part in the global economy. As the demand for e-commerce increases, accurate sales forecasting becomes increasingly important. Enhancing sales forecasting accuracy enables companies to optimize inventory management and recource allocation, adjust production planning, develop marketing strategies, manage supply chains, and have better risk management. Traditional statistical models and modern machine learning models are employed using different approaches to achieve higher sales forecasting accuracy. Linear regression, Autoregressive (AR), Autoregressive Integrated Moving Average (ARIMA), and Seasonal ARIMA (SARIMA) are well-considered choices among traditional statistical models [2]. Models like ARIMA are widely used in time series forecasting because of their simplicity and interpretability as they can make precise predictions based on historical patterns and trends. Nowadays, machine learning techniques such as Support Vector Machine (SVR), Artificial Neural Network (ANN), Decision Trees, k-Nearest Neighbors (k-NN), Long Short-Term Memory (LSTM) and eXtreme Gradient Boosting (XGBoost) have gained popularity in sales forecasting related researches [3].
This study aims to compare the performance of traditional statistical models and modern machine learning models in e-commerce sales forecasting using different datasets, evaluating their strengths and weaknesses. The goal is to find a better approach for solving e-commerce sales forecasting problems and provide targeted advice based on datasets with different attributes. This paper consists of five parts.: introduction, literature review, methodology, results and discussion, and conclusion. In the introduction, the background and purpose of this study are introduced. The literature review part summarizes past and current studies of traditional statistical and machine learning approaches. For methodology, the experiment process of this study and theoretical backgrounds of models used are explained. The results part displays the performance metrics and compares the fit ability of each model. Finally, the conclusion chapter is a summing-up of this study with possible improvement approaches of future study.
2. Literature Review
2.1. Traditional Statistical Models Used for Sales Forecasting
Since sales data is usually highly sensitive to time, models like ARIMA have been a popular choice. Arunkumar has used different time series models like naïve (persistence), Moving Average (MA), ARIMA, and Seasonal ARIMA with eXogenous factors (SARIMAX) and compared their performance based on a real-world retail dataset [4]. ARIMA and SARIMAX appear to provide the highest accuracy while predicting. Between them, SARIMAX has better performance than ARIMA. However, SARIMAX is also the most computationally expensive choice among all the models. By comparison, ARIMA has a better balance between forecasting accuracy and the cost of computing. Pan has tried a combination of the ARIMA model and the Linear Regression (LR) model [5]. Based on that, they have applied a genetic algorithm to select the optimal classification metrics and classify different time series. By doing this, people can have a better understanding and forecasting accuracy on the patterns of the same type of series. ARIMA seems to be a mainstream option while dealing with time series data, not only because of its high accuracy but also its simplicity. Combination of ARIMA and other algorithms is also a common approach.
2.2. Machine Learning Models Used for Sales Forecasting
Different kinds of machine learning models have been used to forecast e-commerce sales data. Aljbour has used a LSTM model based on factors like user engagement, browsing habit and consumer decision-making to predict Taobao sales data [6]. The feasibility of using LSTM in this area has been confirmed, and competitive results have been produced compared to similar studies. In 2021, Yin compared the performance of AdaBoost, Full Connection and Convolutional Neural Network (CNN) on e-commerce sales forecasting tasks and got the results that CNN outperforms with the best prediction and generalization ability [7].
Similar to this paper, comparative analysis of statistical methods and machine learning models also exists. Singh has proposed research with the Knowledge Discovery in Databases (KDD) methodology to assess how Random Forest (RF), Gradient Boosting (GBM), and ARIMA have SARIMA perform in prediction [8]. Altuncu has also conducted research comparing LSTM, SVR, and LR models in short-term online sales forecasting [9]. LSTM has stood out with the lowest MSE among them. In 2023, Bharti’s research concluded that while using time series data like seasonal data, ARIMA and SARIMA are the best performing models [10]. Nonetheless, while other features are incorporated, XGBoost is more effective. In brief, it could be found that LSTM and XGBoost are used most frequently while solving e-commerce sales forecasting problems in nowadays’ research.
3. Methodology
In this part, the entire process of the experiment is displayed in the format of text and flowchart (Figure 1). While detailed steps are introduced, theoretical concepts of the algorithms are also explained.
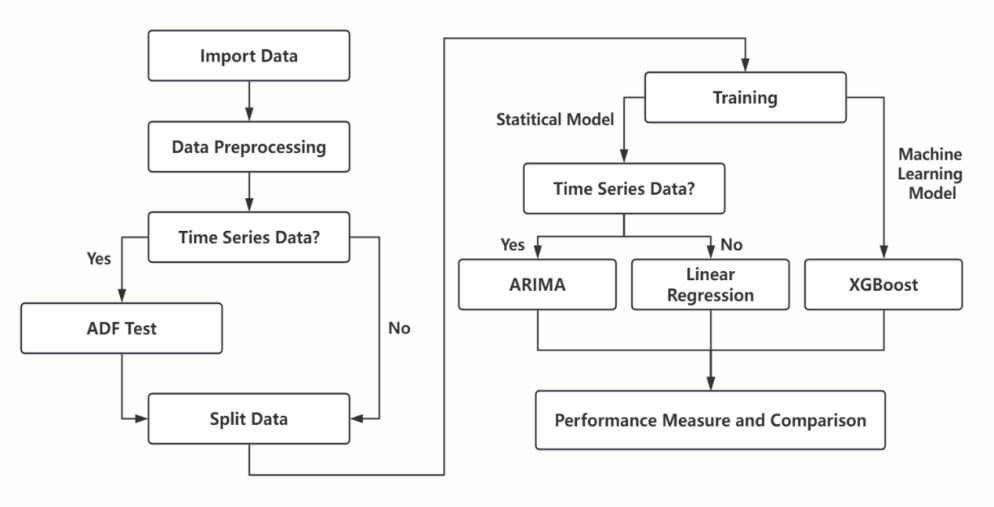
Figure 1: Flowchart of the experiment.
3.1. Data Selection and Preprocessing
This study used two datasets taken from Kaggle. The main reason for using two different datasets was to compare the performance of statistical techniques and machine learning algorithms on datasets with and without time series data. The first one was a Walmart E-Commerce Sales Dataset, including attributes like gender, age, occupation, marital status, etc [11]. It is a dataset without time series data. First of all, the data with missing values were omitted. All the categorical attributes were transformed into numerical attributes. For dichotomous data like gender, they were replaced by 0 and 1. For segmented attributes like age, the median was used as a substitute. For attributes with multiple categories but without ranking relation like city category, one-hot encoding was used to transform it for the purpose of analysis. The step after this was feature scaling. Standardization was chosen to improve the efficiency and stability while training. The second dataset used was an Amazon Sales Dataset, including attributes like date, status, fulfillment, SKU, if its B2B or not, currency, etc. Most preprocessing steps were similar with processing the Walmart dataset [12]. One thing different was the time series data. Firstly, the date attribute was converted from character format to date format. The next step was to use the XTS package to covert the target column, which is Amount, into a time series object indexed by date. Finally, linear interpolation was used to fill in the missing values in the time series object. The Augmented Dickey-Fuller (ADF) test was performed to check for the stationarity of the time series data. With the p-value of 0.0156, the stationary of this time series object was proved. Both of the datasets were split into a training set and a test set.
3.2. Training and Model Selection
3.2.1. ARIMA
For the Amazon sales dataset, the statistical model used is ARIMA. It is a widely used statistical model that forecasts future values by capturing the trends and fluctuations in time series data. It is usually denoted as ARIMA (p, d, q), and its formula is:
\( {y_{t}}={β_{0}}+{β_{1}}{y_{t-1}}+{β_{2}}{y_{t-2}}+…+{β_{p}}{y_{t-p}}+{ϵ_{t}}+{θ_{1}}{ϵ_{t-1}}+{θ_{2}}{ϵ_{t-2}}+…+{θ_{q}}{ϵ_{t-q}} \) (1)
P stands for the order of the autoregressive part, d stands for the order of differencing, and q stands for the order of the moving average part. The basic idea of ARIMA is the combination of AR and MA. ARIMA assumes that at a given time, the value is influenced by both the values from the past and random events. It is commonly used in predicting short-term time series data such as sales data, housing prices, and stock prices.
3.2.2. Linear Regression
For the Walmart dataset, which doesn’t contain time series data, the statistical model used is LR. It describes the linear relationship between two or more variables. The mathematical expression of multiple linear regression is:
\( y={β_{0}}+{β_{1}}{x_{1}}+{β_{2}}{x_{2}}+…+{β_{n}}{x_{n}}+ϵ \) (2)
LR is usually used to predict continuous variables while there is a linear relationship between the independent and dependent variables.
3.2.3. XGBoost
For both datasets, the machine learning algorithm used is XGBoost. It is a popular model that has been frequently used in machine learning competitions in recent years. XGBoost is an additive model that, based on the theory of Gradient Boosting, trains a set of weak learners iteratively to build a strong learner. The weights are optimized based on the errors from the previous round in each iteration to fit the data better. In this study, Bayesian Optimization is used for hyperparameter tuning. After setting the parameters first and using cross-validation to evaluate the model’s performance, the RMSE is returned by the objective function to be minimized later. Bayes optimization is executed afterwards to find the best combination of hyperparameters within the range established and improve the model performance.
4. Results and Discussion
This study aims to compare the performance of traditional and machine learning approaches on e-commerce sales prediction. For the purpose of a more comprehensive analysis, two datasets with and without time series data are used to analyze this topic and discuss the conclusions in different conditions. For performance measures, various methods exist. For this study, Mean Absolute Error (MAE) and Root Mean Square Error (RMSE) are chosen and applied to all the models used. Compared to Mean Error (ME), in which extreme values can neutralize each other, MAE is less affected by outliers since it uses the absolute value and is generally more robust. Meanwhile, RMSE is an indicator that is extremely sensitive to outliers. The reason for choosing RMSE instead of Mean Square Error (MSE) is because RMSE provides a measure of error in the same units as the original data, which is easier to interpret and understand. In this study, RMSE is considered the primary evaluation metric, while MAE serves as a supplementary measure.
Table 1: Performance Metrics of LR, ARIMA and XGBoost.
Dataset | Model | MAE | RMSE |
Walmart (Without Time Series Data) | Linear Regression | 0.7163 | 0.9289 |
XGBoost | 0.4294 | 0.5760 | |
Amazon (With Time Series Data) | ARIMA | 11.2906 | 14.7900 |
XGBoost | 216.4529 | 277.7282 |
According to Table 1, in the Walmart dataset, the lower MAE of XGBoost compared to LR shows that the prediction values of XGBoost are closer to the actual values, indicating that XGBoost is more precise in forecasting. At the same time, XGBoost has a smaller RMSE than Linear Regression, suggesting that XGBoost has better fitting accuracy than LR. A possible reason for this is that LR is a simple model that sometimes could not capture all the correlations among the data. Meanwhile, XGBoost is a complex model that can capture the non-linear relationships. Thus, XGBoost displays an obvious better fit than the LR model.
In contrast, for the Amazon dataset with time series data, the machine learning XGBoost does not have as good a performance as the statistical model ARIMA. Both the MAE and RMSE of ARIMA are obviously smaller than the XGBoost ones. Although the value of both MAE and RMSE is larger than the ones in the Walmart dataset, it is supposed to be caused by the much larger range of the target attribute. The ARIMA model has a Mean Absolute Percentage Error (MAPE) of 1.68%. This small percentage value indicates the accuracy of the ARIMA model in forecasting. The Ljung-Box test is also performed on the residuals and achieved a p-value close to 1, meaning that the residuals don’t have a significant autocorrelation. Based on all the analysis above, it can be concluded that this ARIMA model has successfully captured the patterns in the data and is a good fit.
5. Conclusion
In this study, traditional statistical models and machine learning algorithms were applied to two different datasets to analyze cases with and without time series data separately. In datasets without time series data, the machine learning model demonstrates a significantly better fit to the data. However, in a dataset containing time series data, the traditional statistical model outperforms in terms of prediction accuracy. Due to space limitations, this paper could not include more algorithms for comparison. While it is not possible to claim that all such models will perform better in each scenario based on this research alone, a potential trend could still be inferred. Given that e-commerce sales forecasting often involves time series attributes, ARIMA is expected to have widespread usage in analysis. Simultaneously, due to the complexity and adaptability of machine learning models, their performance is also anticipated. For future enhancement of this study, improving the dataset could be a possible solution; incorporating a larger dataset with more attributes and more detailed time series data may facilitate capturing patterns more effectively.
A potential avenue for future research is to include more different methods like SARIMA, LSTM, and CNN, and assess their performance across diverse datasets. A more comprehensive study can explore deeper into the comparison of traditional and machine learning methods. Another possible future approach would be the combination of statistical models and machine learning algorithms. For example, using hybrid models, ensemble models, or residual learning methods. Since these two kinds of models perform well in different situations, the combination can leverage the strengths of both and achieve a higher accuracy.
Acknowledgment
I would like to express my sincere gratitude to everyone who has supported me throughout the completion of this research. First and foremost, I would like to appreciate my supervisors for their guidance. During the process of this study, they have been kindly answering my questions and giving out advice on this paper. Also, I am deeply grateful to my family and friends for their support, understanding, and encouragement. Thank you all for your contributions and support.
References
[1]. Rakhim, M & Umar, A & Abdumalik, R, The Role of E-Commerce in the World Economy [J] Psychology and Education Journal, vol 58, no.2, 2021, pp. 6281–6285.
[2]. Makkar, S & Jaiswal, S, Predictive Analytics on E-commerce Annual Sales [C] Proceedings of Data Analytics and Management. Lecture Notes on Data Engineering and Communications Technologies, vol 90, 2022, pp. 557-567.
[3]. Saleem, H & Muhammad, K.B & Nizamani, A.H & Saleem, S & Butt, J, Data Science and Machine Learning Approach to Improve E-Commerce Sales Performance on Social Web [J] International Journal of Advanced Research in Engineering & Technology, vol 12, no.4, pp. 410-424.
[4]. Arunkumar, M & Palaniappan, S & Sujithra, R & VijayPrakash, S, Exploring Time Series Analysis Techniques for Sales Forecasting [C] Data Science and Network Engineering. ICDSNE 2023. Lecture Notes in Networks and Systems, vol 791, 2023, pp. 41-55.
[5]. Pan, Z & Wei, P, E-Commerce Demand Forecasting Based on Time Series Analysis and Commodity Classification [C] 2023 3rd International Signal Processing, Communications and Engineering Management Conference (ISPCEM), 2023, pp. 01-07.
[6]. Aljbour, M & Avcı, İ, Sales Prediction in E-Commerce Platforms Using Machine Learning [C] Forthcoming Networks and Sustainability in the AIoT Era. FoNeS-AIoT 2024. Lecture Notes in Networks and Systems, vol 1036, 2024, pp. 207-216.
[7]. Yin, X & Tao, X, Prediction of Merchandise Sales on E-commerce Based on Data Mining and Deep Learning [J] Scientific Programming, 2021, pp. 1-9.
[8]. Singh, K & Booma, P.M & Eaganathan, U, E-commerce System for Sale Prediction Using Machine Learning Technique [J] Journal of Physics: Conference Series, vol. 1712, no.1, 2020.
[9]. Altuncu, M.A & Tastan, M.H & Özcan, T, Machine Learning Based Approaches for Short Term Sales Forecasting in E-Commerce [C] Towards Industry 5.0. ISPR 2022. Lecture Notes in Mechanical Engineering, 2023, pp. 16-24.
[10]. Bharti, S.K & Mishra, S.K & Jose, S.S.S & Singh, P.K, Prediction of Future Sales Using Machine Learning Algorithms [C] Recent Advances in Mechanical Engineering, Volume 2. ICMech-REC 2023. Lecture Notes in Mechanical Engineering, 2024, pp. 471-479.
[11]. DEVARAJ V, e-Commerce (Walmart) Sales Dataset. May 30, 2024. https://www.kaggle.com/datasets/devarajv88/walmart-sales-dataset
[12]. The Devastator, E-Commerce Sales Dataset. Aug 28, 2023. https://www.kaggle.com/datasets/thedevastator/unlock-profits-with-e-commerce-sales-data/data?select=Amazon+Sale+Report.csv
Cite this article
Sun,L. (2024). A Comparative Study of Traditional and Machine Learning Approaches for E-Commerce Sales Forecasting. Advances in Economics, Management and Political Sciences,135,46-51.
Data availability
The datasets used and/or analyzed during the current study will be available from the authors upon reasonable request.
Disclaimer/Publisher's Note
The statements, opinions and data contained in all publications are solely those of the individual author(s) and contributor(s) and not of EWA Publishing and/or the editor(s). EWA Publishing and/or the editor(s) disclaim responsibility for any injury to people or property resulting from any ideas, methods, instructions or products referred to in the content.
About volume
Volume title: Proceedings of the 3rd International Conference on Financial Technology and Business Analysis
© 2024 by the author(s). Licensee EWA Publishing, Oxford, UK. This article is an open access article distributed under the terms and
conditions of the Creative Commons Attribution (CC BY) license. Authors who
publish this series agree to the following terms:
1. Authors retain copyright and grant the series right of first publication with the work simultaneously licensed under a Creative Commons
Attribution License that allows others to share the work with an acknowledgment of the work's authorship and initial publication in this
series.
2. Authors are able to enter into separate, additional contractual arrangements for the non-exclusive distribution of the series's published
version of the work (e.g., post it to an institutional repository or publish it in a book), with an acknowledgment of its initial
publication in this series.
3. Authors are permitted and encouraged to post their work online (e.g., in institutional repositories or on their website) prior to and
during the submission process, as it can lead to productive exchanges, as well as earlier and greater citation of published work (See
Open access policy for details).
References
[1]. Rakhim, M & Umar, A & Abdumalik, R, The Role of E-Commerce in the World Economy [J] Psychology and Education Journal, vol 58, no.2, 2021, pp. 6281–6285.
[2]. Makkar, S & Jaiswal, S, Predictive Analytics on E-commerce Annual Sales [C] Proceedings of Data Analytics and Management. Lecture Notes on Data Engineering and Communications Technologies, vol 90, 2022, pp. 557-567.
[3]. Saleem, H & Muhammad, K.B & Nizamani, A.H & Saleem, S & Butt, J, Data Science and Machine Learning Approach to Improve E-Commerce Sales Performance on Social Web [J] International Journal of Advanced Research in Engineering & Technology, vol 12, no.4, pp. 410-424.
[4]. Arunkumar, M & Palaniappan, S & Sujithra, R & VijayPrakash, S, Exploring Time Series Analysis Techniques for Sales Forecasting [C] Data Science and Network Engineering. ICDSNE 2023. Lecture Notes in Networks and Systems, vol 791, 2023, pp. 41-55.
[5]. Pan, Z & Wei, P, E-Commerce Demand Forecasting Based on Time Series Analysis and Commodity Classification [C] 2023 3rd International Signal Processing, Communications and Engineering Management Conference (ISPCEM), 2023, pp. 01-07.
[6]. Aljbour, M & Avcı, İ, Sales Prediction in E-Commerce Platforms Using Machine Learning [C] Forthcoming Networks and Sustainability in the AIoT Era. FoNeS-AIoT 2024. Lecture Notes in Networks and Systems, vol 1036, 2024, pp. 207-216.
[7]. Yin, X & Tao, X, Prediction of Merchandise Sales on E-commerce Based on Data Mining and Deep Learning [J] Scientific Programming, 2021, pp. 1-9.
[8]. Singh, K & Booma, P.M & Eaganathan, U, E-commerce System for Sale Prediction Using Machine Learning Technique [J] Journal of Physics: Conference Series, vol. 1712, no.1, 2020.
[9]. Altuncu, M.A & Tastan, M.H & Özcan, T, Machine Learning Based Approaches for Short Term Sales Forecasting in E-Commerce [C] Towards Industry 5.0. ISPR 2022. Lecture Notes in Mechanical Engineering, 2023, pp. 16-24.
[10]. Bharti, S.K & Mishra, S.K & Jose, S.S.S & Singh, P.K, Prediction of Future Sales Using Machine Learning Algorithms [C] Recent Advances in Mechanical Engineering, Volume 2. ICMech-REC 2023. Lecture Notes in Mechanical Engineering, 2024, pp. 471-479.
[11]. DEVARAJ V, e-Commerce (Walmart) Sales Dataset. May 30, 2024. https://www.kaggle.com/datasets/devarajv88/walmart-sales-dataset
[12]. The Devastator, E-Commerce Sales Dataset. Aug 28, 2023. https://www.kaggle.com/datasets/thedevastator/unlock-profits-with-e-commerce-sales-data/data?select=Amazon+Sale+Report.csv