


1. Introduction
Environmental, Social, and Governance (ESG) are metrics that are employed to evaluate the sustainability and social accountability of corporations. The prediction of a company's ESG policies has become a primary focus in recent years. This is done to help the firm mitigate the risk associated with poor ESG performance and to aid investors in making informed investment choices. ESG measurements provide insights into how firms adapt to environmental shifts, fulfil social obligations, and navigate governance frameworks.
Many scholars have been formulating methods companies could use to predict ESG performance. Aue, Jatowt and Färber [1] are an example of scholars who pursued research for the prediction of ESG rating by using multivariate time series analysis deep learning techniques to analyze news articles for 3,000 United States of America (US) companies. Aue et al. [2] created a model to analyze the news from over 30,000 domain sources for the selected companies for the years 2018, 2019 and 2020, with the first step involving classifying articles to ESG relevance and then determining their sentiment with next step involving clustering the articles for deep learning model in the time series of article relevance, article sentiment, and article semantic. The result from Aue et al. [3] research showed that ESG rating can be predicted from the information provided in the news, and the model fits the task of ESG prediction.
Like Aue et al. [4] attempt to predict the ESG rating for companies, Sariyer et al. [5] also attempted to predict ESG rating using an artificial intelligence (AI) based multistage deep learning. Sariyer et al. [5] clustered 500 Fortune-listed companies into three cluster groups based on their ESG scores and a model trained to predict their sustainability performance. In the model by Sariyer et al. [5], the scoring system for each ESG component was divided such that the E component had three components, S had four components, and G had three components. Each component had its scoring system consolidated to form the ESG score. The model by Sariyer et al. [5] used the scores of each ESG component for clustering and delivering a predictive model for ESG prediction. Similarly, Del Vitto et al. [3] and Zhang & Zhang [6] also tried to develop an ESG predictive model by exploiting machine learning techniques, which they used to develop a white-box and black-box mathematical model to predict and classify ESG rating. Del Vitto et al. [3] obtained ESG rating data for financial institutions, manufacturing and information tech companies from China, USA and Europe and Lasso, Ridge, and Artificial Neural Network (ANN) regression methods were used to train and test the accuracy in predicting the ESG rating. Both Sariyer et al. [3] and Del Vitto al al. [3] demonstrated it is possible to predict the ESG performance of companies using the past ESG rating performance.
D'Amato et al. [7] investigated whether the structural data available in a firm balance sheet and income statement affect the ESG rating where they used machine learning, especially the random forest algorithm model, to confirm that financial statement highly explains ESG rating. Notably, Lai et al. [8] used the ESG rating to develop a model predicting company performance. Lai et al. [8] used economic indicators, ESG score, annual financial report and patent data. They applied a machine learning classifier for these datasets to develop a predictive model to help firms and investors make better investment decisions [9]. The impact of ESG in influencing investing decisions is also confirmed by the research by Song et al. [10], who utilise ESG rating to develop a model for predicting financial distress in the energy sector. Song et al. [10] confirmed that comprehensive ESG reporting is essential for accurately predicting the possibility of financial distress and assessing financial risk for companies in the energy sector.
This paper focuses on leveraging machine learning to predict corporate ESG scores, aiming to identify key features within companies' reports that significantly influence these scores. The study employs three predictive models: linear regression, random forests, and gradient boosting machine (GBM) to estimate ESG risk scores. To enhance model robustness, Grid Search from scikit-learn is used for hyperparameter tuning through cross-validation, ensuring optimal performance across dataset subsets. The models are evaluated using Root Mean Square Error (RMSE) and R-squared (R²) to assess and compare predictive accuracy. Experimental results demonstrate that the gradient boosting model performs best, while industry classification is the most impactful factor in determining ESG scores. Developing a reliable ESG predictive model can guide investors in making informed decisions and assist companies in enhancing their ESG performance. The next section will outline the methodology, including data collection and analysis, followed by a discussion of model results, with the paper concluding with final insights.
2. Methodology
2.1. Dataset Description and Preprocessing
The analysis will obtain two forms of raw data, with the first involving the company's ESG risk rating obtained for S&P 500 companies' ESG score rating from Kaggle [5]. The other type of data obtained is the financial indicator data for the S&P 500 companies sourced from Kaggle [4]. The financial indicators data obtained will include Sector, Price, Price/Earnings, Dividend Yield, Earnings/Share, 52-week low, 52-week high, Market Cap, Earnings Before Interest, Taxes, Depreciation and Amortization (EBITDA), Price/Sales, and Price/Book. Data cleaning was performed to remove inconsistency and standardize the data, while non-numeric data were encoded to numeric to enhance model performance.
2.2. Proposed Approach
The objective of this study is to forecast ESG scores, which are essential metrics for assessing corporate sustainability and accountability, using machine learning techniques. The study utilizes gradient boosting, random forest, and linear regression algorithms to model and predict ESG performance. The methodology involves collecting financial and ESG data from S&P 500 companies, preprocessing the data to ensure consistency, and training the models using advanced machine learning techniques. Extensive testing and validation were conducted, including cross-validation and hyperparameter tuning via Grid Search. The results indicate that the gradient boosting model delivers the most accurate predictions. These findings highlight the effectiveness of gradient boosting for ESG score forecasting, offering valuable insights for businesses and investors aiming to align with sustainability goals.
2.2.1. Linear Regression, Random Forest, Gradient Boosting
Linear regression captures the relationship between the financial indicators and the ESG score. The random forest machine learning algorithm is used to train the model to enhance prediction accuracy and handle non-linear feature relationships in multiple decision trees to produce one output. Gradient boosting machine learning optimizes model performance and prediction accuracy through incremental modelling.
The first model used to capture the linear correlations between financial indicators and ESG scores is linear regression. This approach is simple and effective for preliminary analyses since it works well in situations where it is anticipated that the connections between the variables would exhibit a straight-line trend. To elaborate, the random forest approach is used to greatly increase the model's prediction accuracy. The random forest algorithm requires the construction of several decision trees during the training phase. The class that emerges from these trees represents the mode of the classes of each individual tree. Compared to a single decision tree, an ensemble technique is more effective at handling non-linear correlations and interactions between features, offering a strong defense against overfitting and improved generalization across a variety of datasets.
Finally, incremental learning is used with gradient boosting to further improve the model's performance. With this method, the model is constructed step-by-step, with each stage aiming to fix the mistakes from the preceding one. Gradient boosting efficiently reduces prediction errors, improving the predictive accuracy by concentrating on the most difficult situations in subsequent training cycles. Furthermore, this strategy adds flexibility by using weak predictive models to iteratively refine areas where prior models have underperformed.
2.2.2. Model training and optimization
Three methods are used to train the model and optimize performance to ensure improved accuracy in predicting ESG scores. The first method is hyperparameter tuning, which involves utilizing Grid Search Cross-Validation (GridSearchCV) for hyperparameter optimization to achieve the best parameter combination. The second method involves cross-validation and, in this step assesses model performance, ensuring stability and generalizability. The third step involves model evaluation metrics where RMSE assesses the magnitude of prediction errors, and R² measures the model's ability to explain data variance.
2.3. Details of the Implementation
This work implements decision tree models using Python 3.10 and the Scikit-learn module in an effort to achieve high prediction accuracy for ESG ratings. Seaborn and Matplotlib libraries are used to enable rigorous data analysis and visualization, enabling informative graphical representations of the data. The computational work is carried out on a macOS system that has an Apple M1 System on a Chip (SoC) installed, guaranteeing effective data handling and processing. In order to maximize performance, the decision tree model is set up with certain hyperparameters: it employs the Gini index as the impurity measure, requires at least one sample per leaf node to avoid overfitting, and has no upper limit on the maximum tree depth to thoroughly examine the data structure. Furthermore, all data points are taken into account equally with a minimum sample weight of 0.0, which improves the model's capacity to generalize across various data sets. The objective of this configuration is to enhance the accuracy and applicability of the model's forecasts for corporate governance and sustainability strategy decision-making.
3. Result and Discussion
3.1. Explanatory Data Analysis
Explanatory data analysis is a graphic illustration of the distribution of the data parameters. Figure 1 shows the distribution of ESG scores for S&P 500 corporate, which shows a normal distribution of companies' ESG scores, with the most concentrated scores of 20 and 25 showing moderate risk levels.
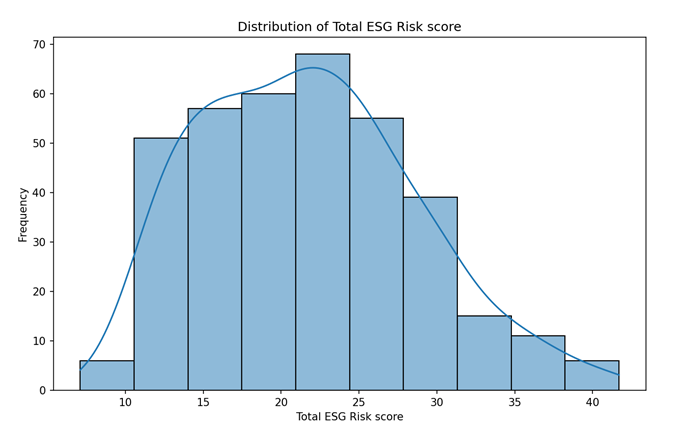
Figure 1: Distribution of S&P 500 ESG score.
Additionally, a correlation analysis for the financial indicator’s parameter is conducted. Figure 2 below shows the correlation matrix for all indicators used to predict ESG scores for S&P 500 companies. Sector exhibits the highest correlation score with ESG score showing its high impact on ESG score. In contrast, divided yield exhibits the lowest correlation with ESG score, indicating minimal impact on ESG score. Price/Sales and Price/Book correlate negatively with ESG scores, suggesting a negative relationship between financial health and ESG risks.
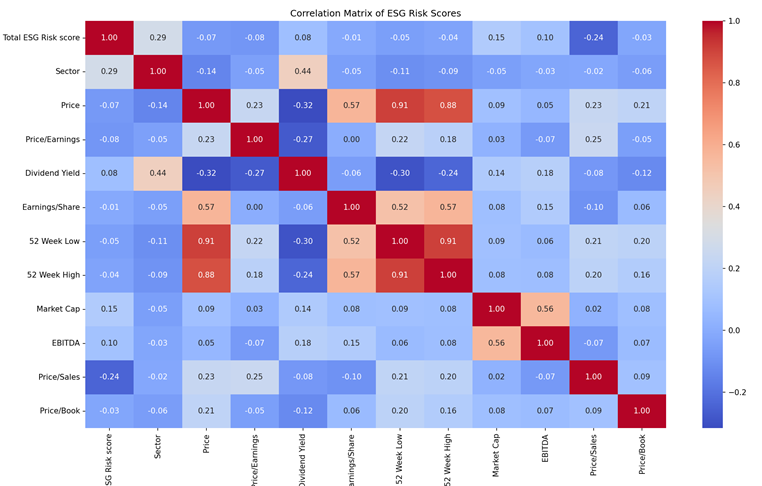
Figure 2: Correlation matrix for financial indicators and ESG score.
3.2. Model Performance
The assessment of each parameter's impact on the model performance indicates that the sector had the greatest impact on ESG prediction, indicating its critical role in model prediction o ESG as shown in Figure 3. Other significant indicators impacting model prediction include Price/Sales, Price/Book, and Market Cap.
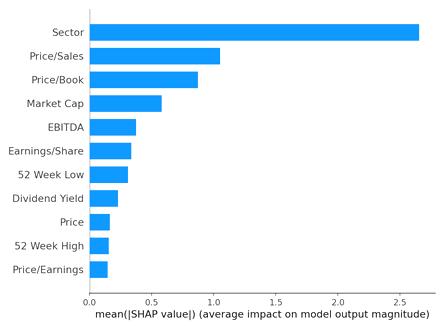
Figure 3: Indicators impacts on model output magnitude.
The data points for linear regression, random forest and gradient boosting are mapped to show how each performs in prediction accuracy, as shown in Figure 4 below. Data points for linear regression are widely scattered from the red line, showing poor prediction accuracy. Radom forest shows an increased concentration of data points close to the red line, indicating improved prediction. The gradient boosting shows more concentration and is closer to the red line, showing a more consistent prediction.
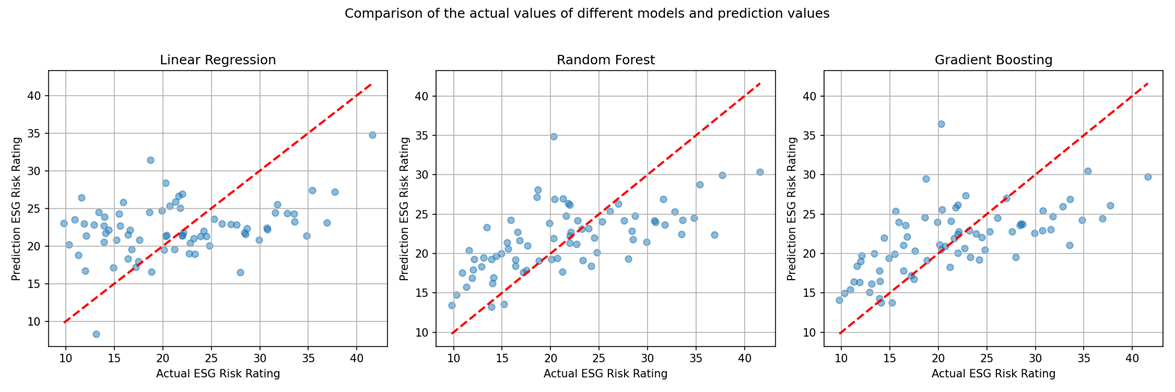
Figure 4: Comparison of the model prediction using the data point mapping.
The RMSE and R2 are calculated for three prediction models for ESG scores: linear regression, random forest, and gradient boosting. Simple linear regression does not need any parameter adjustment and yields an RMSE of 7.1975 and a R² of 0.0827, demonstrating the lowest performance among the three models, as depicted in Table 1. Random forests achieve optimal performance when the maximum depth is 10, the minimum number of samples per leaf is 2, the minimum number of samples per split is 2, and the number of estimators is 200. These models have an RMSE of 5.9546 and a R² of 0.3721, indicating intermediate performance among the three models. The application of gradient boosting yielded optimal results after adjusting the parameters to a learning rate of 0.1, maximum depth of 3, minimum samples leaf of 2, minimum samples split of 5, and n estimators of 50. The resulting RMSE was 5.8873 and the R² was 0.3863, as shown in Table 1.
Table 1: Best parameter performance, RMSE and R2 score for the model.
Model | Best Parameters | RMSE | R2 |
Linear Regression | N/A | 7.1975 | 0.0827 |
Random Forest | Maximal depth: 10, Minimum number of leaf samples: 2, Minimum number of split samples: 2, Number of estimators: 200 | 5.9546 | 0.3721 |
Gradient Boosting | Learning rate: 0.1 Maximal depth: 3 Minimum number of leaf samples: 2 Minimum number of split samples: 5 Number of estimators: 200 | 5.8873 | 0.3863 |
The training testing and close validation technique is performed on the three models to determine the model's performance after machine learning. Linear regression emerges with the highest error, indicating its inability to capture the complexity of the data. Radom forest emerges to have moderate performance but with some overfitting. Gradient boosting seems to provide the best balance between training test performance with the lowest test and cross-validation RSME, as shown in Table 2 below, suggesting its best model for predicting ESG scores.
Table 2: Train, Test and Cross-validation RMSE score for the models.
Model | Train RMSE | Test RMSE | Cross-validation RMSE |
Linear Regression | 6.0628 | 7.1975 | 6.3049 |
Random Forest | 2.6164 | 5.9546 | 5.6675 |
Gradient Boosting | 3.4809 | 5.8873 | 5.5808 |
4. Conclusion
The gradient boosting model emerged as the most effective for predicting ESG risk scores among S&P 500 companies, achieving the lowest RMSE and highest R² across all models. Shapley Additive Explanations (SHAP) analysis identified sector as the most significant factor influencing ESG scores, followed by Price/Sales, Price/Book, and Market Capitalization. Companies can enhance their ESG performance by addressing the key issues related to these factors, such as investing in sustainable initiatives. This study provides significant value for investors, enabling them to leverage the ESG prediction model to assess and invest in companies with higher sustainability scores. Similarly, companies can use this model to identify critical features impacting their ESG scores and focus on improving these areas to attract investment.
Future research could enhance the gradient boosting model further through hyperparameter optimization and by exploring other ensemble methods such as Extreme Gradient Boosting (XGBoost) or Categorical Boosting (CatBoost). Incorporating qualitative data could also improve the model's predictive accuracy. However, the current model relies on financial data from S&P 500 companies, limiting its generalizability to other firms. Additionally, the lack of social and environmental data constrains the model's scope. Despite its predictive power, models like gradient boosting are complex, suffer from poor interpretability, and can make feature interactions difficult to explain.
References
[1]. Aue, T., Jatowt, A., & Färber, M. (2022) Predicting Companies' ESG Ratings from News Articles Using Multivariate Timeseries Analysis. arXiv preprint:2212.11765.
[2]. D’Amato, V., D’Ecclesia, R., & Levantesi, S. (2021) Fundamental ratios as predictors of ESG scores: A machine learning approach. Decisions in Economics and Finance, 44(2), 1087-1110.
[3]. Del-Vitto, A., Marazzina, D., & Stocco, D. (2023) ESG ratings explainability through machine learning techniques. Annals of Operations Research, 1-30.
[4]. Fisher, P. (2021) S&P 500 companies with financial information. Retrieved on 2024, Retrieved from: https://www.kaggle.com/datasets/paytonfisher/sp-500-companies-with-financial-information
[5]. Sariyer, G., Mangla, S.K., Chowdhury, S., Sozen, M.E., & Kazancoglu, Y. (2024) Predictive and prescriptive analytics for ESG performance evaluation: A case of Fortune 500 companies. Journal of Business Research, 181, 114742.
[6]. Zhang, A.Y., Zhang, J.H. (2023) Renovation in environmental, social and governance (ESG) research: the application of machine learning. Asian Review of Accounting, 12, 15-18.
[7]. Kumar, P. (2024) S&P 500 ESG risk ratings. Retrieved on 2024, Retrieved from: https://www.kaggle.com/datasets/pritish509/s-and-p-500-esg-risk-ratings.
[8]. Lai, C., Chen, D.N., Tsuo, Y., & Liu, J.H. (2022) Predicting firm performance using ESG scores, annual reports, and patents, 2, 11-13.
[9]. Rajesh, R., & Rajendran, C. (2020) Relating environmental, social, and governance scores and sustainability performances of firms: An empirical analysis. Business Strategy and the Environment, 29(3), 1247-1267.
[10]. Song, Y., Li, R., Zhang, Z., & Sahut, J.M. (2024) ESG performance and financial distress prediction of energy enterprises. Finance Research Letters, 65, 105546.
Cite this article
Jiang,X. (2024). Predicting Corporate ESG Scores Using Machine Learning: A Comparative Study. Advances in Economics, Management and Political Sciences,118,141-147.
Data availability
The datasets used and/or analyzed during the current study will be available from the authors upon reasonable request.
Disclaimer/Publisher's Note
The statements, opinions and data contained in all publications are solely those of the individual author(s) and contributor(s) and not of EWA Publishing and/or the editor(s). EWA Publishing and/or the editor(s) disclaim responsibility for any injury to people or property resulting from any ideas, methods, instructions or products referred to in the content.
About volume
Volume title: Proceedings of the 3rd International Conference on Financial Technology and Business Analysis
© 2024 by the author(s). Licensee EWA Publishing, Oxford, UK. This article is an open access article distributed under the terms and
conditions of the Creative Commons Attribution (CC BY) license. Authors who
publish this series agree to the following terms:
1. Authors retain copyright and grant the series right of first publication with the work simultaneously licensed under a Creative Commons
Attribution License that allows others to share the work with an acknowledgment of the work's authorship and initial publication in this
series.
2. Authors are able to enter into separate, additional contractual arrangements for the non-exclusive distribution of the series's published
version of the work (e.g., post it to an institutional repository or publish it in a book), with an acknowledgment of its initial
publication in this series.
3. Authors are permitted and encouraged to post their work online (e.g., in institutional repositories or on their website) prior to and
during the submission process, as it can lead to productive exchanges, as well as earlier and greater citation of published work (See
Open access policy for details).
References
[1]. Aue, T., Jatowt, A., & Färber, M. (2022) Predicting Companies' ESG Ratings from News Articles Using Multivariate Timeseries Analysis. arXiv preprint:2212.11765.
[2]. D’Amato, V., D’Ecclesia, R., & Levantesi, S. (2021) Fundamental ratios as predictors of ESG scores: A machine learning approach. Decisions in Economics and Finance, 44(2), 1087-1110.
[3]. Del-Vitto, A., Marazzina, D., & Stocco, D. (2023) ESG ratings explainability through machine learning techniques. Annals of Operations Research, 1-30.
[4]. Fisher, P. (2021) S&P 500 companies with financial information. Retrieved on 2024, Retrieved from: https://www.kaggle.com/datasets/paytonfisher/sp-500-companies-with-financial-information
[5]. Sariyer, G., Mangla, S.K., Chowdhury, S., Sozen, M.E., & Kazancoglu, Y. (2024) Predictive and prescriptive analytics for ESG performance evaluation: A case of Fortune 500 companies. Journal of Business Research, 181, 114742.
[6]. Zhang, A.Y., Zhang, J.H. (2023) Renovation in environmental, social and governance (ESG) research: the application of machine learning. Asian Review of Accounting, 12, 15-18.
[7]. Kumar, P. (2024) S&P 500 ESG risk ratings. Retrieved on 2024, Retrieved from: https://www.kaggle.com/datasets/pritish509/s-and-p-500-esg-risk-ratings.
[8]. Lai, C., Chen, D.N., Tsuo, Y., & Liu, J.H. (2022) Predicting firm performance using ESG scores, annual reports, and patents, 2, 11-13.
[9]. Rajesh, R., & Rajendran, C. (2020) Relating environmental, social, and governance scores and sustainability performances of firms: An empirical analysis. Business Strategy and the Environment, 29(3), 1247-1267.
[10]. Song, Y., Li, R., Zhang, Z., & Sahut, J.M. (2024) ESG performance and financial distress prediction of energy enterprises. Finance Research Letters, 65, 105546.