


1. Introduction
Bitcoin (BTC), proposed in 2008 and released as open-source software in 2009, is the world's first cryptocurrency. Since its inception, Bitcoin has grown exponentially and has attracted investors’ attention as an investment asset and trading medium. Between January 2011 and January 2023, Bitcoin’s trading volume surged from just $637 to $38.59 billion, and its market value increased more than 175,000 times, reaching $439.29 billion. Notably, in 2017, Bitcoin achieved significant legitimacy when the Chicago Mercantile Exchange (CME) and the Chicago Options Exchange (CBOE) began listing Bitcoin futures contracts, marking a milestone that positioned Bitcoin alongside major commodities. This enhanced Bitcoin's market liquidity and cemented its role as a major financial asset [1].
Despite its global popularity and widespread adoption, Bitcoin is notorious for its unique characteristics of significant risks, which is consistent with past researches. Tu and Meredith points out that Bitcoin sometimes loses about one-third or even half of its value within a trading day [2]. Blau finds that the estimated volatility of Bitcoin is almost twice that of 51 sovereign currencies [3]. Bouri et al. also emphasizes that Bitcoin behaves more like a speculative investment rather than a stable hedge, with high levels of risk compared to traditional markets [4]. These indicate that Bitcoin has extreme risk-return pattern compared with traditional financial assets, and therefore requires more in-depth and rigorous research.
Our paper aims to explore risk-return patterns of BTC. Igor Makarov and Antoinette Schoar have provided detailed analyses of the Bitcoin ecosystem and its risk-return pattern. They highlight that Bitcoin demonstrates significant systemic risk, which is captured through its high volatility and sensitivity to broader market movements. They also apply CAPM model to assess Bitcoin's market behavior compared to traditional assets [5].
We compare BTC with traditional assets such as DXY, GLD, SPY and QQQ through the characteristics of BTC through its annualized return, volatility, sharp ratio, maximum drawdown, skewness and kurtosis to understand their discrepancy with traditional investment assets. The results show that Bitcoin has a much higher annualized return and significantly larger volatility. In addition, we construct investment portfolios that combine Bitcoin and traditional assets in different percentage to assess whether these combinations can bind the high-return advantage of Bitcoin with the low-risk advantage of traditional assets (such as the US dollar) to increase the portfolio return within investors' risk tolerance range. We find that the sharp ratio increases with low proportion of Bitcoin in the investment portfolio, which indicates an improvement in the risk-adjusted return, and then start to decrease after the maximum. Moreover, we investigate the risks of cryptocurrency from prominent historical risk events. By analyzing failed cryptocurrency exchanges like FTX, Terra Luna, Mt.Gox and 3AX, we have discovered significant vulnerabilities and risks within the cryptocurrency system. Our results have important implications for policy makers and investors.
The remainder of this study is structured as follows. Section 2 describes the research design. Section 3 lists empirical results. Risks in Bitcoin are listed in Section 4, followed by a conclusion in the final section.
2. Research Design
2.1. Bitcoin characteristics
Bitcoin is the first cryptocurrency and has gained widespread recognition as a speculative investment and trading medium. One of its most prominent features is its potential of high returns. In the past decade, Bitcoin has experienced significant price increases, attracting both retail and institutional investors. Unlike traditional assets, the supply limit of Bitcoin is 21 million coins, which some investors see as a hedge against inflation and currency depreciation. Although Bitcoin has high returns, its price behavior is highly speculative, driven by market sentiment, technological advancements, and regulatory developments.
Bitcoin is created as a digital currency which aims at facilitating peer-to-peer transactions without the need for intermediaries such as banks or governments. Satoshi Nakamoto presents that this feature positions Bitcoin as a means of exchange for goods and services. It allows users to make cross-border payments at lower fees and faster speeds compared with traditional assets, especially in international transactions. However, the use of Bitcoin as a currency has been limited by certain practical challenges. Its high volatility makes it difficult for investors to use it as a stable medium of transaction. By contrast, the pricing of traditional currencies is usually more stable. Moreover, the slow processing time and high transaction costs of Bitcoin during network congestion further limit its utility as a conventional currency [6].
Another notable feature of Bitcoin is its risk-return pattern, which differs it from traditional financial assets. The volatility of Bitcoin is exceptionally large, which often leads to enormous price fluctuations in a short period of time. This volatility helps Bitcoin achieve high returns, but also brings considerable risks to investors. The risk-return pattern of Bitcoin is far more extreme than most traditional assets, which makes it a high risk, high return investment [7].
2.2. Methodology
In our study, we test the variables in this analysis through two ways: approximating annualized data by daily, weekly and monthly observations and take the average for comparison with traditional assets and by monthly observations for portfolio construction. By adopting approximated annualized indicators, this methodology provides a comprehensive assessment of the risk-return pattern of Bitcoin. The research results will reveal the differences between Bitcoin as a cryptocurrency from traditional assets, and its behavior in constructing investment portfolios.
2.3. Data and variables
2.3.1. Data
We obtain intraday data of Bitcoin and other traditional assets from Yahoo Finance. The sample covers the period from October 22, 2017 to January 31, 2023. This period captures significant growth and decline stages (highest price at $69040 while lowest price at $3155) in the history of the Bitcoin market which makes it an ideal period for analyzing its long-term performance in comparing with traditional assets. These data include daily observations that allow for a detailed examination. Daily data can provide detailed dynamic of assets’ prices which captures both short-term and long-term trends. We use the close price in the dataset to calculate key variables such as annualized return, volatility, sharp ratio, maximum drawdown, skewness and kurtosis.
2.3.2. Variables
The analysis of Bitcoin's risk-return pattern in this study is based on a series of statistical variables that provide insights into its risk-return pattern and investment potential. Each variable provides insights into different aspects of risk and return related to Bitcoin and other traditional assets. The following key variables will be examined: annualized return, volatility, sharp ratio, maximum drawdown, skewness and kurtosis.
Our first variable is assets’ return. Return measures the percentage change in asset prices over time and is a key indicator of performance. Higher return means better performance. When comparing Bitcoin with traditional assets, we use daily weekly and monthly returns to approximate annualized returns, which provides a comprehensive view of the average short-term volatility of Bitcoin over different periods. Daily data captures price fluctuations, while weekly and monthly data smooth out short-term fluctuations, which gives a clearer comparison of the long-term return potential of Bitcoin and traditional assets. In portfolio analysis, we use monthly returns for approximating, which reveals a broader trend of asset performance over a longer period. This makes it more suitable for portfolio constructions and makes it less sensitive to daily fluctuations.
\( {R_{t}} =\frac{{P_{t}} – {P_{t-1}}}{{P_{t-1}}}\ \ \ (1) \)
where \( {R_{t}} \) is the return of trading time quantum t; \( {P_{t}} \) is close price of the last trading day of time quantum t; \( {P_{t-1}} \) is close price of the last trading day of time quantum t-1.
The second variable is assets’ volatility. Volatility measures the standard deviation of return and represents for the risk associated with assets. Higher volatility means greater uncertainty and the possibility of price fluctuations. Approximating annualized volatility by daily/weekly/monthly volatility captures that in the short term (using daily data) and is balanced with more stable long-term risk estimates (using monthly data). Compared to traditional assets, this provides a deeper understanding of Bitcoin's risk pattern. For investment portfolios, we approximate annualized volatility with monthly data. This method smooths short-term fluctuations and provides a better long-term view of portfolio risk.
\( {σ_{t}}=\sqrt[]{\frac{1}{n-1}\sum _{t=1}^{n}{{(R_{t}}-\sum _{t=1}^{n}\frac{{R_{t}}}{n})^{2}}} *\sqrt[]{{n^{ \prime }}} \ \ \ (2) \)
where \( {σ_{t}} \) is the volatility depending on the selection of time quantum; n is the number of trading time quanta; n’ is the number of trading time quanta in a year.
The third variable is assets’ sharp ratio. Sharp ratio measures the risk-adjusted return by comparing the return above risk-free rate (we assume risk-free rate 0) with asset volatility. A higher sharp ratio indicates that the investment effectively compensates for the risk taken on. The daily data approximation captures finer details of risk and return in the short term, while the monthly data approximation is more suitable for portfolio level analysis, where decisions are made over the long term.
\( {S_{t}} =\frac{{n^{ \prime }}*\sum _{t=1}^{n}\frac{{R_{t}}}{n} - {R_{f}}}{{σ_{t}}}\ \ \ (3) \)
where \( {S_{t}} \) is the sharp ratio depending on the selection of time quantum, which conforms to that of \( {σ_{t}} \) ; \( {R_{f}} \) is the risk-free rate, which we assume to be 0. Multiply \( \sum _{t=1}^{n}{R_{t}}/n \) by n’ to approximate the annualized return.
The forth variable is assets’ maximum drawdown. Maximum drawdown measures the largest peak-to-trough decline during a period. It provides insight into the most severe losses that investors may face during this period. This is a key indicator for understanding risk, especially in assets with high volatility like Bitcoin.
\( {H_{t}}=\underset{t from 2 to n}{max}{({P_{t-1}}, {P_{t}})}\ \ \ (4) \)
\( {D_{t}} = ({H_{t}}- {P_{t}})/{H_{t}}\ \ \ (5) \)
\( {MD_{t}} =\underset{t from 2 to n}{max}{{D_{t}}}\ \ \ (6) \)
where \( {H_{t}} \) is the “previous highest” close price of trading time quantum t; \( {D_{t}} \) is the drawdown of trading time quantum t. \( {MD_{t}} \) is the maximum drawdown depending on the selection of time quantum.
The fifth variable is assets’ skewness. Skewness measures the asymmetry of return distribution. Positive skewness indicates more frequent small losses and occasional large increases, while negative skewness indicates more frequent small increases and occasional large losses.
\( {Skew_{t}} = \frac{n}{(n-1)(n-2)}\sum _{t=1}^{n}{(\frac{{R_{t}}-\sum _{t=1}^{n}\frac{{R_{t}}}{n}}{{σ_{t}}})^{3}}\ \ \ (7) \)
where \( {Skew_{t}} \) is the skewness depending on trading time quantum t.
The sixth variable is assets’ kurtosis. Kurtosis reflects the tail of the return distribution, which indicates the possibility of extreme outcomes. Peak intensity indicates a higher likelihood of extreme returns, no matter positive or negative.
\( {Kurt_{t}} = \frac{n(n+1)}{(n-1)(n-2)(n-3)}\sum _{t=1}^{n}{(\frac{{R_{t}}-\sum _{t=1}^{n}\frac{{R_{t}}}{n}}{{σ_{t}}})^{4}} - \frac{3{(n-1)^{2}}}{(n-2)(n-3)}\ \ \ (8) \)
where \( {Kurt_{t}} \) is the kurtosis depending on the selection of trading time quantum t.
3. Empirical results
3.1. Bitcoin and Quasi-Currency
This section focuses on comparing Bitcoin with quasi-currency such as DXY (US dollar index) and GLD (gold). Investors typically seek these assets during periods of market uncertainty, as they tend to maintain or increase value during economic downturns. Gold and the US dollar are classic examples of quasi-currency which share certain functions, especially in serving as a non-traditional form of value storage or exchange medium. This comparison aims to understand whether Bitcoin's behavior is similar to these assets, which are often seen as substitutes for fiat currency during periods of market uncertainty. By examining key financial indicators, we evaluate how Bitcoin's performance differs from or aligns with these more stable assets.
Table 1: Comparison of BTC and Quasi-Currency
Return | Volatility | Sharp_Ratio | Max_Drawdown | Skewness | Kurtosis | |
BTC | 55.94% | 78.93% | 0.71 | 80.52% | 0.02 | 2.66 |
DXY | 1.69% | 6.57% | 0.26 | 11.68% | -0.15 | 1.90 |
GLD | 8.39% | 13.80% | 0.61 | 19.97% | 0.02 | 2.19 |
Note: This table summarizes the key financial indicators like the annualized return, volatility, sharp ratio, maximum drawdown, skewness and kurtosis of Bitcoin and traditional asset DXY and GLD.
In contrast to the U.S. Dollar Index (DXY), Bitcoin offers much higher returns, but with proportional volatility. Compared to DXY's stability and minimal fluctuations, Bitcoin's significant maximum drawdown indicates greater risk in holding it as an asset. Despite this, Bitcoin still offers a higher risk adjusted return. The higher skewness and kurtosis of Bitcoin suggest a much greater chance of extreme price movements.
When compared to gold (GLD), Bitcoin demonstrates much higher returns, but again at the cost of much higher volatility. Gold has a much smaller maximum drawdown, making it a more stable investment. However, Bitcoin's sharp ratio indicates that despite its high volatility, it provides better risk compensation than gold. Both assets show similar skewness, but Bitcoin's higher kurtosis presents its vulnerability to extreme price spikes or drops.
3.2. Bitcoin and Stock Index
In this section, we compare Bitcoin with traditional stock indices: SPY (S&P 500 Index) and QQQ (NASDAQ 100 Index). These indices reflect the general performance of stock markets, which makes them benchmarks for comparing Bitcoin’s behavior. Stock indices and Bitcoin both have high-risk and high-return characteristics, so the purpose of this comparison is to evaluate the risk-return pattern of them, in order to understand whether Bitcoin's behavior has discrepancy with traditional stocks.
Table 2: Comparison of BTC and Stock Index
Return | Volatility | Sharp_Ratio | Max_Drawdown | Skewness | Kurtosis | |
BTC | 55.94% | 78.93% | 0.71 | 80.52% | 0.02 | 2.66 |
SPY | 12.39% | 19.85% | 0.62 | 29.83% | -0.50 | 5.23 |
QQQ | 16.19% | 23.36% | 0.69 | 34.25% | -0.28 | 2.03 |
Note: This table summarizes the key financial indicators like the annualized return, volatility, sharp ratio, maximum drawdown, skewness and kurtosis of Bitcoin and traditional asset SPY and QQQ.
Bitcoin’s comparison with the S&P 500 Index (SPY) illustrates its higher potential for returns, but with significantly increased risk. During the sample period, the annualized return of Bitcoin has exceeded that of SPY. However, large fluctuations in daily prices reflect its higher volatility. In addition, the maximum drawdown of Bitcoin is much greater than that of SPY, which indicates an increased risk of sharp price drop. Despite the higher risk, Bitcoin's sharp ratio shows competitive risk adjusted returns compared to SPY. The skewness of these two assets is similar, which shows a neutral to slightly negative skewness. But the kurtosis of Bitcoin indicates that it has a more prominent tail risk so that it is more susceptible to extreme price fluctuations than SPY.
When compared to the Nasdaq 100 Index (QQQ), Bitcoin exhibits similar patterns, with higher returns but greater volatility and larger maximum drawdowns. For annualized returns, Bitcoin performs better than QQQ, but it presents higher risks from larger price fluctuations and greater loss potential. However, compared to QQQ, Bitcoin's sharp ratio remains attractive. Like QQQ, the skewness of Bitcoin points to a slight trend towards more frequent negative returns, and Bitcoin is more likely to suffer significant losses due to its larger kurtosis.
3.3. Portfolio Analysis
This section examines the performance of investment portfolios consisting of different proportions of Bitcoin (BTC) and four traditional assets (DXY, GLD, SPY and QQQ) using various allocation methods. We construct investment portfolios consist of different percentage of BTC from 0% to 100% at intervals of 10% and analyze key indicators such as monthly annualized return, volatility, sharp ratio, maximum drawdown, skewness and kurtosis to evaluate the risk-return pattern of different investment portfolios to find the proportion with the best risk-adjusted return. We construct four figures of the value of annualized monthly return, volatility and sharp ratio with the proportion change of BTC and traditional assets in the portfolios.
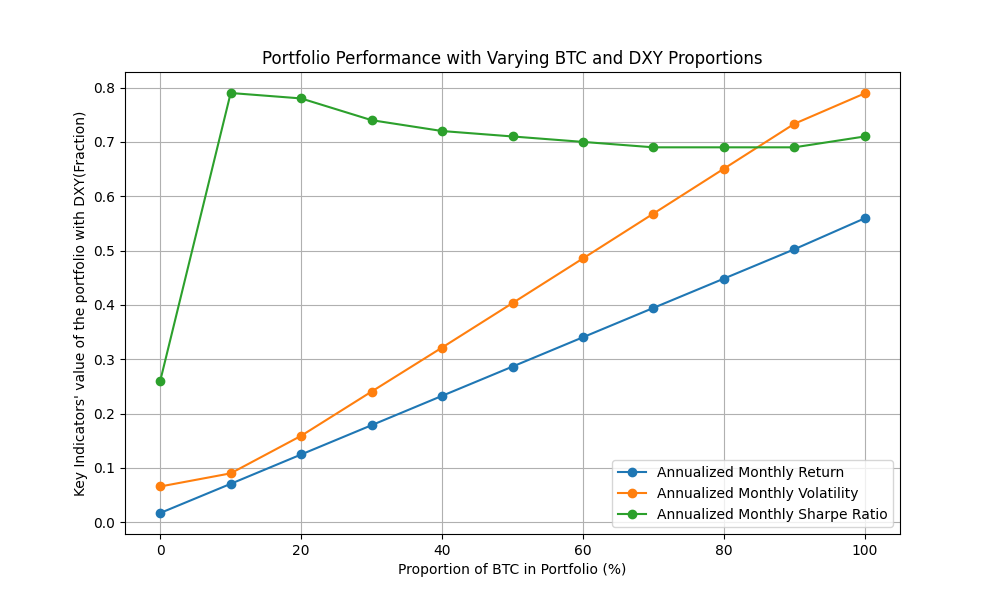
Figure 1: Return, volatility and sharp ratio with different proportion of BTC and DXY
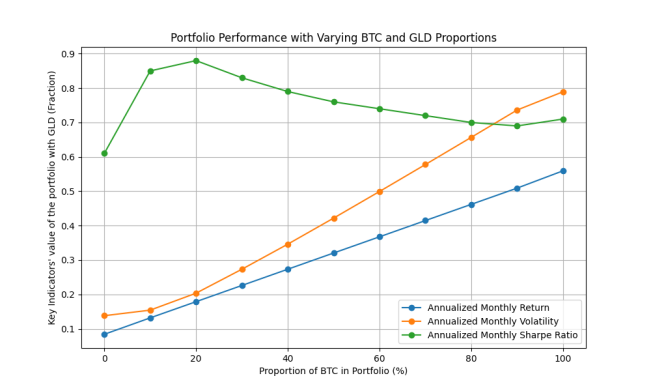
Figure 2: Return, volatility and sharp ratio with different proportion of BTC and GLD
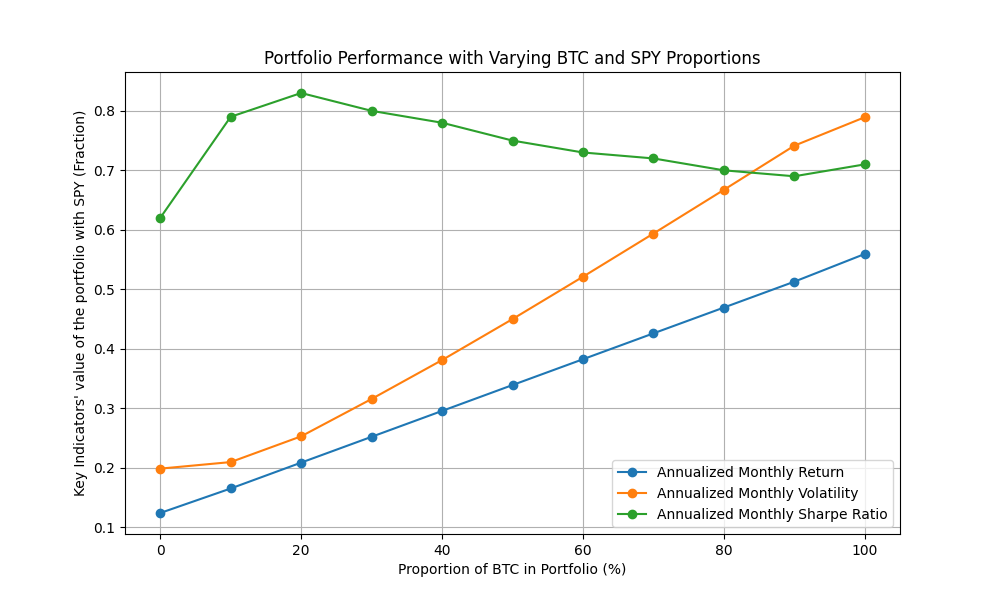
Figure 3: Return, volatility and sharp ratio with different proportion of BTC and SPY
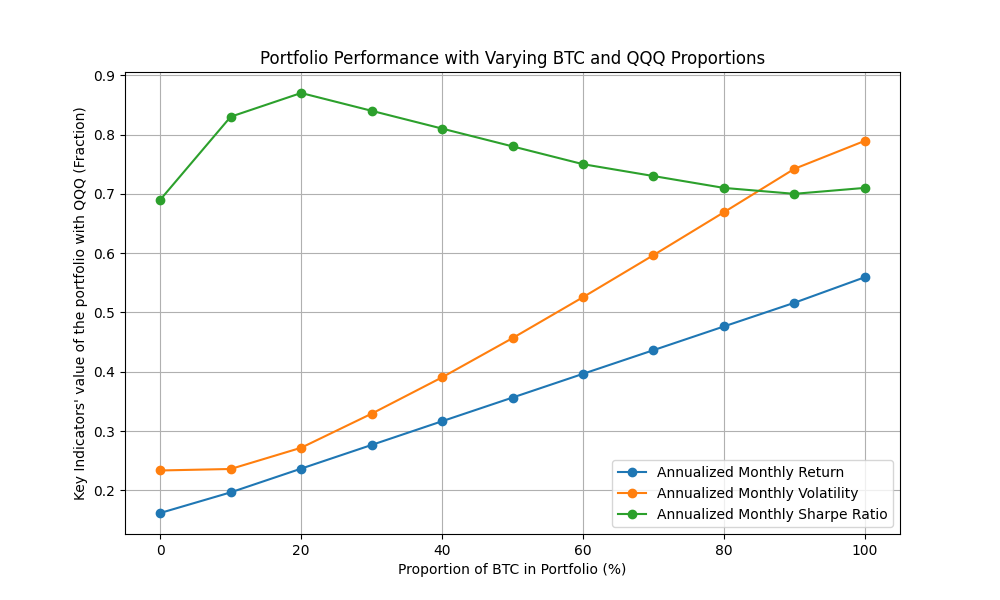
Figure 4: Return, volatility and sharp ratio with different proportion of BTC and QQQ
From these four line graphs, we can observe the following trends in annualized monthly returns, volatility, and sharp ratio as the proportion of BTC in the investment portfolio increases: As the proportion of BTC in the investment portfolio increases, the return continues to increase. BTC typically provides higher returns compared to more stable traditional assets such as DXY, GLD, SPY and QQQ. The linear upward trend indicates a positive correlation between the return and the percentage of BTC in portfolios. The volatility also increases with the proportion of BTC in the investment portfolio. BTC is known for its high volatility, and as BTC increases in the investment portfolio, the overall volatility of the investment portfolio significantly increases. Both of these two indicators demonstrate almost linear growth, which indicate that higher proportion of BTC brings greater returns and risks. the sharp ratio initially increases with a small portion of BTC in the investment portfolio, but it begins to decrease after reaching a maximum (approximately 20% BTC). This trend indicates that higher percentage of BTC corresponds to higher returns, but to a certain extent, as volatility grows faster than returns, the risk adjusted return begins to stabilize or decrease.
From the behavior of the sharp ratio, we can conclude that adding BTC to an investment portfolio can initially increase risk adjusted returns due to its high return potential. However, further increase in BTC will lead to a decrease in the risk adjusted return after reaching a certain percentage (usually 20%). For investors who consider to add BTC to their investment portfolios, it is fairly important to strike a balance between potential high returns and corresponding risks. With the analysis of sharp ratio, we find that the range of 10% -20% BTC provides the optimal balance between return and risk, with sharp ratio reaching its peak at these ratios. It allows investors to benefit from the high-return potential of BTC and keep the volatility at a manageable level. In conclusion, for most investors, a diversified investment portfolio which contains a small or moderate proportion of BTC is the ideal choice to maximize returns without taking on excessive risk.
4. Risks on Bitcoins
4.1. Typical Risk Events on Cryptocurrency
Previous analysis indicates that Bitcoin has high-risk characteristics. This part we will explore the risks of Bitcoin through specific historical events. These events provide insights into vulnerabilities and challenges related to cryptocurrencies, particularly Bitcoin. We analyze the failures of well-known companies such as FTX, Mt. Gox, Terra Luna, and Three Arrows Capital (3AC) and have a better understanding about the factors that contribute to the instability and risk of the cryptocurrency market. These studies reveal the consequences of poor management, lack of regulation, security vulnerabilities, and high leverage, which provide empirical experience for investors and regulatory agencies.
FTX, one of the largest cryptocurrency exchanges, experienced a collapse in 2022 due to severe mismanagement and lack of transparency in operations. The main reason for the failure is the improper allocation of client funds, which were improperly used for speculative trading, which result in significant liquidity risk. As concerns about the company's solvency intensify, large-scale customer withdrawals have led to a liquidity crisis. Due to insufficient funds to pay for withdrawals, FTX declared bankruptcy. This incident highlights the vulnerability of centralized exchanges to poor internal management, especially in situations where regulatory oversight is limited. The collapse of FTX highlights the need for stronger governance and better risk management practices in the cryptocurrency industry.
Mt.Gox was one of the earliest and largest Bitcoin exchanges, but it went bankrupt after a major hacker attack in 2014. During the peak of Bitcoin trading, the exchange was responsible for nearly 70% of Bitcoin transactions. However, poor security protocols and operational failures caused Mt.Gox vulnerable to cyber attacks. Hackers stole approximately 850,000 bitcoins, which caused significant losses to investors and forced the exchange to file for bankruptcy. The Mt. Gox hack exposed critical security vulnerabilities in early cryptocurrency infrastructure, which indicate that even well-known exchanges can become victims of security breaches without strong protective measures. This incident has also led to a widespread distrust of cryptocurrency exchanges among investors.
The failure of its algorithmic stable coin UST caused the collapse of Terra Luna in 2022. As investors panicked and began to sell UST, its price plummeted, which reduced the value of Luna (a cryptocurrency that supports UST). The interconnection between these two assets forms a feedback loop, which led to an accelerated market collapse. The failure of Terra Luna highlights the inherent risks of algorithmic stable coins, particularly when they lack sufficient mechanisms to handle market volatility or large-scale selling.
The prominent cryptocurrency hedge fund Three Arrows Capital (3AC) collapsed in 2022 due to excessive leverage and high-risk investment strategies. The company had taken on a significant amount of debt in order to fund its investments, many of which were assets with high volatility. When the cryptocurrency market experienced a downturn, 3AC was unable to fulfill its financial obligations, which resulted in its collapse. The failure of 3AC highlights the danger of high leverage in the cryptocurrency industry, where price fluctuations can be extreme. In addition, it emphasizes how interconnected risks within the broader cryptocurrency ecosystem can lead to chain bankruptcies when large enterprises such as 3AC go bankrupt.
4.2. Risk analysis of Bitcoin
Based on historical events of major cryptocurrency exchanges such as FTX, Mt. Gox, Terra Luna, and Three Arrows Capital (3AC), Bitcoin (BTC) poses several key risks to investors. One of the most prominent risks is security vulnerability. The Mt. Gox hacking incident causes a loss of 850,000 bitcoins, which indicates that even for those exchanges with large volumes of transactions, they still face the risk of network attacks. Market volatility is another major risk. As the Terra Luna crash demonstrates, the algorithmic mechanisms fail and lead to market collapse, which impacts the entire cryptocurrency system. The price of Bitcoin fluctuates greatly and so may cause significant losses in a short period of time. Lack of regulation also remains as a key issue. As the collapse of FTX reveals, lack of regulation leads to poor management and abuse of customer funds, which results in a liquidity crisis and ultimately bankruptcy. In addition, the failure of 3AC indicates that interrelated investments will bring the systemic risks and shows how the failure of an entity can spread across a wider market and influence investors’ confidence and liquidity.
5. Conclusion
In this paper, we use historical data and apply key financial indicators such as return, volatility, sharp ratio, skewness, and kurtosis to compare Bitcoin with traditional financial assets to analyze its risk-return pattern. The empirical results indicate that Bitcoin provides higher returns compared to traditional assets like DXY, GLD, SPY and QQQ. However, these high returns come at the cost of corresponding volatility and declines, which makes Bitcoin a high-risk asset. Also, we explore Bitcoin’s performance in investment portfolios in order to find the best way to combine Bitcoin and traditional assets. Sharp ratio analysis shows that although higher percentage of Bitcoin in an investment portfolio can increase returns, the risk adjusted return starts to decrease when the proportion of Bitcoin exceeds 20%. This suggests that investors should be cautious when they allocate more than a moderate proportion of their investment portfolios to Bitcoin. In addition, we aim to study the inherent risks in the cryptocurrency market and provide assistance to Bitcoin investors with the analysis of historical events (FTX, Mt. Gox, Terra Luna, and 3AC). These events highlight key risks such as security vulnerabilities, lack of regulation, market volatility and systemic risks, all of which can lead to systemic crashes. Overall, Bitcoin remains as an attractive investment for those who seek high returns, but it requires careful risk management and a balanced investment portfolio approach. Investors are advised to limit their investment to Bitcoin and remain vigilant about the possibility of regulatory changes and market volatility. This approach will help to mitigate significant risks and capture the high-return potential of Bitcoin at the same time.
References
[1]. Ahmed, W. M. (2020). Is there a risk-return trade-off in cryptocurrency markets? The case of Bitcoin. Journal of Economics and Business, 108, 105886.
[2]. Tu, K. V., & Meredith, M. W. (2015). Rethinking virtual currency regulation in the Bitcoin age. Wash. L. Rev., 90, 271.
[3]. Blau, B. M. (2017). Price dynamics and speculative trading in bitcoin. Research in international Business and Finance, 41, 493-499.
[4]. Bouri, E., Molnár, P., Azzi, G., Roubaud, D., & Hagfors, L. I. (2017). On the hedge and safe haven properties of Bitcoin: Is it really more than a diversifier?. Finance Research Letters, 20, 192-198.
[5]. Makarov, I., & Schoar, A. (2021). Blockchain analysis of the bitcoin market. Available at SSRN 3942181.
[6]. Nakamoto, S. (2008). Bitcoin: A peer-to-peer electronic cash system. Satoshi Nakamoto.
[7]. Liu, Y., & Tsyvinski, A. (2021). Risks and returns of cryptocurrency. The Review of Financial Studies, 34(6), 2689-2727.
Cite this article
Zhou,J. (2025). Bitcoin's Risk-Return Pattern: A Comparative Analysis with Traditional Assets. Advances in Economics, Management and Political Sciences,138,150-159.
Data availability
The datasets used and/or analyzed during the current study will be available from the authors upon reasonable request.
Disclaimer/Publisher's Note
The statements, opinions and data contained in all publications are solely those of the individual author(s) and contributor(s) and not of EWA Publishing and/or the editor(s). EWA Publishing and/or the editor(s) disclaim responsibility for any injury to people or property resulting from any ideas, methods, instructions or products referred to in the content.
About volume
Volume title: Proceedings of the 3rd International Conference on Financial Technology and Business Analysis
© 2024 by the author(s). Licensee EWA Publishing, Oxford, UK. This article is an open access article distributed under the terms and
conditions of the Creative Commons Attribution (CC BY) license. Authors who
publish this series agree to the following terms:
1. Authors retain copyright and grant the series right of first publication with the work simultaneously licensed under a Creative Commons
Attribution License that allows others to share the work with an acknowledgment of the work's authorship and initial publication in this
series.
2. Authors are able to enter into separate, additional contractual arrangements for the non-exclusive distribution of the series's published
version of the work (e.g., post it to an institutional repository or publish it in a book), with an acknowledgment of its initial
publication in this series.
3. Authors are permitted and encouraged to post their work online (e.g., in institutional repositories or on their website) prior to and
during the submission process, as it can lead to productive exchanges, as well as earlier and greater citation of published work (See
Open access policy for details).
References
[1]. Ahmed, W. M. (2020). Is there a risk-return trade-off in cryptocurrency markets? The case of Bitcoin. Journal of Economics and Business, 108, 105886.
[2]. Tu, K. V., & Meredith, M. W. (2015). Rethinking virtual currency regulation in the Bitcoin age. Wash. L. Rev., 90, 271.
[3]. Blau, B. M. (2017). Price dynamics and speculative trading in bitcoin. Research in international Business and Finance, 41, 493-499.
[4]. Bouri, E., Molnár, P., Azzi, G., Roubaud, D., & Hagfors, L. I. (2017). On the hedge and safe haven properties of Bitcoin: Is it really more than a diversifier?. Finance Research Letters, 20, 192-198.
[5]. Makarov, I., & Schoar, A. (2021). Blockchain analysis of the bitcoin market. Available at SSRN 3942181.
[6]. Nakamoto, S. (2008). Bitcoin: A peer-to-peer electronic cash system. Satoshi Nakamoto.
[7]. Liu, Y., & Tsyvinski, A. (2021). Risks and returns of cryptocurrency. The Review of Financial Studies, 34(6), 2689-2727.