


1. Introduction
In light of the accelerated pace of global economic development and the concomitant intensification of global integration, logistics, as a pivotal component of the national economy, represents the most economical service mode in the industrialization process, and it is developing rapidly worldwide [1]. Forecasting regional logistics demand can assist in the concentration of resources for preparation and the reduction of costs [2]. Logistics demand is closely related to factors such as regional economy, industrial structure, and policies, and it is a comprehensive result of these factors, exhibiting a nonlinear relationship. Due to limited sample data, it is difficult to describe it using analytical methods or exact mathematical models [3].Many prediction models, such as the support vector machine (SVM) model, the neural network prediction model, the grey prediction model, the linear regression model, and others, have been used extensively in recent years. The neural network prediction model, SVM, and gray prediction model are capable of fitting nonlinear functions while taking the variables affecting shifts in logistical demand into account. SVM can effectively handle nonlinear problems, possess good generalization capabilities and find global optimal solutions during the solution process. SVM is also suitable for situations with small sample sizes. The BP neural network can learn and approximate complex nonlinear mapping relationships through its multi-layer structure and error back propagation algorithm. However, it requires a large number of data samples and may have issues such as weak generalization capabilities when the sample size is too small. This paper utilizes grey relational analysis to screen indicators influencing logistics demand and. Based on the SVM model, it then conducts modeling and simulation predictions of logistics demand in Jiangsu Province. Meanwhile, it compares the results of modeling and simulation using BP neural network to verify the effectiveness of SVM for prediction. The findings of this research contribute to the advancement of scientific forecasting techniques for regional logistics demand, facilitate the optimization and enhancement of regional modern logistics systems, and provide crucial decision-making insights for logistics system planning.
2. Construction of the SVM Model
2.1. Overview of Model Principles
Regional logistics demand forecasting relies on historical data and utilizes mathematical models to predict future logistics demand in a specific region [3]. A multitude of factors exert influence over logistics demand, and changes in logistics demand are the consequence of the combined effects of a variety of factors. There exists a hidden, internal mathematical mapping relationship between logistics demand and various factors. This mapping is not a simple multivariate linear relationship but a complex nonlinear one[4]. An abstract mathematical model may be employed for the purpose of describing the relationship between logistics demand and the various influencing factors. The mathematical model for logistics demand is shown as follows:
\( Y=f({x_{1}},{x_{2}},{x_{3}}......{x_{n}} ) \) (1)
Y represents the regional logistics demand, while xi represents the factors that affect regional logistics. The fundamental premise of SVM is to identify an optimal hyperplane that can effectively differentiate between data points belonging to disparate categories, thereby maximizing the margin between the two classes. This hyperplane is determined by support vectors, which are the sample points closest to the hyperplane. The model is distinguished by its reliability and stability, rendering it well-suited to the processing of small samples and nonlinear data sets.[5]. The main support vector machine regression algorithm employed for prediction has the functional expression as follows:
\( f(x)=\sum _{i=1}^{j}({a_{i}}-a_{i}^{*})k({x_{i,}} x)+b \) (2)
Among them, ai and ai* are Lagrange multipliers, k(xi, x) is the kernel function, and xi represents the input data of each sample. The selection of the kernel function in SVM is crucial[6]. After multiple comparisons, the SVM regression prediction model constructed based on the Gaussian kernel function exhibits better performance, thus the Gaussian kernel function is chosen. For the subsequent prediction calculations in this paper, the radial basis function parameter gamma is set to 0.8, the penalty factor c is set to 0.4, the insensitive loss function ε is set to 0.01, and MATLAB is used for prediction analysis.
2.2. Prediction Steps
Using the SVM model, this paper can investigate the relationship between logistics demand and its influencing factors. Once the model has been established, it is possible to make predictions regarding future logistics demand. The specific steps are as follows:
The preliminary stage of the process involves the gathering of data concerning the elements that exert an influence over regional logistics. Subsequently, the data are employed as input variables. The output indicator should be set as logistics demand. A grey relational analysis should be performed in order to determine the degree of closeness between the aforementioned indicators and the variable of logistics demand.
The second step is to divide the selected data into two distinct sets: a training set and a testing set. The training set will be employed for the purposes of model training, while the testing set will be utilized for model evaluation.
The third step is to construct a regional logistics demand prediction model based on support vector machines.
The fourth step is to train the model using the training set, making any necessary adjustments to the functions and parameters in order to achieve a superior fit to the data.
The fifth step entails evaluating the trained model using the testing set. This is accomplished by calculating the discrepancy between the actual and predicted values, as well as other pertinent indicators, in order to evaluate the model's predictive performance.
2.3. Evaluation Metrics
BP neural networks can be applied to non-linear problems, but they require a large number of samples and often suffer from issues such as insufficient generalization ability during the prediction process[7]. In this paper, a comparison was conducted between SVM and BP neural networks, with MSE (Mean Squared Error) and MAPE (Mean Absolute Percentage Error) employed as the evaluation metrics.
\( MSE=\frac{\sum (yi-\hat{y}i{)^{2}}}{n} \) (3)
\( MAPE=\frac{\sum (yi-\hat{y}i)/yi}{n}×100\% \) (4)
\( yi \) represent the actual logistics demand value, and \( \hat{y}i \) represent the predicted value of logistics demand, with n being the number of samples. MSE calculates the average of the squared differences between the predicted values and the actual values. MAPE expresses the average error size by calculating the absolute difference between the predicted and actual values and converting it into a percentage form.
3. Analysis
3.1. Indicator Selection
The choice of relevant indicators affects how accurate logistics demand forecasting can be. The accuracy of logistics demand forecasting can be improved by selecting the right indicators. This study suggests that the following indicators may have an impact on logistics demand forecasting: total fixed asset investment, per capita consumption expenditure of residents, per capita consumption income of residents, added value of the primary industry, added value of the secondary industry, and added value of the tertiary industry. These suggestions are based on an analysis of the existing literature, the actual conditions, and the availability of indicator data. Table 1 displays the factors affecting Jiangsu Province's need for logistics.
Table 1: Indicator System for Influencing Logistics Demand in Jiangsu Province.
Influencing factors | Index name | Units | Symbols |
Industrial structure | The added value of the primary industry | Billions of yuan | X1 |
The added value of the secondary industry | Billions of yuan | X2 | |
The added value of the tertiary industry | Billions of yuan | X3 | |
Capital input | Total fixed asset investment | Billions of yuan | X4 |
Residents’ consumption level | Per capita consumption expenditure of residents | yuan | X5 |
Per capita consumption income of residents | yuan | X6 | |
Total commercial trade | Total retail sales of consumer goods | Billions of yuan | X7 |
3.2. Data Sources
The logistics demand and related indicators of Jiangsu Province from 2004 to 2022 were selected. The data are sourced from the National Data Network of China and the “Jiangsu Statistical Yearbook”. The freight volume (Y) is selected to represent the regional logistics demand [8].
3.3. Correlation Analysis
The grey relational analysis is utilized to analyze the degree of correlation between various influencing factors and logistics demand. The core idea of grey relational analysis lies in the degree of proximity between sequences in terms of geometric shape, size, direction, speed, and other aspects [9]. The output results are presented in Table 2.
Table 2: Results of Grey Relational Analysis.
Influencing factors | X1 | X2 | X3 | X4 | X5 | X6 | X7 |
The degree of correlation with Y | 0.666 | 0.7353 | 0.6848 | 0.62 | 0.7113 | 0.7137 | 0.6950 |
The correlation degrees between the seven influencing factors and logistics demand are all greater than 0.6, which indicates that the seven influencing factors are all highly correlated with logistics demand
3.4. Models Fitting Effect
SVM and BP neural network were used to fit the logistics demand of Jiangsu Province from 2004 to 2022. The fitting results of the two are shown in Figure 1 and Figure 2.
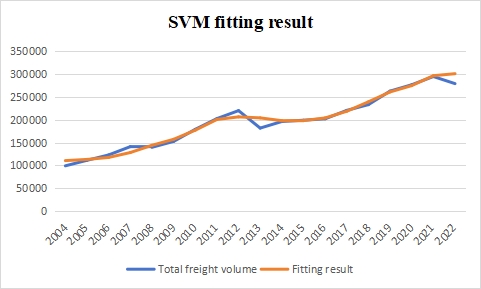
Figure 1: The fitting result of SVM.
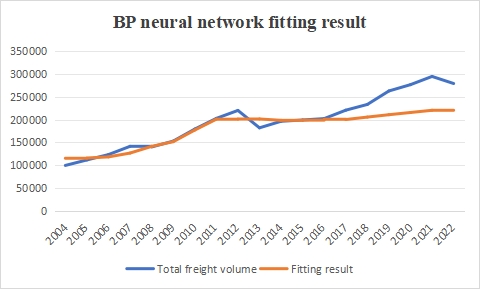
Figure 2: The fitting result of BP neural network.
According to the calculation results, the MAPE of the prediction using SVM fitting is 3.63%, while the MAPE of the prediction using BP neural network fitting is 8.88%. This indicates that SVM has a higher fitting accuracy. Due to the small sample size, SVM performs better in prediction than BP neural network.
4. Simulation and Prediction of Logistics Demand
To further apply the model to predict future logistics demand and verify its predictive performance, the data from 2004 to 2018 is utilized as the training set, while the data from 2019 to 2022 is used as the test set for simulation prediction. Subsequently. the predictive ability is then evaluated, and the results are shown in Table 3.
Table 3: Comparison of Actual Logistics Demand Values in Jiangsu Province from 2019 to 2021 with Predicted Values Based on BP Neural Network and SVM.
Year | Actual value | SVM | BP neural network |
2019 | 262749 | 260930 | 210610 |
2020 | 276640 | 274800 | 215460 |
2021 | 294678 | 296490 | 220330 |
2022 | 279143 | 300890 | 220550 |
MSE | 120727428.5 | 3855558118.5 | |
MAPE | 2.44% | 22.04% |
Therefore, for the prediction samples from 2019 to 2022, the MAPE of SVM prediction is 2.44%, and the MSE is 120727428.5. In contrast, the MAPE of BP neural network prediction is 22.04%, and the MSE is 3855558118.5. This indicates that SVM exhibits an overall better performance in predicting logistics demand compared to BP neural network.
5. Conclusion
The forecasting of regional logistics demands is a relatively complex modelling process, which is challenging to describe using analytical methods or exact mathematical models due to limited sample data. Despite the existence of a multitude of forecasting methodologies, traditional approaches frequently prove inadequate in addressing the specific requirements of a given context. This paper utilizes Support Vector Machines (SVM) to establish a regional logistics demand forecasting model. By conducting the aforementioned research and analysis, the modelling process of regional logistics demand forecasting can be completed. The initial step is the collection of data, which is then followed by the inputting of samples for the purpose of model training. Subsequently, the predictive capabilities of the SVM model and the BP neural network are evaluated through the use of simulation forecasting. A synthesis of the research findings leads to the following conclusion: The SVM demonstrates superior predictive performance in addressing issues pertaining to limited sample sizes, nonlinearity, and the presence of multiple factors. Consequently, it offers promising avenues for advancement in the domain of regional logistics demand forecasting. Although BP neural networks can also handle nonlinear problems, their predictive ability is weaker when the sample size is small. The research provides a relatively reliable and accurate method for future regional logistics demand forecasting. However, the logistics demand forecasting results in this paper focus solely on cargo transportation volume, without considering specific cargo categories or other data representative of logistics demand. When screening the influencing factors of logistics demand, a more comprehensive approach can be taken, and data dimensionality reduction methods can be employed to extract indicators. These are areas worthy of improvement, and future research can expand in these directions.
References
[1]. Gao, M., & Feng, Q. (2009). Modeling and forecasting of urban logistics demand based on support vector machine. In 2009 Second International Workshop on Knowledge Discovery and Data Mining (pp. 793-796). IEEE.
[2]. Yan, Y. (2011). Demand forecasting method in logistics management based on support vector machine. In 2011 International Conference on E-Business and E-Government (ICEE) (pp. 1-4). IEEE.
[3]. Li, H. Z., Guo, S., & Li, C. J. (2012). Fruit fly optimization and least squares support vector machine hybrid forecasting model: A case study of China's logistics demand forecasting. Economic Mathematics, 29(3), 103-106.
[4]. Zhang, H., & Xing, P. Z. (2012). Modeling and predictive simulation of regional logistics demand. Computer Simulation, 29(6), 351-354, 393.
[5]. Lü, Y. (2018). Research on regional logistics demand forecasting based on support vector machine. China Market, 2, 144-144.
[6]. Ma, Q., Sun, D., Shi, J., He, X., & Zhai, Y. (2020). Research on predicting the risk of tumor incidence in adults based on support vector machine and XGboost. Chinese General Practice, 23(12), 1486.
[7]. Sun, Z., Pan, J., Zhang, Z., Zhang, L., & Ding, Q. (2009). Traffic flow prediction based on the combination of principal component analysis and support vector machine. Journal of Highway and Transportation Research and Development (English Edition), 26(5), 127-131.
[8]. Liang, Y., & Xu, C. F. (2024). Modeling and predictive simulation of regional logistics demand based on SVM: A case study of Zhejiang Province. Logistics Research, 3, 54-60.
[9]. Yu, K. L. (2022). Research on regional logistics demand forecasting based on support vector machine. China Economic and Trade Herald, 5, 85-87.
Cite this article
Li,N. (2024). Logistics Demand Forecasting and Simulation Based on Support Vector Machine. Advances in Economics, Management and Political Sciences,139,143-148.
Data availability
The datasets used and/or analyzed during the current study will be available from the authors upon reasonable request.
Disclaimer/Publisher's Note
The statements, opinions and data contained in all publications are solely those of the individual author(s) and contributor(s) and not of EWA Publishing and/or the editor(s). EWA Publishing and/or the editor(s) disclaim responsibility for any injury to people or property resulting from any ideas, methods, instructions or products referred to in the content.
About volume
Volume title: Proceedings of the 3rd International Conference on Financial Technology and Business Analysis
© 2024 by the author(s). Licensee EWA Publishing, Oxford, UK. This article is an open access article distributed under the terms and
conditions of the Creative Commons Attribution (CC BY) license. Authors who
publish this series agree to the following terms:
1. Authors retain copyright and grant the series right of first publication with the work simultaneously licensed under a Creative Commons
Attribution License that allows others to share the work with an acknowledgment of the work's authorship and initial publication in this
series.
2. Authors are able to enter into separate, additional contractual arrangements for the non-exclusive distribution of the series's published
version of the work (e.g., post it to an institutional repository or publish it in a book), with an acknowledgment of its initial
publication in this series.
3. Authors are permitted and encouraged to post their work online (e.g., in institutional repositories or on their website) prior to and
during the submission process, as it can lead to productive exchanges, as well as earlier and greater citation of published work (See
Open access policy for details).
References
[1]. Gao, M., & Feng, Q. (2009). Modeling and forecasting of urban logistics demand based on support vector machine. In 2009 Second International Workshop on Knowledge Discovery and Data Mining (pp. 793-796). IEEE.
[2]. Yan, Y. (2011). Demand forecasting method in logistics management based on support vector machine. In 2011 International Conference on E-Business and E-Government (ICEE) (pp. 1-4). IEEE.
[3]. Li, H. Z., Guo, S., & Li, C. J. (2012). Fruit fly optimization and least squares support vector machine hybrid forecasting model: A case study of China's logistics demand forecasting. Economic Mathematics, 29(3), 103-106.
[4]. Zhang, H., & Xing, P. Z. (2012). Modeling and predictive simulation of regional logistics demand. Computer Simulation, 29(6), 351-354, 393.
[5]. Lü, Y. (2018). Research on regional logistics demand forecasting based on support vector machine. China Market, 2, 144-144.
[6]. Ma, Q., Sun, D., Shi, J., He, X., & Zhai, Y. (2020). Research on predicting the risk of tumor incidence in adults based on support vector machine and XGboost. Chinese General Practice, 23(12), 1486.
[7]. Sun, Z., Pan, J., Zhang, Z., Zhang, L., & Ding, Q. (2009). Traffic flow prediction based on the combination of principal component analysis and support vector machine. Journal of Highway and Transportation Research and Development (English Edition), 26(5), 127-131.
[8]. Liang, Y., & Xu, C. F. (2024). Modeling and predictive simulation of regional logistics demand based on SVM: A case study of Zhejiang Province. Logistics Research, 3, 54-60.
[9]. Yu, K. L. (2022). Research on regional logistics demand forecasting based on support vector machine. China Economic and Trade Herald, 5, 85-87.