


1. Introduction
Tesla is the world’s largest new energy vehicle company. From the perspective of business modules, Tesla’s revenue mainly comes from five aspects: car sales, car leasing, policy subsidie, energy production and storage, services and others. At present, new energy vehicles are the development trend of the automobile industry, facing the deteriorating global environment. Moreover, through the recent US presidential election, the value of Tesla’s stock has become a major focus for investors due to Elon Reeve Musk’s big bet on the former president Donald Trump’s candidacy.
The influence of macroeconomic and political policies on Tesla is enormous. The financial crisis of 2008 and Tesla’s refusal to list its shares was certainly a huge shock to Tesla, which further led to financial problems. Tesla has since recovered from the crisis by taking strict cost-cutting measures and increasing marketing initiatives. However, it is worth noting that Tesla’s car deliveries did not drop significantly during the COVID-19. After the announcement of the US new presidential election, Tesla stock price reached a 14.5%rise since the last market close.
In tradition, researchers often adopt fundamental and technical techniques to conduct the stock analysis. The fundamental analysis evaluates a company’s stock by examining its intrinsic value (Financial Analysis), including tangible assets, financial statements, management effectiveness; essentially all the basics of a company. It relies on both historical and present data to measure revenues, assets, costs, liabilities, and so on. La Porta, Shleifer, and Vishny provide evidence in support of the value investing strategy, which relies heavily on fundamental analysis. [1]. The authors argue that stocks with low price-to-book ratios tend to outperform growth stocks, suggesting that fundamental indicators are valuable in identifying undervalued stocks. Piotroski introduces the Piotroski FScore for evaluating the financial health of companies[2]. The F-Score focuses on a set of fundamental indicators that can help investors identify companies with strong growth potential and low risk of financial distress. On the other hand, due to the efficient market hypothesis which claims that stock movements are not a stochastic process but reveal repeated patterns over time, the technical analysis study prices movements through analyzing historical data, such as the moving average. Lo, Mamaysky, and Wang offer a detailed exploration of technical analysis from a computational and statistical perspective, touching upon how technical indicators are combined with fundamental factors for stock price forecasting[3].
Businesses in the finance sector increasingly rely on data-driven decision-making. As the field of machine learning evolves, there will be new opportunities to apply machine learning skills in the finance sector.
This research highlights the promising results of specific machine learning methods for time-series forecasting in the case of Tesla. Here, this paper will primarily construct machine learning models and the deep learning machines to forecast the Tesla stock price and volatility from the past historical data, also, compare ML-based approaches and traditional ones in order to discuss which method could be more effective considering the arbitrage opportunity in Tesla.
2. Literature Review
Fama postulates the efficient market hypothesis, which states that the current price of an asset swiftly reflects all prior available information[4]. Additionally, the random walk hypothesis asserts that a stock price changes independently of its historical prices[5]. These two hypotheses indicate that reliable methods for predicting stock prices do not exist.
Later, Elman proposed a Recurrent Neural Network (RNN)[6]. The Long Short-Term Memory (LSTM) algorithm, introduced by Hochreiter and Schmidhuber, aims to enhance performance by addressing the gradient vanishing problem that recurrent networks face when dealing with long sequences of data. Huang and Yang explore the utilization of machine learning models, particularly support vector machines (SVM), for forecasting stock price volatility, and compare traditional econometric models with machine learning approaches, demonstrating the effectiveness of the latter in predicting volatility more precisely.[7]. Krauss and Huck investigate application of deep neural networks (DNNs), gradient-boosted trees, and random forests in predicting stock price movements and volatility [8]. The authors find that deep learning models can provide better results for forecasting compared to traditional models. Dai adopted the Random Forest model to forecast the Tesla stock price compared to linear regression, which demonstrates that the linear regression outperforms well[9]. A previous study has also tested the LSTM accuracy in predicting the trend in the stock market[10]; Rigamonti investigates that the machine learning model shows predictive power and that its performance greatly increases when feature selection is performed[11].
3. Data
This paper collects the Tesla data from Wind, the dataset includes 14 years of data from 2010/06/07-2024/09/01 containing 9 features: open, high, low volume, GDP, unemployment rate, Musk’s Twitter retweets, Twitter comments, US presidential election votes as shown in Table 2, and over 30 thousand instances. The dataset is split into both training and testing samples as shown in Table 1 and set The sliding window is 10 days. Then, this paper merges the dataset to fill the gap and scale the target data. Target data are primarily Tesla daily stock close price, and its daily realized volatility as shown in equation 1.
Table 1: Data Splitting
Dataset | Training Dataset | Testing Dataset |
2010/06/07-2024/08/23 | 2016/06/07-2024/12/31 | 2024/01/01-2024/09/01 |
Table 2: Input Variables
Technical and Macroeconomic Indicators | Political Indicators |
Open/High/Low/Volume | Musk’s Twitter retweets/comments |
GDP/Unemployment Rate | Election Votes |
According to Hansen and Lunde (2005), the realized Volatility is:
\( R{V_{t}}=\frac{{N^{-1}}\sum _{t=1}^{N}R_{t}^{2}}{{N^{-1}}\sum _{t=1}^{N}R{V_{t}}}\sum _{d=1}^{n}R_{t,d}^{2} \) (1)
4. Models and Methodology
Enlightened by previous studies, the supervised models appear to be massively adopted in stock forecasting. In this study, the Lasso, Random Forest and XgBoost models come into use. Besides, this paper adopts Recurrent Neural Network and Long Short-Term Memory to further capture the shocks in volatility. Last, this research combines the Geometric Brownian Motion with the Heston model to relatively test the stochastic process of Tesla stock close price and realized volatility.
4.1. Supervised Models
LASSO model:
\( L(ω)={||Xω-Y||^{2}}+α\sum _{j=0}^{m}|{ω_{j}}| \) (2)
\( ω={({X^{T}}X)^{-1}}({X^{T}}Y-\frac{α}{2}C) \) (3)
Lasso improves the OLS regression by adding the L1 regularization term, here, the X and Y are relatively our input variables and target features as previously stated. ch features could be input to this model.
Random Forest-Bagging:
\( f(x)=\frac{1}{M}\sum _{m=1}^{M}{f_{m}}(x) \) (4)
This model draws random sample and features from the assigned forest based on our parameters.
XgBoost model:
\( Ob{j^{(t)}}=\sum _{i=1}^{n}L({y_{i}},{y^{(t)}})+\sum _{i=1}^{t}ω({f_{i}}) \) (5)
\( =\sum _{i=1}^{n}(L({y_{i}},{y^{(t-1)}})+{f_{t}}({x_{i}}))+\sum _{i=1}^{t}ω({f_{i}}) \)
\( =\sum _{i=1}^{n}(L({y_{i}},{y^{(t-1)}})+{f_{t}}({x_{i}}))+\sum _{i=1}^{t}ω({f_{i}})+C \) (6)
As an optimized gradient boosting model, here the grid search is utilized to optimize hyper parameters for better model performance.
4.2. Deep-learning Models
Recurrent Neural Network:
\( {a^{(0)}}=0 \)
\( {a^{(1)}}={g_{1}}({W_{aa}}{a^{(0)}}+{W_{ax}}{X^{(1)}}+{b_{a}}) \)
\( ⋮ \)
\( {a^{(t)}}={g_{t}}({W_{aa}}{a^{(t)}}+{W_{ax}}{X^{(t)}}+{b_{a}}) \)
\( {y^{(t)}}={g_{t}}({W_{ya}}{a^{(t)}}+{b^{y}}) \) (7)
After integrating the parameter matrices, the equation
concludes to:
\( [{a^{(t-1)}},{x^{(t)}}]=[{W_{aa}},{W_{ax}}][\begin{matrix}{a^{(t-1)}} \\ {x^{(t)}} \\ \end{matrix}] \) (8)
Long Short-Term Memory:
\( {c^{(t)}}=tanh{({W_{c}}[{a^{(t-1)}},{x^{(t)}}]+{b_{c}})} \) (9)
\( {g_{u}}=σ({W_{u}}[{a^{(t-1)}},{x^{(t)}}]+{b_{u}}) \) (10)
\( {g_{f}}=σ({W_{f}}[{a^{(t-1)}},{x^{(t)}}]+{b_{f}}) \) (11)
\( {c^{(t)}}={g_{u}}\cdot c_{c}^{(t)}+{g_{f}}\cdot {c^{(t-1)}} \) (12)
4.3. Traditional Mathematical Models
Geometric Brownian Motion: the principle of GBM satisfies the standard differential equation,
\( d{S_{t}}=μ{S_{t}}dt+σ{S_{t}}d{W_{t}} \) (13)
Applying Itô's Calculus,
\( d(ln{{S_{t}}})={(ln{{S_{t}}})^{ \prime }}d{S_{t}}+\frac{1}{2}{(ln{{S_{t}}})^{ \prime \prime }}d{S_{t}} \) (14)
\( ln{\frac{{S_{t}}}{{S_{0}}}}=(μ-\frac{{σ^{2}}}{2})t+σ{W_{t}} \) (15)
To improve the precision of stochastic volatility forecasting, the Heston Model is introduced to GBM:
\( d\sqrt[]{{σ_{t}}}=-θ\sqrt[]{{σ_{t}}}dt+δdW_{t}^{σ} \) (16)
\( (W_{T}^{s}) \) and \( (W_{t}^{σ}) \) are correlated with \( (ρ) \) .
5. Result and Analysis
To Forecast the Tesla stock price and realized volatility, first, this project conducts a basic descriptive analysis and an auto-correlation test.
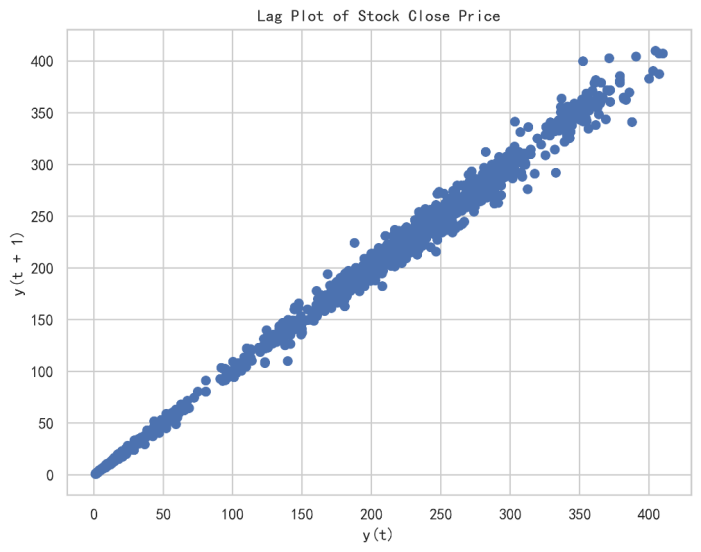
Figure 1: lag plot
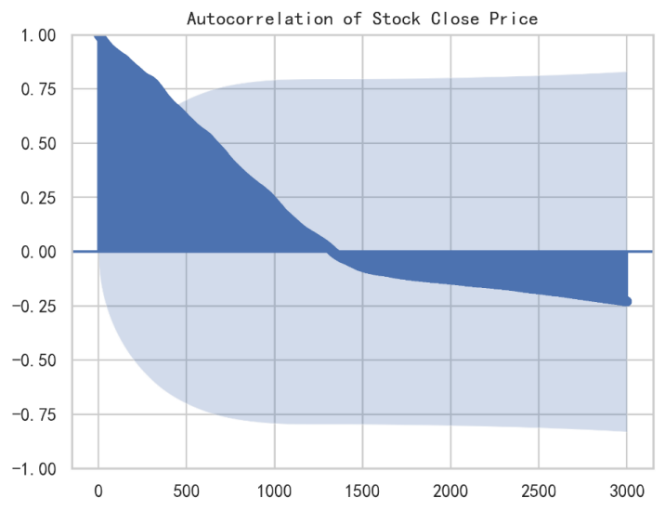
Figure 2: auto correlation plot
From the graphs below, the result demonstrates that the historical Tesla stock close price is highly autocorrelated which do not follow the stochastic process. The residual shows high volatility after COVID-19 and 2024 US presidential election; and the stock return follows standard normal distribution.
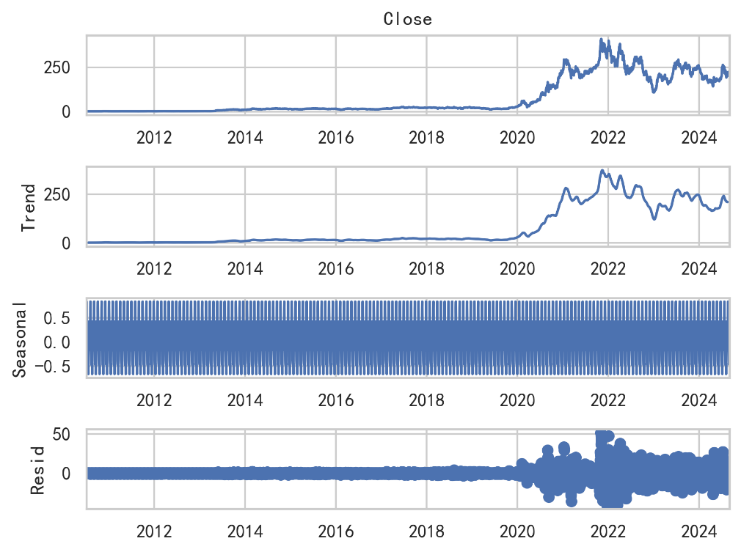
Figure 3: decomposition plot FIG
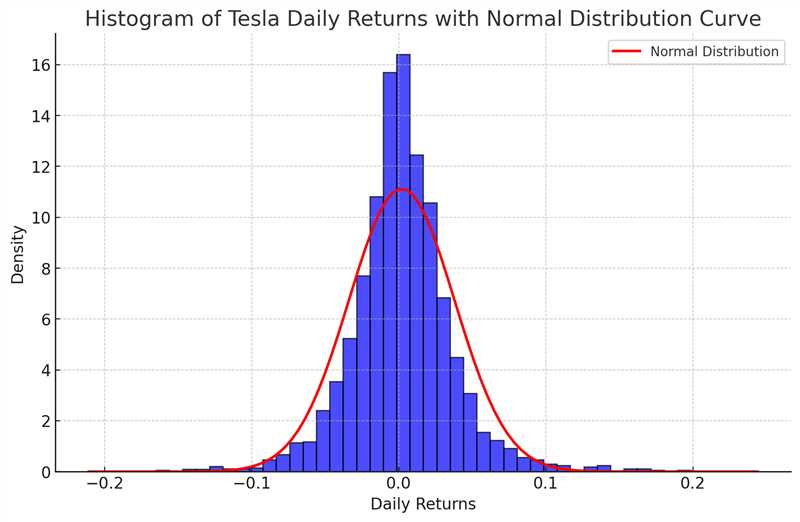
Figure 4: histogram of Tesla daily return
The forecasting findings on testing samples indicate that both supervised models and deep learning methods generally align well with stock prices. LSTM and RNN models reflect higher residuals in volatility forecasting. Lasso, RF and XGboost model couldn’t capture the shocks and jumps in volatility.
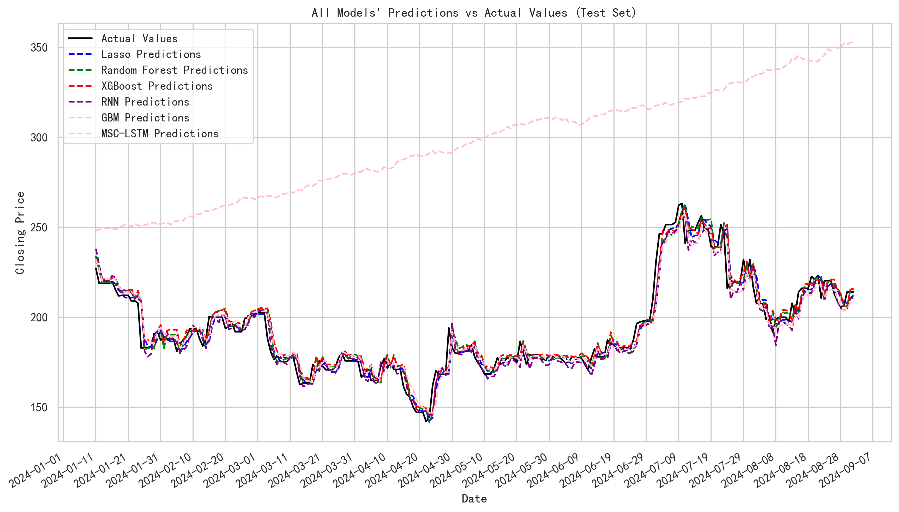
Figure 5: Models prediction on close price
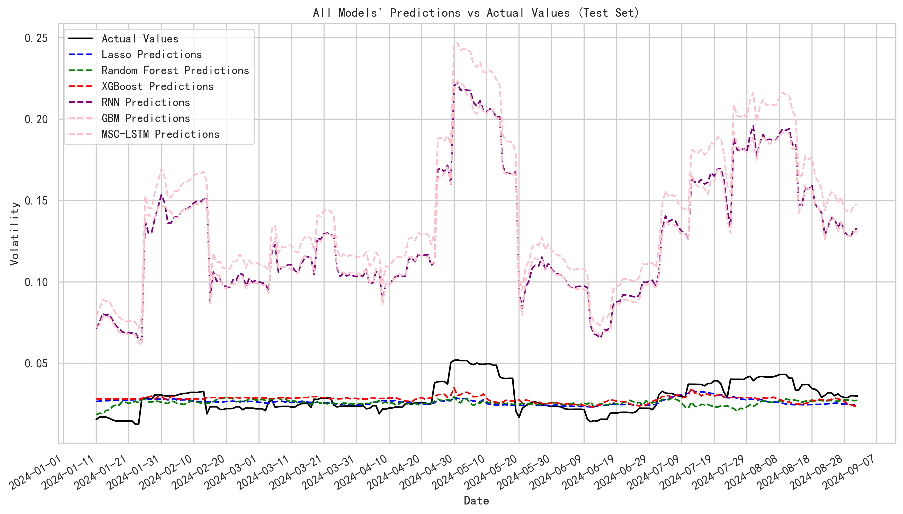
Figure 6: Models prediction on volatility
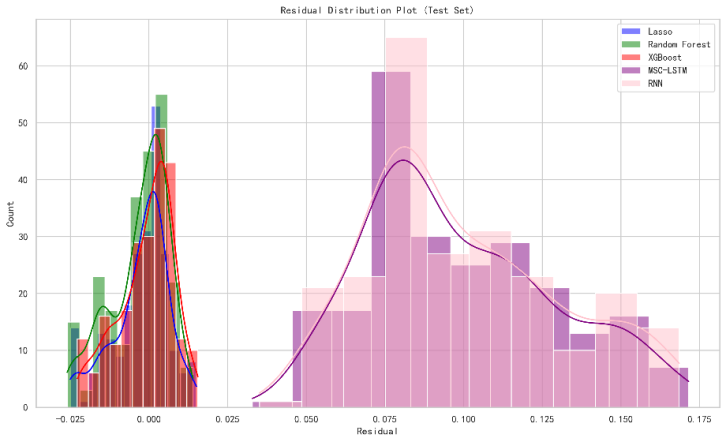
Figure 7: residual distribution on testing sample
In contrast, the Geometric Brownian Motion based on Monte Carlo simulations in which this project simulates 100 paths tends to overestimate the predicted stock price, which shows poor goodness of fit on the stock price. Despite introducing Heston model on realized volatility forecasting, the volatility reverts to its mean and reflects no fluctuation as shown in figure 9.
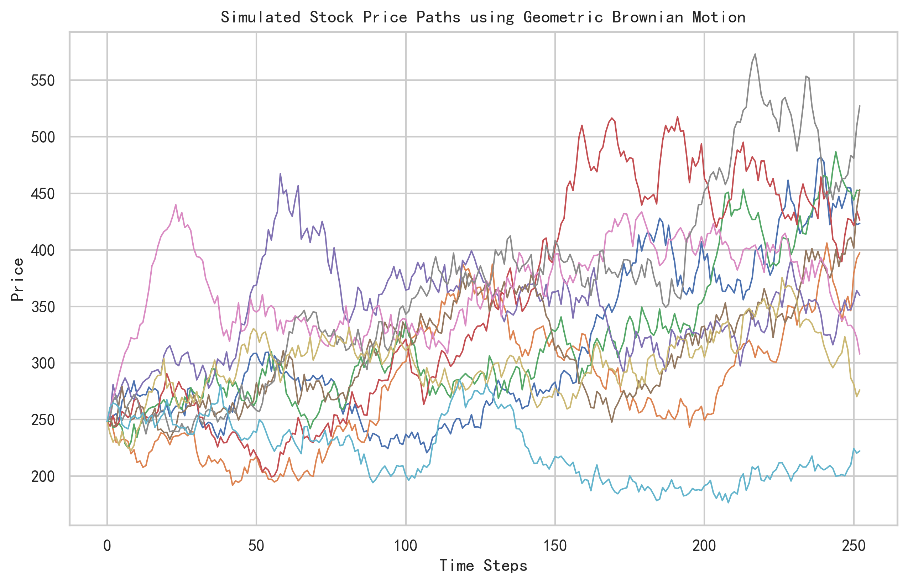
Figure 8: GBM simulation paths
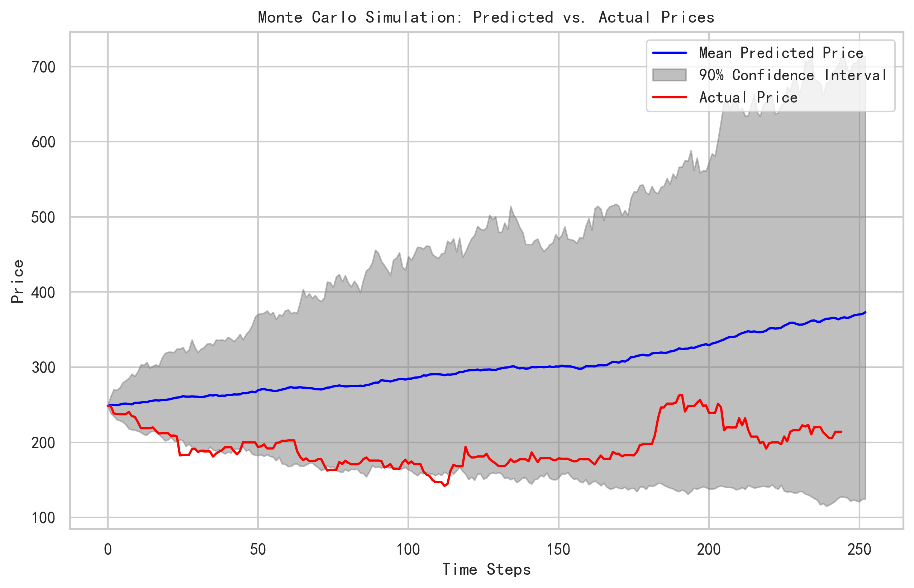
Figure 9: GBM prediction vs actual price
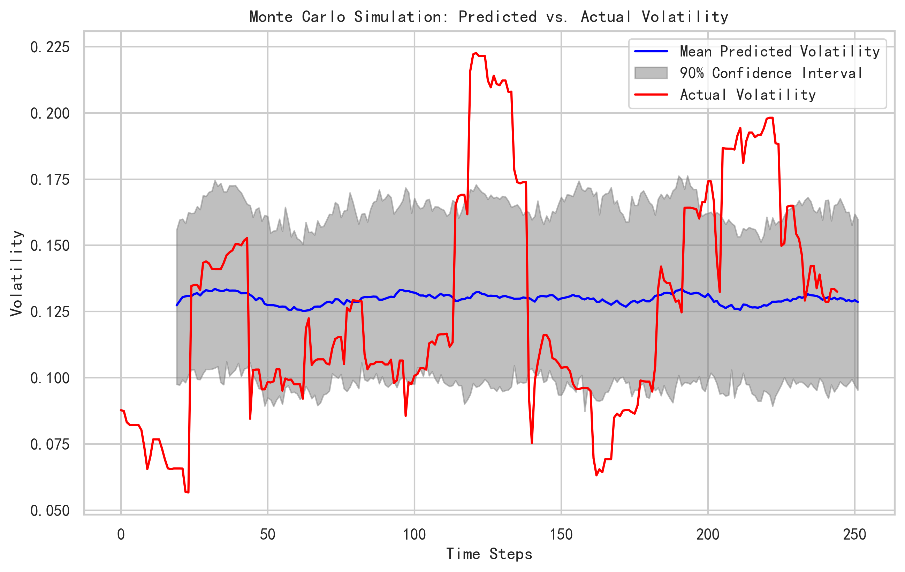
Figure 10: GBM prediction on volatility vs actual price
Table 3: Model Evaluation Metrics on Stock Price
Model | MAE | MSE | RMSE | R square |
Lasso | 4.15 | 41.08 | 6.41 | 0.94 |
Random Forest | 4.43 | 42.35 | 6.51 | 0.93 |
XGBoost | 4.61 | 43.39 | 6.59 | 0.93 |
MSC-LSTM | 4.81 | 46.17 | 6.8 | 0.927 |
RNN | 4.58 | 43.43 | 6.6 | 0.93 |
Table 4: Evaluation Metrics on Volatility
Model | MAE | MSE | RMSE | R square |
Lasso | 0.006 | 0.000086 | 0.0095 | 0.02 |
Random Forest | 0.0073 | 0.000096 | 0.0098 | -0.10 |
XGBoost | 0.007 | 0.000078 | 0.0088 | 0.107 |
MSC-LSTM | 0.098 | 0.010 | 0.103 | -121 |
RNN | 0.099 | 0.010 | 0.104 | -123 |
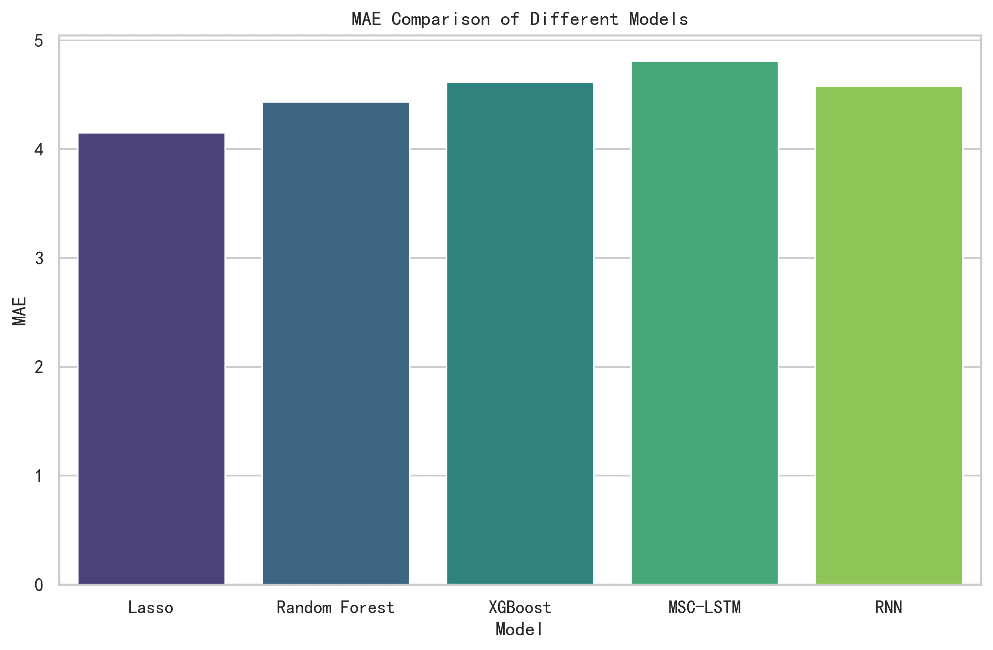
Figure 11: MAE comparison of machine and deep learning models
6. Evaluation
Based on Evaluation metrics on close price fore- casting the results support that the Lasso model performs the best due to the smallest residuals in each metrics. The R square of LSTM indicates the slightest error compared to other model. In terms of forecasting realized volatility, all models demonstrate underfit-ting since they are not capable of capturing the short-term shocks and jumps driven by events and news.
7. Conclusion and Future Outlook
In conclusion, the Lasso model achieves the best goodness of fit. To improve the fitness of Deep Learning models, this paper can introduce a new scale parameter to adapt the realized volatility which can be digged further in my future research.
\( RV_{t}^{*}=λ_{0}^{*}RV_{t}^{*} \)
\( {λ^{0}}=\frac{{N^{-1\sum _{t=1}^{N}R_{t}^{2}}}}{{N^{-1\sum _{t=1}^{N}R{V_{t}}}}} \) (17)
Also, future research could incorporate the Jump diffusion model in volatility forecasting to effectively capture the fluctuations in the stochastic process of the stock price. Moreover, the features applied in the models are far from sufficient. Any more unstructured data, such as text, audio, and images about Tesla and the company's events, could demonstrate the feasibility of analytical applications on the stock price.
References
[1]. La Porta, R., Lakonishok, J., Shleifer, A., Vishny, R. W. (1997). Good news for value stocks: Further evidence on market efficiency. The Journal of Finance, 52(2), 859-874. https://doi.org/10.1111/j.1540-6261.1997.tb04864.x
[2]. Piotroski, J. D. (2000). Value investing: The use of historical financial statement information to separate winners from losers.Journal of Accounting Research, 38(1), 1-41.
[3]. Lo, A. W., Mamaysky, H., Wang, J. (2000). Foundations of technical analysis: Computational algorithms, statistical inference, and empirical implementation. The Journal of Finance, 55(4), 1705-1765. https://doi.org/10.1111/0022-1082.00266
[4]. Fama EF (1970) Efficient Capital Markets: A Review of Theory and Empirical Work. J Financ 25(2):383–417. https://doi.org/10.2307/2325486
[5]. Burton, N (2018) An Analysis of Burton G. Malkiel’s A Random Walk Down Wall Street, 1st edition, ISBN 9781912128822, Routledge. Available at https://www. routledge.com/An-Analysis-of-Burton-G-Malkiels-ARandom-Walk-Down Wall-Street/Burton/p/book/9781912128822, accessed on 30th Oct, 2023
[6]. Elman JL (1990) Finding structures in time. Cogn Sci 14(2):179–211
[7]. Huang, X., & Yang, Y. (2018). Stock price volatility forecasting with machine learning techniques. Journal of Applied Economics, 51(1), 67–82.
[8]. Krauss, C., Do, X. A., & Huck, N. (2017). Deep neural networks, gradient-boosted trees, random forests: Statistical arbitrage on the S&P 500. European Journal of Operational Research, 259(2), 689-702. https://doi.org/10.1016/j.ejor.2016.11.055
[9]. Dai Silong (2023) Proceedings of the 2nd International Conference on Financial Technology and Business Analysis. DOI: 10.54254/2754-1169/45/20230263
[10]. Lai, CY, Chen, RC, & Caraka, RE (2019) Prediction Stock Price Based on Different Index Factors Using LSTM. 2019 International Conference on Machine Learning and Cybernetics (ICMLC), 1-6
[11]. Andrea Rigamonti (2024) “Can machine learning make technical analysis work?,” Financial Markets and Portfolio Management, Springer; Swiss Society for Financial Market Research, vol. 38(3), pages 399-412, September.
Cite this article
Yin,S. (2025). Application of Machine Learning and Deep Learning Algorithms on Stock Price Forecasting - The Case of Tesla. Advances in Economics, Management and Political Sciences,151,37-45.
Data availability
The datasets used and/or analyzed during the current study will be available from the authors upon reasonable request.
Disclaimer/Publisher's Note
The statements, opinions and data contained in all publications are solely those of the individual author(s) and contributor(s) and not of EWA Publishing and/or the editor(s). EWA Publishing and/or the editor(s) disclaim responsibility for any injury to people or property resulting from any ideas, methods, instructions or products referred to in the content.
About volume
Volume title: Proceedings of the 3rd International Conference on Financial Technology and Business Analysis
© 2024 by the author(s). Licensee EWA Publishing, Oxford, UK. This article is an open access article distributed under the terms and
conditions of the Creative Commons Attribution (CC BY) license. Authors who
publish this series agree to the following terms:
1. Authors retain copyright and grant the series right of first publication with the work simultaneously licensed under a Creative Commons
Attribution License that allows others to share the work with an acknowledgment of the work's authorship and initial publication in this
series.
2. Authors are able to enter into separate, additional contractual arrangements for the non-exclusive distribution of the series's published
version of the work (e.g., post it to an institutional repository or publish it in a book), with an acknowledgment of its initial
publication in this series.
3. Authors are permitted and encouraged to post their work online (e.g., in institutional repositories or on their website) prior to and
during the submission process, as it can lead to productive exchanges, as well as earlier and greater citation of published work (See
Open access policy for details).
References
[1]. La Porta, R., Lakonishok, J., Shleifer, A., Vishny, R. W. (1997). Good news for value stocks: Further evidence on market efficiency. The Journal of Finance, 52(2), 859-874. https://doi.org/10.1111/j.1540-6261.1997.tb04864.x
[2]. Piotroski, J. D. (2000). Value investing: The use of historical financial statement information to separate winners from losers.Journal of Accounting Research, 38(1), 1-41.
[3]. Lo, A. W., Mamaysky, H., Wang, J. (2000). Foundations of technical analysis: Computational algorithms, statistical inference, and empirical implementation. The Journal of Finance, 55(4), 1705-1765. https://doi.org/10.1111/0022-1082.00266
[4]. Fama EF (1970) Efficient Capital Markets: A Review of Theory and Empirical Work. J Financ 25(2):383–417. https://doi.org/10.2307/2325486
[5]. Burton, N (2018) An Analysis of Burton G. Malkiel’s A Random Walk Down Wall Street, 1st edition, ISBN 9781912128822, Routledge. Available at https://www. routledge.com/An-Analysis-of-Burton-G-Malkiels-ARandom-Walk-Down Wall-Street/Burton/p/book/9781912128822, accessed on 30th Oct, 2023
[6]. Elman JL (1990) Finding structures in time. Cogn Sci 14(2):179–211
[7]. Huang, X., & Yang, Y. (2018). Stock price volatility forecasting with machine learning techniques. Journal of Applied Economics, 51(1), 67–82.
[8]. Krauss, C., Do, X. A., & Huck, N. (2017). Deep neural networks, gradient-boosted trees, random forests: Statistical arbitrage on the S&P 500. European Journal of Operational Research, 259(2), 689-702. https://doi.org/10.1016/j.ejor.2016.11.055
[9]. Dai Silong (2023) Proceedings of the 2nd International Conference on Financial Technology and Business Analysis. DOI: 10.54254/2754-1169/45/20230263
[10]. Lai, CY, Chen, RC, & Caraka, RE (2019) Prediction Stock Price Based on Different Index Factors Using LSTM. 2019 International Conference on Machine Learning and Cybernetics (ICMLC), 1-6
[11]. Andrea Rigamonti (2024) “Can machine learning make technical analysis work?,” Financial Markets and Portfolio Management, Springer; Swiss Society for Financial Market Research, vol. 38(3), pages 399-412, September.