


1. Introduction
Businesses need to identify their customers. By putting forward that firms are under mounting pressure from competition to work out innovative marketing strategies to fulfill customer demands and improve customer retention and loyalty, Liu and Shih back up this claim [1]. Canning contends that providing more to everyone is no longer a good way to make sales and that the market is still An agenda that prioritizes the most efficient use of marketing is necessary to become more competitive[2]. Customer retention boosts profitability, according to Verbeke. Numerous cutthroat businesses have realized that keeping current clients is a crucial tactic for industry survival. According to Verbeke, profitability rises with customer retention. Numerous cutthroat businesses have realized that keeping current clients is a crucial tactic for industry survival [3].
Retaining valuable customers and reducing customer attrition are the goals of customer churn management, which increases revenue. According to the 80/20 rule, 20% of consumers generate 80% of total revenue. Global bank officials have already acknowledged the significance of raising client satisfaction. Customers' adoption of new technology is a truth. Their demands and expectations for banking services rise in other spheres of their lives. as well. The 2019 World Retail Banking Report shows that 66.8% of existing bank customers have already made use of or are intending to make use of a bank account from a non-traditional organization (big tech or fintech) within the subsequent three years [4]. A PwC study shows that 55% of bank executives consider these non-traditional financial sector rivals as a threat to conventional banks [5]. This shifting competitive environment has made it progressively more difficult for traditional banks to retain their existing customer base.
According to Nie, a bank has the potential to enhance its profits by as much as 85% through increasing the customer retention rate by up to 5%. Moreover, it is currently regarded as being more critical than ever to retain customers [6].
To construct a customer churn prediction model, this survey endeavors to identify the common characteristics of customers who have churned. The objective of this study is to develop a system that employs machine-learning approaches for predicting client attrition within the banking industry.
2. Data and methodology
2.1. Data Description
The customer data of account holders in Anonymous Multinational Bank is exploited for the purpose of predicting Customer Churn. The target variable is "Exited", which is binary in nature - taking the value of 1 if the customer departs and 0 otherwise. In addition, there are numerous features included, such as gender, age, location, credit score, estimated salary, and so on. The dataset consists of 10,000 rows and 18 columns, which are sourced from Kaggle.
2.2. Exploratory Data Analysis (EDA)
2.2.1. Data Visualization
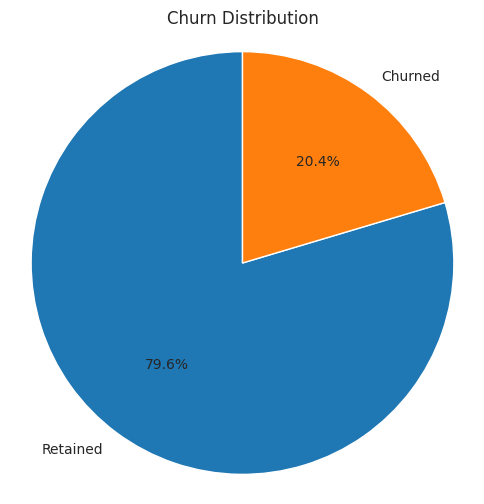
Figure 1: Churn Distribution (Original)
In Figure 1, 20% of customers are exiting the bank. It is a significant number for any organization Churn as Target Variable
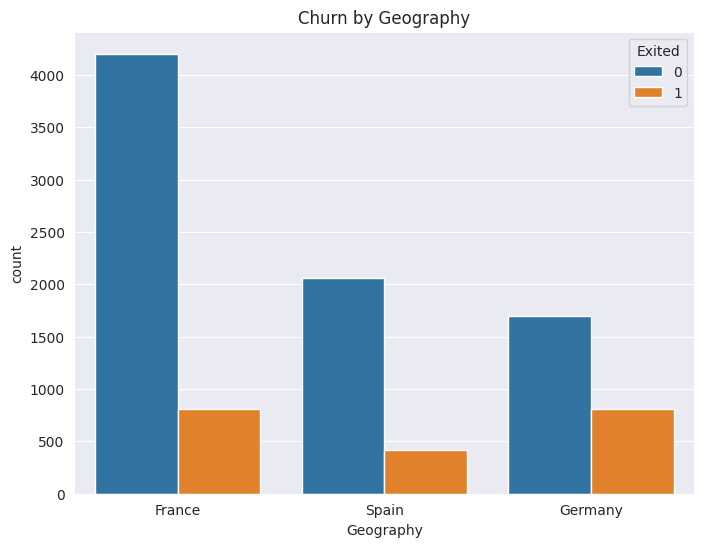
Figure 2: Churn by geography (Original)
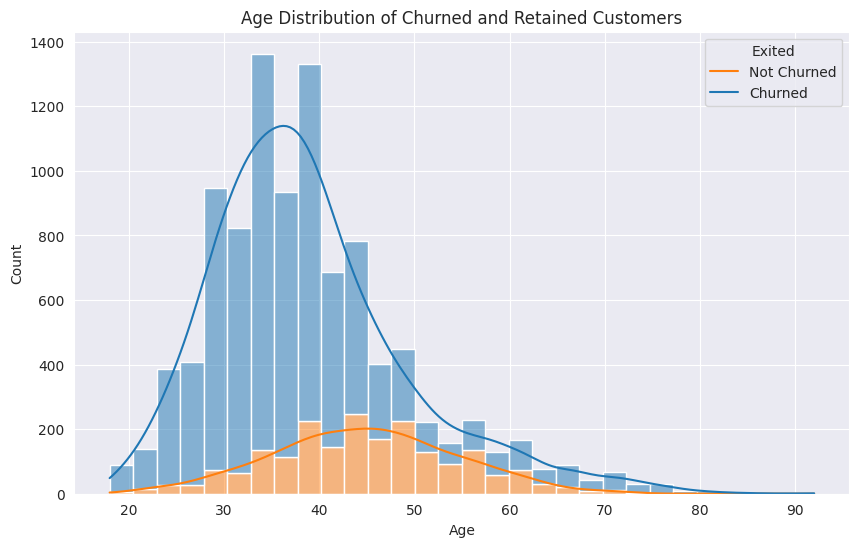
Figure 3: Age Distribution of churned and Retained Customers (Original)
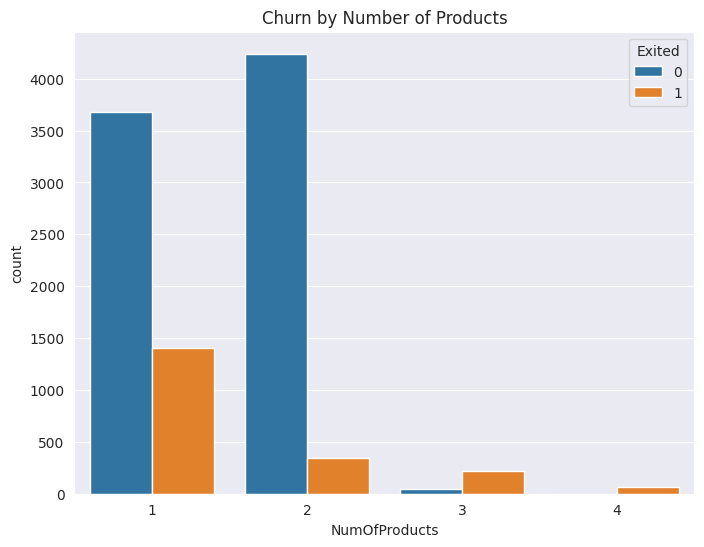
Figure 4: Churn by Number of Products (Original)
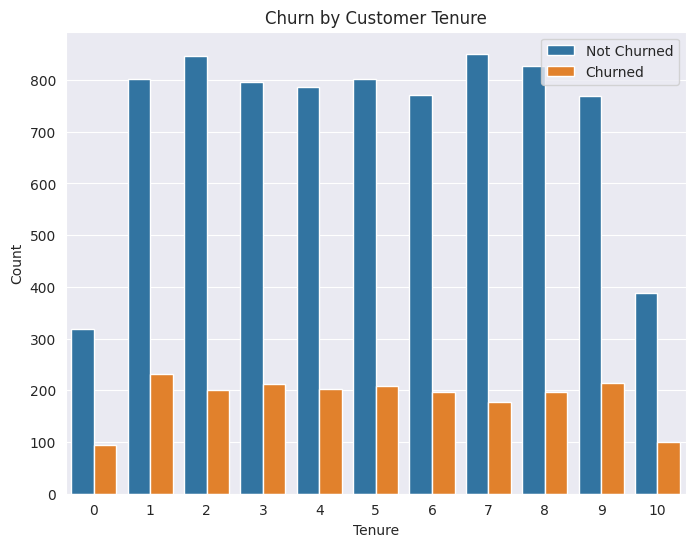
Figure 5: Churn by Customer Tenure (Original)
2.2.2. Churn vs Features
As depicted in Figure 2, among the various countries, Germany exhibits the highest churn rate, reaching 32.44%. Spain follows with a churn rate of 16.67%, and France comes next with a rate of 16.17%. In Figure 3, it can be observed that the majority of customers who leave are within the 50 - 60 age range, presenting a churn rate of 56.21%. Subsequently, the 40 - 50 age group has a corresponding churn rate of 33.96%. In Figure 4, it is interesting to note that customers possessing a higher number of products are more prone to churning. Customers who have bought 3 products have a churn rate of 83% while those who bought only one product have a churn rate of 28%. In Figure 5, Even loyal customers with ten years of association have a churn rate of 20%. Customers below the one-year mark have a churn rate of 23%.
2.3. Data Preprocessing
The descriptions of predictors after preprocessing are presented in Table Ⅱ. These attributes are the ones adopted for making decisions regarding churn prediction within this study. Drop 'Row Number', 'Customer Id', and 'Surname' as they are irrelevant to the churn outcome. There are no null or missing values in the data set, the data types seem consistent with expectations, the Balance and Salary columns have a lot of variation which requires feature scaling, and the Age Group column should be dropped as it was only for data visualization.
2.4. Feature Engineering
(A) Correlation Matrix
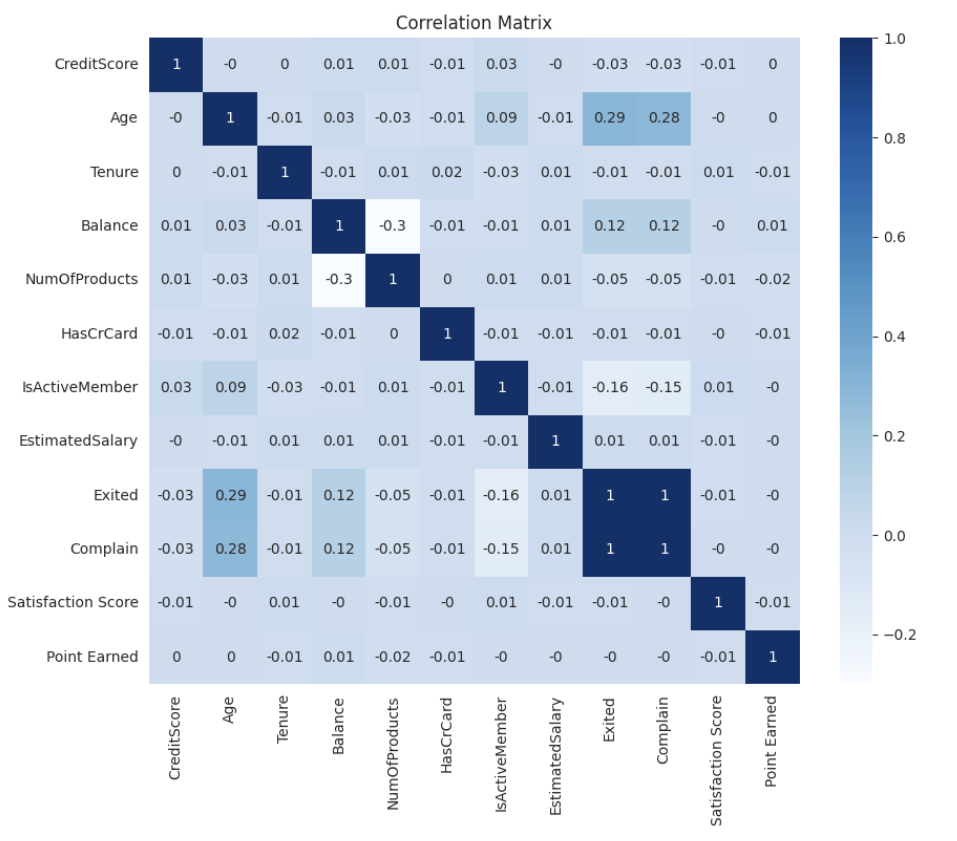
Figure 6: Correlation Matrix (Original)
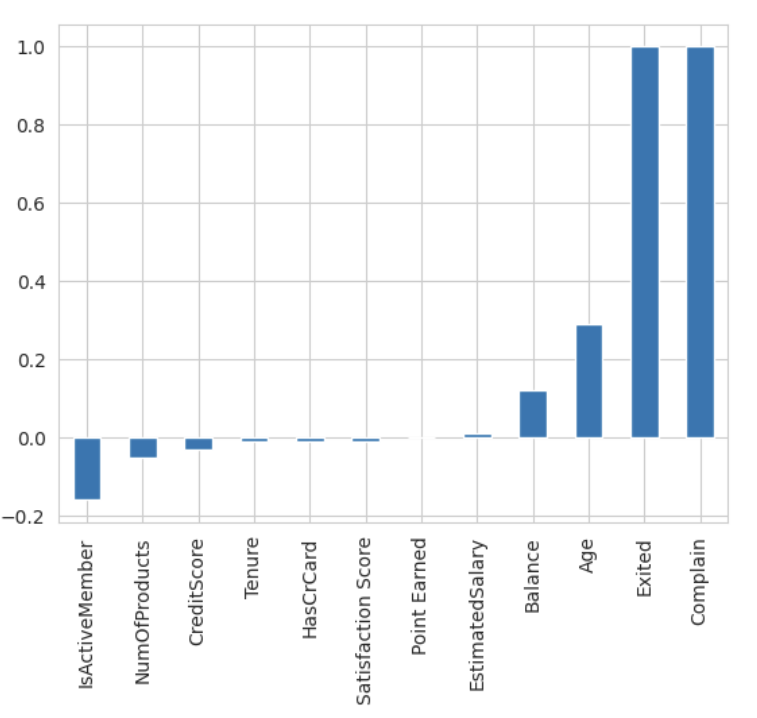
Figure 7: Feature Correlation Coefficient Value (Original)
The following conclusions can be drawn from Figure 6 and Figure 7, the three important features impacting churn rate in the positive direction are balance, age, and complaint. Member status, number of products, and credit score are negatively correlated with exit. Exited & Complain have a 100% correlation or perfect correlation with each other. We will drop Complain from the model.
(B) One-hot encoding
One-Hot Encoding is a data preprocessing technique mainly used for handling categorical variables. For a categorical variable with distinct categories, one-hot encoding will create new binary (0 or 1) features. Each new feature represents one category. This set of data needs to create dummies for gender, geography, and card type.
(C) Feature Scaling
This represents a preprocessing technique aimed at standardizing the independent features within a fixed range. The purpose of this is to deal with the significant variations in magnitudes, values, or units present in the data.
When a machine learning algorithm is employed without feature scaling, it usually assigns greater importance to larger values and less importance to smaller values, irrespective of the unit of those values. Such a situation has an impact on the learning process of the model. The MinMaxScaler scales the numeric features in a range of (0,1)
2.5. Data up-sampling using SMOTE
The random oversampling technique serves as the foundation for this enhanced system. The issue of model overfitting, or making the data the model learns too specific and insufficiently general, is easily caused by random oversampling, which uses the straightforward technique of copying samples to increase the amount of minority class samples. The SMOTE algorithm's fundamental concept is to examine minority class examples, create new samples artificially based on those samples, and then add them to the data set. The innovative approach expands the number of features available to each class and makes the samples more generalized. To increase the proportion of minority cases, namely those of non-attrited customers, to twice that of the majority cases, the SMOTE is adopted.
2.6. Model Building and Evaluation
(A) Train Test Split
Let's split the data in the 80-20 ratio where 80% of the data will be used to train the model.
(B) Classification
Logistic Regression (LR)
LR is a linear regression problem where the target/dependent variable has a binary output. This target variable is regressed on a set of independent features similar to a linear regression. Bishop discusses the probabilistic interpretation of logistic regression as a major advantage. Logistic regression models the probability of a binary outcome, which is valuable in many fields such as finance (predicting default or non-default of a loan), and marketing (predicting whether a customer will make a purchase or not) [7].
Random Forest (RF): RF was proposed by Breiman as an ensemble classification approach for trees [8]. This technique utilizes multiple DT, with each tree dependent on a uniquely selected random vector that shares the same distribution across all trees. This approach effectively addresses the tendency of DTs to overfit their training data. Essentially, RF is a method that combines numerous deep DTs, trained on different portions of the same dataset, to reduce variance. A significant advantage of RF is its ability to handle high-dimensional data without requiring dimensionality reduction or feature selection. Additionally, RF offers faster training speeds and is easily adaptable to parallel processing models.
Decision Tree (DT): The ID3 decision tree was initially put forward by Quinlan in 1986 [9]. It is prominently recognized for its simplicity as well as its effectiveness in dealing with classification problems. The algorithm adopts a top-down, greedy search method within the provided dataset for the construction of a decision tree. Moreover, decision trees are widely acknowledged for their interpretability [10]. The resultant tree structure enables users to readily understand and interpret the decision-making process. This characteristic is of particular significance in domains where transparency and explainability play a vital role, as it facilitates stakeholders in trusting and validating the outcomes more easily.
(C)Model Evaluation
Performance measure: Various widely recognized indicators derived from the confusion matrix can be utilized to assess the performance of classification models. These metrics consist of F1 score, recall, accuracy, and precision. These four measures are calculated using the confusion matrix as a basis.
(D) Accuracy
Accuracy is defined as the proportion of samples that are correctly classified with the total number of samples. It serves as one of the most intuitive metrics utilized for assessing the performance of a classification model. Accuracy applies to various classification problems, especially when the proportion of positive and negative samples is relatively balanced, it can well reflect the overall performance of the model.
3. Results and Discussions
The research is set to make use of 18 features that are acquired after the preprocessing stage. The dataset will be partitioned, with 80% of it being designated for the training process and the remaining 20% randomly assigned for testing purposes. Classifiers will be applied both on their own and in combination with the specified feature selection techniques. The performance of each model will be evaluated through accuracy scores derived from 10-fold cross-validation, and a random confusion matrix will be generated for every model. The effectiveness of the classifiers is expected to fluctuate based on the feature selection method applied. Subsequent paragraphs will detail the features chosen by each selection method and the specific parameters of the classifiers. For the Logistic Regression (LR) algorithm, an L1 regularization penalty term was incorporated into the experimental model analysis. This approach is beneficial when dealing with numerous data features and aiming to perform feature selection. Conversely, if model stability and overfitting prevention are prioritized, the L2 penalty term may be more suitable. Researchers can also compare the performance of models using both L1 and L2 penalties, making decisions based on evaluation metrics. The Decision Tree (DT) implementation employs the CART algorithm, while the Random Forest (RF) is configured with 100 trees. These parameter choices were made to optimize classification accuracy.
Table 1: Comparison of results for different models
Classifier | Accuracy | Accuracy After oversampling |
LR | 0.81 | 0.87 |
RF | 0.83 | 0.89 |
DT | 0.76 | 0.90 |
Table 1 showcases the outcomes of multiple classification techniques both in scenarios where oversampling is applied and where it is not (while feature selection is not incorporated). It shows that the accuracy of all three models has been significantly improved after oversampling, especially that of the DT model which has the largest increase in accuracy. Through the application of oversampling to resample the negative class samples (ensuring that the quantity of negative class samples becomes equal to that of the positive class), the issue of data imbalance can be effectively resolved. As a result, the accuracy of the two tree-based classifiers, specifically the Decision Tree DT and RF, is on the rise
The three important features impacting churn rate in the positive direction are balance, age, and complaint. Member status, number of products, and credit score are negatively correlated with exit.
In short, in this study, the RF and DT after oversampling can achieve higher accuracy than LR. After the feature ranking is completed, among the considered features, "Number Of Products" holds relatively high significance in this study.
In conclusion, individuals who possess a greater number of bank products, including mobile banking, internet banking, savings accounts, fixed deposits, and so on, are less prone to churn. Consequently, banks should direct their attention towards those customers who utilize fewer products.
4. Conclusion
Banks must ascertain the likelihood of client attrition as soon as feasible to handle this situation. Various organizations use various data or information to calculate the customer attrition rate.
The goal of this research is to develop the best model for early client attrition prediction in a bank. Only 10,000 samples of data were used in this investigation, and the data was wildly unbalanced. On the other hand, a real commercial bank would have a lot more data. According to the exploratory research, women 50 years of age and older, primarily in Germany, are the study's target population for reducing attrition. The LR, DT, and RF classifiers were examined under different conditions. After data oversampling, the prediction accuracies of the DT and RF models reached 89% and 90% respectively, which were higher than that of the LR model. Through feature engineering, it was found that balance, age, and complaints have a positive impact on the churn rate, while member status, the number of products, and credit score are negatively correlated with churn.
Explore more advanced machine learning algorithms and techniques, such as deep learning frameworks, and attempt to apply them to customer churn prediction to further improve the accuracy and generalization ability of the model. Conduct in-depth research on feature engineering. Besides the existing feature selection and processing methods, explore new feature extraction methods, mine more potentially valuable features, provide more abundant information for the model, and improve prediction performance.
Better apply the constructed customer churn prediction model to actual banking business scenarios, closely integrate it with the bank's customer relationship management system, take timely and effective customer retention measures according to the prediction results, and continuously optimize and adjust the model according to the actual application situation to make it better adapt to the changes in business development and customer needs.
References
[1]. Liu, D. R., & Shih, Y. Y. (2005). Integrating AHP and data mining for product recommendation based on customer lifetime value. Information & Management, 42(3), 387–400.
[2]. Canning, G. Jr. (1982). Do a value analysis of your customer base. Industrial Marketing Management, 11(2), 89–93.
[3]. Verbeke, W., Martens, D., Mues, C., & Baesens, B. (2011). Building comprehensible customer churn prediction models with advanced rule induction techniques. Expert Systems with Applications, 38(2), 2354–2364.
[4]. Capgemini. (2019). World retail banking report (last accessed on 03/28/2020). https://www.capgemini.com
[5]. PwC. (2014). Retail banking 2020: Evolution or revolution? (last accessed on 03/28/2020). https://www.pwc.com
[6]. Nie, G., Rowe, W., Zhang, L., Tian, Y., & Shi, Y. (2011). Credit card churn forecasting by logistic regression and decision tree. Expert Systems with Applications, 38(11), 15273–15285.
[7]. Bishop, C. M. (2006). Pattern recognition and machine learning (Vol. 1). Springer.
[8]. Breiman, L. (2001). Random forests. Machine Learning, 45(1), 5–32.
[9]. Quinlan, J. R. (1986). Induction of decision trees. Machine Learning, 1(1), 81–106.
[10]. Sagi, O., & Rokach, L. (2020). Explainable decision forest: Transforming a decision forest into an interpretable tree. Information Fusion, 61, 124–138.
Cite this article
Liu,Y. (2025). Bank Customer Churn Prediction Using Machine Learning. Advances in Economics, Management and Political Sciences,153,53-60.
Data availability
The datasets used and/or analyzed during the current study will be available from the authors upon reasonable request.
Disclaimer/Publisher's Note
The statements, opinions and data contained in all publications are solely those of the individual author(s) and contributor(s) and not of EWA Publishing and/or the editor(s). EWA Publishing and/or the editor(s) disclaim responsibility for any injury to people or property resulting from any ideas, methods, instructions or products referred to in the content.
About volume
Volume title: Proceedings of the 3rd International Conference on Financial Technology and Business Analysis
© 2024 by the author(s). Licensee EWA Publishing, Oxford, UK. This article is an open access article distributed under the terms and
conditions of the Creative Commons Attribution (CC BY) license. Authors who
publish this series agree to the following terms:
1. Authors retain copyright and grant the series right of first publication with the work simultaneously licensed under a Creative Commons
Attribution License that allows others to share the work with an acknowledgment of the work's authorship and initial publication in this
series.
2. Authors are able to enter into separate, additional contractual arrangements for the non-exclusive distribution of the series's published
version of the work (e.g., post it to an institutional repository or publish it in a book), with an acknowledgment of its initial
publication in this series.
3. Authors are permitted and encouraged to post their work online (e.g., in institutional repositories or on their website) prior to and
during the submission process, as it can lead to productive exchanges, as well as earlier and greater citation of published work (See
Open access policy for details).
References
[1]. Liu, D. R., & Shih, Y. Y. (2005). Integrating AHP and data mining for product recommendation based on customer lifetime value. Information & Management, 42(3), 387–400.
[2]. Canning, G. Jr. (1982). Do a value analysis of your customer base. Industrial Marketing Management, 11(2), 89–93.
[3]. Verbeke, W., Martens, D., Mues, C., & Baesens, B. (2011). Building comprehensible customer churn prediction models with advanced rule induction techniques. Expert Systems with Applications, 38(2), 2354–2364.
[4]. Capgemini. (2019). World retail banking report (last accessed on 03/28/2020). https://www.capgemini.com
[5]. PwC. (2014). Retail banking 2020: Evolution or revolution? (last accessed on 03/28/2020). https://www.pwc.com
[6]. Nie, G., Rowe, W., Zhang, L., Tian, Y., & Shi, Y. (2011). Credit card churn forecasting by logistic regression and decision tree. Expert Systems with Applications, 38(11), 15273–15285.
[7]. Bishop, C. M. (2006). Pattern recognition and machine learning (Vol. 1). Springer.
[8]. Breiman, L. (2001). Random forests. Machine Learning, 45(1), 5–32.
[9]. Quinlan, J. R. (1986). Induction of decision trees. Machine Learning, 1(1), 81–106.
[10]. Sagi, O., & Rokach, L. (2020). Explainable decision forest: Transforming a decision forest into an interpretable tree. Information Fusion, 61, 124–138.