


1. Introduction
Diamonds, known as the hardest material on Earth, are renowned for their unparalleled beauty and rarity, as well as their importance as an industrial material. The diamond market has garnered significant attention throughout history, with leading producers such as Australia, Congo, South Africa, and Russia. By 2021, global diamond output was projected to reach 116 million carats, while the total estimated global reserves stood at about 1.3 billion carats, and Russia holding the largest share of about 600 million carats [1]. These figures not only reflect the scale of the diamond market but also underscore its importance in the global economy.
The global diamond jewelry industry enjoys a vast and diverse consumer base, with worldwide sales of diamond jewelry reaching $86.5 billion in 2022 [2]. In the United States alone, the market was valued at nearly $48 billion [3]. Diamonds are among the most sought-after gemstones due to their unique optical properties, durability, and rarity. Despite their widespread use in both industrial and decorative contexts, diamond prices are not solely determined by their intrinsic characteristics but are also significantly influenced by market demand and consumer perceived value. The intricacy of these factors renders the task of predicting diamond prices particularly challenging. The Gemological Institute of America introduced the 4Cs standards for diamonds in the 1950s: Cut, Carat, Color, and Clarity, which remain the fundamental criteria for diamond valuation. The cut is considered the most critical attribute as it directly affects the diamond's light reflection. Blue Nile, a leading online diamond retailer, claims that cut has the greatest influence on a diamond’s brilliance, noting that even diamonds with excellent color and clarity can appear lackluster if poorly cut [4]. While the 4Cs standards provide a systematic method for evaluating diamonds, market prices are often influenced by more complex and varied factors. Traditionally, diamond prices are determined through expert judgement and subjective analysis, a process that is both labor-intensive and susceptible to bias. Additionally, the Rapaport price list, which is widely used in the industry as a pricing guide, tends to list prices above actual sale prices, creating challenges for buyers and investors trying to accurately gauge market prices [5, 6].
Against this backdrop, this study aims to develop a more scientific and objective diamond price prediction model by applying supervised machine learning techniques. These algorithms have significant advantages in handling complex data patterns and nonlinear relationships, allowing for the analysis of large historical datasets to capture key factors that impact diamond pricing and provide more accurate price predictions. This study employs various commonly used supervised machine learning models, such as decision tree, random forest regression, Extreme Gradient Boosting (XGBoost), multivariate linear regression, and multilayer perceptron. By comparing the predictive performance of these models, the study aims to pinpoint the most effective method for forecasting diamond prices. The data preparation process includes cleaning the dataset by addressing missing data, encoding categorical features, and removing outliers to maintain data integrity and consistency.
During this study, cross-validation was employed to evaluate the performance of each model, with Root Mean Square Error (RMSE) chosen as the primary measure of accuracy. The results indicated that the XGBoost model outperformed all other models, followed by random forest regression and gradient boosting tree regression. These findings emphasize the advantages of ensemble learning methods in handling complex, nonlinear data patterns. Modern statistical analysis has evolved through the incorporation of machine learning and deep learning algorithms, which have proven to be highly effective alternatives to traditional statistical models, particularly in managing high-dimensional, nonlinear datasets. The choice of machine learning methods for predicting diamond prices is therefore well-founded, as these methods hold significant promise in enhancing pricing accuracy.
Classical statistical models faced limitations in modeling complex nonlinear relationships, a challenge that was only overcome with advances in computational technology in the 1980s. The primary contribution of this research is the development of a more objective and accurate approach to diamond pricing by utilizing machine learning techniques. This has the potential to help buyers and investors make more informed decisions, while also offering more efficient pricing strategies for the jewelry industry. Accurate prediction models can help reduce market volatility, increase transparency, and build greater confidence among consumers and investors. Additionally, this research highlights the increasing potential of machine learning in handling and interpreting complex datasets. As data volumes increase and algorithms continue to improve, machine learning is poised to see broader and deeper applications across various fields. Future research can focus on optimizing data processing and feature engineering to uncover additional factors that influence diamond pricing, further enhancing predictive accuracy. Overall, this research presents a systematic comparison of supervised learning algorithms, offering both scientific insights and practical recommendations for diamond price prediction, while promoting innovation and supporting development within the jewelry industry.
2. Literature Review
Alsuraihi et al. [7] conducted a study with the objective of creating an algorithm capable of accurately predicting diamond prices by considering various diamond sizes and other significant characteristics. Several machine learning techniques were employed, including random forest regression, gradient descent, and neural networks. After evaluating the performance of these models, random forest regression was identified as the best-performing model, achieving a Mean Absolute Error (MAE) of 112.93 and RMSE of 241.97. However, the study had some limitations, such as not adequately addressing the issue of class imbalance in the dataset and overlooking the impact of diamond cut on price. It is suggested that combining random forest classification results with regression results could enhance the accuracy and practicality of the findings.
The research by Mamonov and Triantoro examined [8] the relationship between diamonds' characteristics and their prices in the e-commerce sector, with the goal of identifying the key physical attributes that influence pricing. They found that carat, color, and clarity are the main determinants. Predictive analysis was conducted using decision forests, boosted decision trees, and artificial neural networks. The results indicated that decision forests achieved the lowest MAE of 5.8% for the entire set, while artificial neural networks performed best with an MAE of 8.2% for diamonds in the 0.2 to 2.5 carat range. However, the study did not consider other effective predictive methods such as XGBoost, nor did it utilize evaluation metrics like R-squared (R²) and RMSE. Additionally, the importance of cut was not addressed. Chu's study [9] aimed to establish a diamond price model considering factors like clarity, color, and carat using multiple linear regression. The final model achieved an R² of 0.972 but failed to address the nonlinear relationship between carat and price.
The analysis also failed to consider additional variables that might significantly impact prices. Pandey et al. [10] introduced a hybrid approach that integrated random forest with Principal Component Analysis (PCA) to address problems related to overfitting and underfitting. Their findings showed that random forest outperformed linear regression in terms of average accuracy; however, it was not thoroughly compared to other top-performing models such as Multilayer Perceptron (MLP) and XGBoost. Additionally, the subjective application of PCA reduced the statistical independence and validity of the outcomes. In another study, Scott [11] examined diamond prices through the lens of status and intrinsic value, gathering data from online retailers. Key factors like carat, color, cut, and clarity were used to determine the logarithm of the price. The adjusted R² values for diamonds sold by Blue Nile, Union Diamond, and Amazon were 0.889, 0.898, and 0.937, respectively. Nevertheless, the research did not explore the nonlinear connections between diamond features and their prices, and the lack of error metrics like RMSE weakened the robustness of the results.
Collectively, these studies utilized a range of approaches to predict diamond prices, but there remains room for improvement in evaluation standards, model selection, and feature consideration. Future investigations could focus on integrating the advantages of various models to enhance the precision of diamond price forecasts.
3. Methodology
This research aims to predict diamond prices by applying machine learning models, exploring the main factors influencing diamond prices and providing precise pricing references for the jewelry industry. The dataset used in this study is the publicly available Kaggle dataset [12], which contains 53,940 records and 10 attributes, such as carat, cut, color, clarity, and dimensions. See Table 1. The study methodology involves data preprocessing, selecting relevant features, training models, and evaluating their performance.
Table 1: Raw diamond data sample.
Unnamed: 0 | carat | cut | color | clarity | depth | table | price | x | y | z |
49504 | 0.55 | Ideal | H | IF | 61.5 | 55.0 | 2120 | 5.25 | 5.29 | 3.25 |
4721 | 0.37 | Ideal | F | SI2 | 60.9 | 56.0 | 572 | 4.65 | 4.68 | 2.84 |
23515 | 1.56 | Ideal | G | SI1 | 61.2 | 56.0 | 11522 | 7.49 | 7.51 | 4.59 |
4129 | 1.52 | Premium | I | I1 | 61.2 | 58.0 | 3541 | 7.43 | 7.35 | 4.52 |
46068 | 0.54 | Ideal | G | SI1 | 61.9 | 55.0 | 1736 | 5.04 | 5.06 | 3.24 |
13490 | 1.16 | Very Good | H | VS2 | 63.0 | 57.0 | 5537 | 6.64 | 6.66 | 4.19 |
44933 | 0.58 | Very Good | H | VS2 | 61.2 | 55.8 | 1633 | 5.39 | 5.41 | 3.30 |
46746 | 0.60 | Premium | D | SI1 | 62.9 | 58.0 | 1799 | 5.39 | 5.33 | 3.37 |
3.1. Data Preprocessing
Firstly, the data preprocessing step is crucial. To ensure the integrity and consistency of the data, the dataset was first checked for missing values and outliers, and invalid data points were removed. For instance, zero values in the x, y, and z dimensions were addressed. Additionally, categorical variables (cut, color, and clarity) were encoded to allow the model to process these features. After data preprocessing, the dataset no longer contained any missing values or obvious outliers, thus providing a clean and reliable data foundation for model training.
To further understand the data distribution and the relationships between features, thesis conducted data visualization analysis. By plotting the relationships between various attributes (such as cut, color, and clarity) and price, thesis was able to visually observe how these features impact price. For example, Figure 1 illustrated the price distribution across different cut grades, revealing that higher cut grades generally correspond to higher prices. Specifically, diamonds with an "Ideal" cut were the most numerous, while those with a "Fair" cut were the least. In the lower price categories, diamonds with various cuts were more prevalent. Similarly, the impact of different colors and clarity levels on price was also depicted through visual charts. For instance, diamonds with a "J" color grade were the poorest and rarest, while those with "H" and "G" color grades were more common, despite their lower quality. Additionally, diamonds with "IF" clarity (the best) and "I1" clarity (the worst) were both extremely rare, with the majority of diamonds falling within the intermediate clarity range. These visual analyses provide a more intuitive understanding of how different features influence diamond prices.
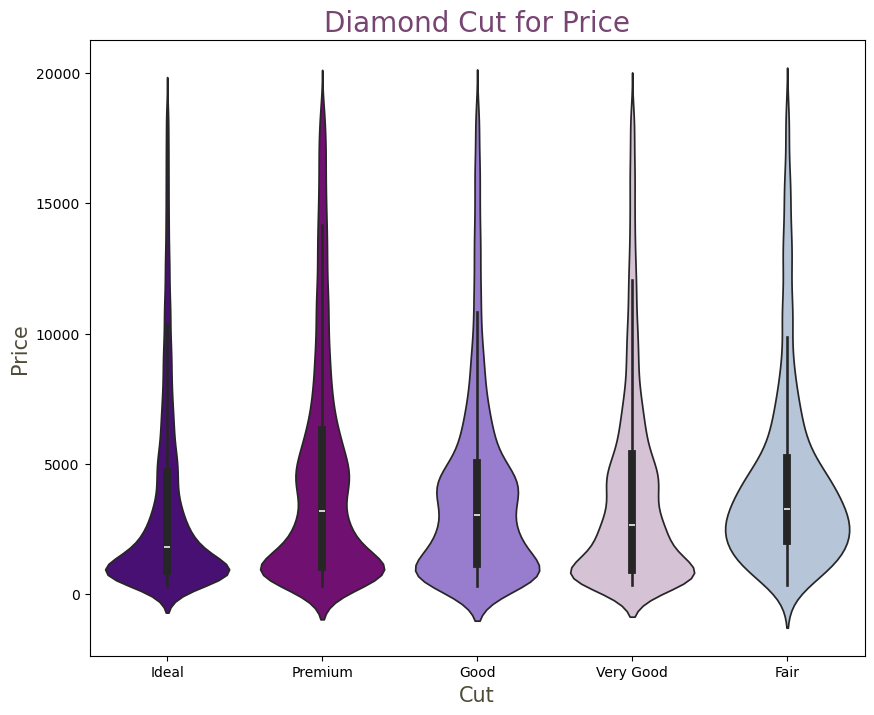
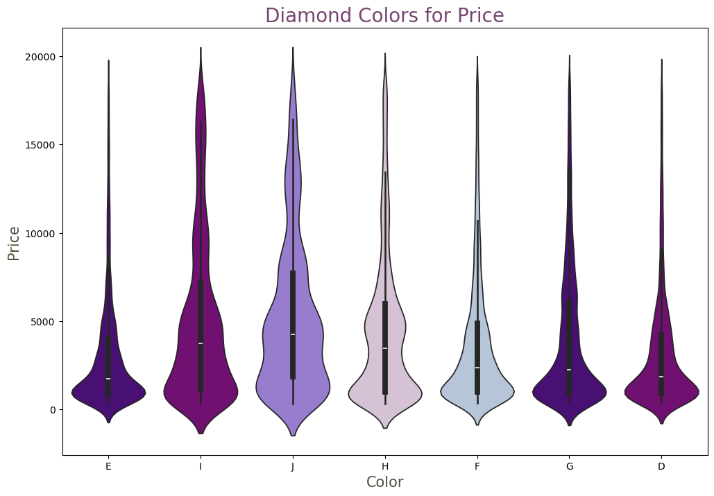
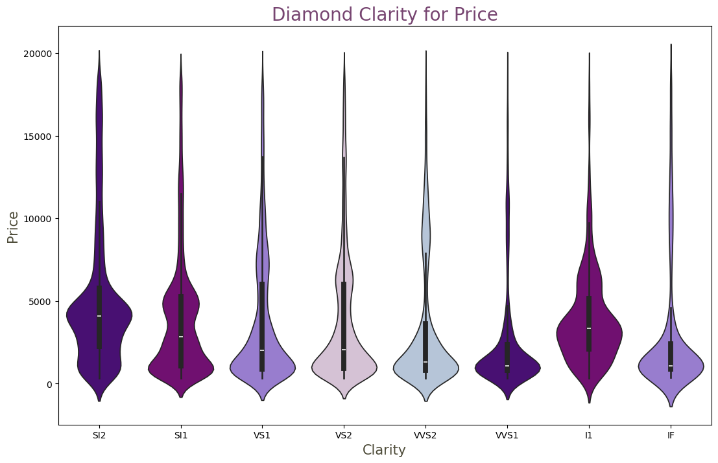
Figure 1: Violin plots for cut, colors and clarity.
After conducting an initial analysis of the data, thesis observed that the price data exhibits a right-skewed distribution, indicating that lower-priced diamonds are more prevalent. See table 2. Additionally, thesis identified outliers in the dimensional features "x," "y," and "z," where some values were as low as 0, which are not meaningful and need to be appropriately handled during preprocessing. Finally, an extraneous "Unnamed: 0" index column was identified, which will be removed during the data cleaning process.
Table 2: Descriptive statistics of diamond dataset before preprocessing.
Statistic | Unnamed: 0 | carat | depth | table | price | x | y | z |
count | 53940.0 | 53940.0 | 53940.0 | 53940.0 | 53940.0 | 53940.0 | 53940.0 | 53940.0 |
mean | 26970.5 | 0.7979 | 61.7494 | 57.4572 | 3932.7997 | 5.7312 | 5.7345 | 3.5387 |
std | 15571.2811 | 0.4740 | 1.4326 | 2.2345 | 3989.4397 | 1.1218 | 1.1421 | 0.7057 |
min | 1.0 | 0.2 | 43.0 | 43.0 | 326.0 | 0.0 | 0.0 | 0.0 |
25% | 13485.75 | 0.40 | 61.0 | 56.0 | 950.0 | 4.71 | 4.72 | 2.91 |
50% | 26970.50 | 0.70 | 61.80 | 57.0 | 2401.0 | 5.70 | 5.71 | 3.53 |
75% | 40455.25 | 1.04 | 62.50 | 59.0 | 5324.25 | 6.54 | 6.54 | 4.04 |
max | 53940.0 | 5.01 | 79.0 | 95.0 | 18823.0 | 10.74 | 58.90 | 31.80 |
When analyzing the relationship between features and price, the line plots revealed some outliers in the data. See Figure 2. Specifically, there are anomalous points in the dimensions "y" and "z" that clearly deviate from the main distribution area, which could negatively impact the model's performance. Therefore, these outliers should be removed during data preprocessing. Additionally, the features "depth" and "table" also exhibited a few extreme values in the plots. To prevent these extreme values from affecting the model's accuracy, it is necessary to apply truncation to these features.
After removing the regression outliers, a pair plot of the data was generated. This visualization revealed that the dataset is now cleaner and more optimized. Subsequently, a correlation matrix was analyzed to identify potential relationships between features, which will inform the process of feature selection. See Figure 3. This step is essential for improving model performance by concentrating on the most relevant attributes. Thesis found that the features "carat," "x," "y," and "z" had strong correlations with the target variable, price, suggesting their importance in predicting diamond prices. However, features like "cut," "clarity," and "depth" exhibit lower correlations with price <0.1, which theoretically could justify their removal. Nevertheless, given the limited number of selected features and to ensure the model’s diversity and comprehensiveness, thesis have decided to retain these low-correlation features.
In the feature selection stage, all variables associated with price were chosen as independent variables (X), with price being dependent variable (Y). The dataset was then split into training and testing subsets to enable model training and evaluate performance. Several regression models were employed during the training phase, including ridge regression, decision tree, random forest regression, k-nearest neighbors’ regression, XGBoost, multivariate linear regression, gradient boosting tree regression, and multilayer perceptron.
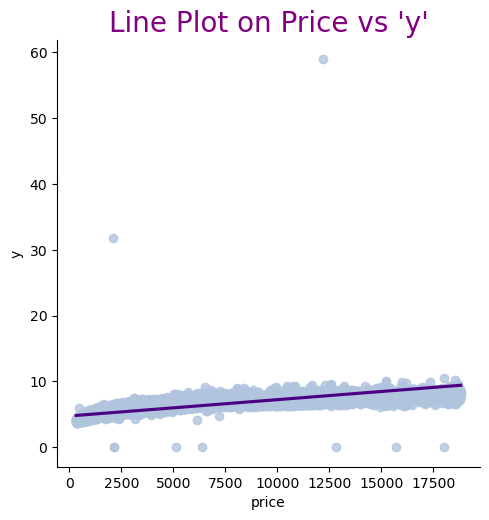
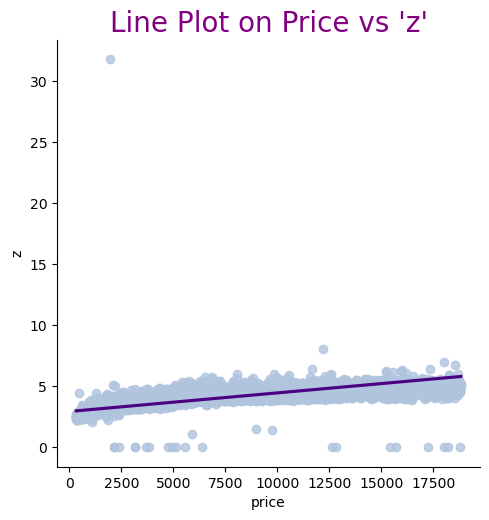
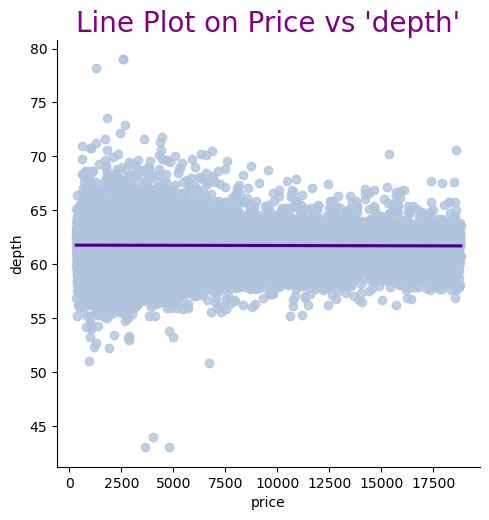
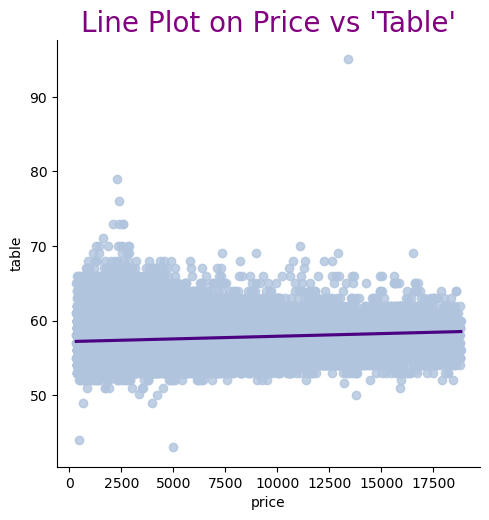
Figure 2: Relationship between dimensional features and price.
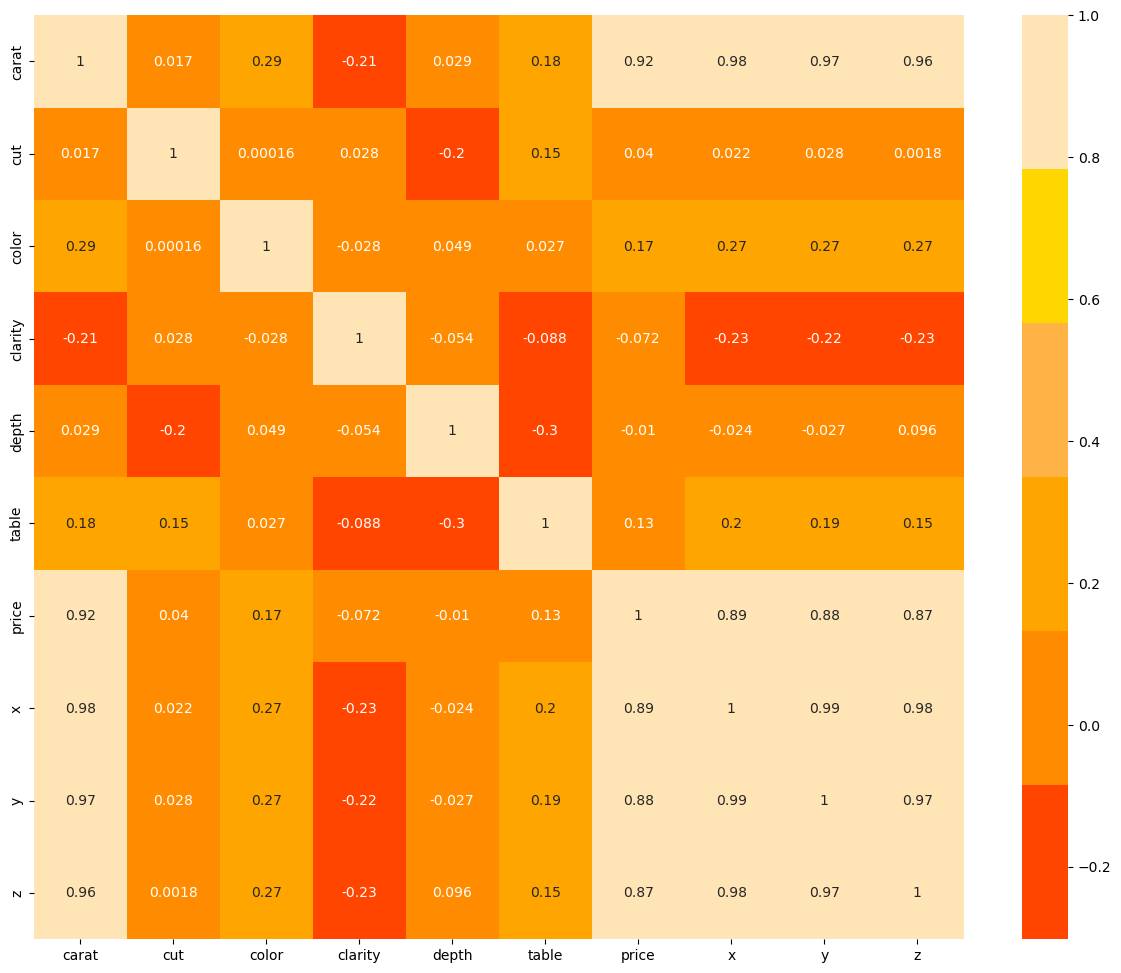
Figure 3: Correlation matrix of variables.
3.2. Result
To ensure the performance and stability of the models, cross-validation was employed for model evaluation. Root means square error was used as the primary performance metric. Cross-validation results indicated that the XGBoost model performed the best among all models, with the lowest RMSE. See Table 3. This was followed by random forest regression and gradient boosting tree regression. These results suggest that ensemble learning methods have a significant advantage in handling this dataset.
Table 3: RMSE values for various regression models.
MODEL | RMSE |
Linear Regression | 1383.854012 |
Lasso | 1366.991298 |
Decision Tree | 739.623299 |
Random Forest | 549.440545 |
KNeighbors | 816.559263 |
XGBRegressor | 548.346850 |
Multiple Linear Regression | 1383.854012 |
Boosted Regression Trees | 676.910018 |
MLP Regressor | 1167.883235 |
4. Discussion
In the model evaluation phase, thesis conducted an in-depth analysis of the top three performing models: XGBoost, random forest regression, and gradient boosting tree regression (see in Table 4). Firstly, the R² and adjusted R² on the test set for the XGBoost regression model were 0.982129 and 0.982114, respectively, indicating that the model fits the data well and possesses high predictive accuracy. Secondly, the R² and adjusted R² for the random forest regression model were 0.981494 and 0.981478, respectively, demonstrating excellent performance, albeit slightly inferior to XGBoost. Lastly, the R² and adjusted R² for the gradient boosting tree regression model were 0.974297 and 0.974276, respectively, also exhibiting high predictive performance.
Table 4: R2 and adjusted R2 values for selected models.
MODEL | R² | Adjusted R² |
XGBRegressor | 0.982129 | 0.982114 |
Random Forest | 0.981494 | 0.981478 |
Boosted Regression Trees | 0.974297 | 0.974276 |
These results suggest that the XGBoost model is the most effective in predicting diamond prices, followed by random forest regression and gradient boosting tree regression. The superior performance of the XGBoost model can be attributed to its powerful ensemble learning capabilities and its advantage in handling nonlinear relationships. In practical applications, the XGBoost model can provide more accurate diamond price predictions, offering valuable references for pricing strategies in the jewelry industry. Additionally, the accuracy of the model was further verified through the visualization of the prediction results. A scatter plot comparing the actual prices and predicted prices showed that most data points are distributed near the 45-degree diagonal line, further demonstrating the high accuracy of the model. Residual analysis indicated that the prediction errors of the model were small and showed no obvious systematic bias.
It is worth noting that although the dataset used in the study is relatively comprehensive, there are still certain limitations. For instance, the uneven distribution of certain features in the dataset may affect the model's generalization ability. Moreover, the model's performance may also be influenced by data quality and feature selection. Therefore, future research can further optimize data preprocessing and feature engineering, or introduce more features to enhance the model's predictive capability.
5. Conclusion
This research conducted a comprehensive analysis of diamond price prediction using machine learning methods. By performing data preprocessing, selecting relevant features, training models, and evaluating performance, the study identified the XGBoost model as the most accurate in predicting diamond prices. Key factors such as carat, cut, color, and clarity were found to have varying degrees of importance across different models. The study provides a scientific foundation for pricing strategies in the jewelry industry, demonstrating that machine learning methods can lead to more precise and efficient predictions. Future work could involve further refining these models and incorporating additional features that may influence pricing to improve predictive accuracy. Integrating market dynamics and demand fluctuations would allow for real-time model adjustments, ensuring more scientific and flexible pricing approaches. This study not only validates the effectiveness of machine learning in price prediction but also offers valuable insights for similar research fields. Machine learning's potential is especially prominent in areas requiring the analysis of large datasets and complex relationships. As data continues to grow and technology advances, machine learning will likely play an even more significant role in diamond price prediction and related challenges. In conclusion, this study presents a robust solution for diamond price forecasting through comprehensive analysis and offers an important reference point for future research. With continued advancements and refinement, these models will further enhance the jewelry industry's pricing strategies, providing stronger support for its development.
References
[1]. Olson, D.W. (2003) Diamond, industrial. Minerals Yearbook, 1, 22.1-22.5.
[2]. Garside, M. (2022) Market value of diamond jewelry worldwide from 2010 to 2022. Retried from. https://www.statista.com/statistics/585267/diamond-jewelry-market-value-worldwide.
[3]. Garside, M. (2022) Market value of diamond jewelry worldwide in 2022, by country. Retried from. https://www.statista.com/statistics/585103/diamond-jewelry-market-value-worldwide-by-region.
[4]. Kigo, S.N., Omondi, E.O., & Omolo, B O. (2023) Assessing predictive performance of supervised machine learning algorithms for a diamond pricing model. Scientific Reports, 13(1), 17315.
[5]. Mamonov, S., & Triantoro, T. (2018) Subjectivity of diamond prices in online retail: Insights from a data mining study. J. Theor. Appl. Electron. Commer. 13(2), 15–28.
[6]. Cardoso, M., & Chambel, L. (2005) A valuation model for cut diamonds. Int. Trans. Oper. Res., 12(4), 417–436.
[7]. Alsuraihi, W., Al-hazmi, E., Bawazeer, K., & AlGhamdi, H. (2020) Machine learning algorithms for diamond price prediction. In Proceedings of the 2020 2nd International Conference on Image, Video and Signal Processing, 150–154.
[8]. James, G., Witten, D., Hastie, T., & Tibshirani, R. (2013) An Introduction to Statistical Learning, 112.
[9]. Vaillant, N., Wolff, F.C. (2013) Understanding diamond pricing using unconditional quantile regressions. Asian Economic and Financial Review, 3(11).
[10]. Pandey, A.C., Misra, S., & Saxena, M. (2019) Gold and diamond price prediction using enhanced ensemble learning. In 2019 Twelfth International Conference on Contemporary Computing, 1–4.
[11]. Scott, F., & Yelowitz, A. (2010) Pricing anomalies in the market for diamonds: Evidence of conformist behavior. Econ. 48(2), 353–368.
[12]. Agrawal, S. (2017) Analyze diamonds by their cut, color, clarity, price, and other attributes. Retrieved on 2024, Retrieved from: https://www.kaggle.com/shivam2503/diamonds.
Cite this article
Xiao,M. (2024). Diamond Price Prediction Based on Regression Algorithms: Analyzing Key Factors and Model Performance. Advances in Economics, Management and Political Sciences,139,196-205.
Data availability
The datasets used and/or analyzed during the current study will be available from the authors upon reasonable request.
Disclaimer/Publisher's Note
The statements, opinions and data contained in all publications are solely those of the individual author(s) and contributor(s) and not of EWA Publishing and/or the editor(s). EWA Publishing and/or the editor(s) disclaim responsibility for any injury to people or property resulting from any ideas, methods, instructions or products referred to in the content.
About volume
Volume title: Proceedings of the 3rd International Conference on Financial Technology and Business Analysis
© 2024 by the author(s). Licensee EWA Publishing, Oxford, UK. This article is an open access article distributed under the terms and
conditions of the Creative Commons Attribution (CC BY) license. Authors who
publish this series agree to the following terms:
1. Authors retain copyright and grant the series right of first publication with the work simultaneously licensed under a Creative Commons
Attribution License that allows others to share the work with an acknowledgment of the work's authorship and initial publication in this
series.
2. Authors are able to enter into separate, additional contractual arrangements for the non-exclusive distribution of the series's published
version of the work (e.g., post it to an institutional repository or publish it in a book), with an acknowledgment of its initial
publication in this series.
3. Authors are permitted and encouraged to post their work online (e.g., in institutional repositories or on their website) prior to and
during the submission process, as it can lead to productive exchanges, as well as earlier and greater citation of published work (See
Open access policy for details).
References
[1]. Olson, D.W. (2003) Diamond, industrial. Minerals Yearbook, 1, 22.1-22.5.
[2]. Garside, M. (2022) Market value of diamond jewelry worldwide from 2010 to 2022. Retried from. https://www.statista.com/statistics/585267/diamond-jewelry-market-value-worldwide.
[3]. Garside, M. (2022) Market value of diamond jewelry worldwide in 2022, by country. Retried from. https://www.statista.com/statistics/585103/diamond-jewelry-market-value-worldwide-by-region.
[4]. Kigo, S.N., Omondi, E.O., & Omolo, B O. (2023) Assessing predictive performance of supervised machine learning algorithms for a diamond pricing model. Scientific Reports, 13(1), 17315.
[5]. Mamonov, S., & Triantoro, T. (2018) Subjectivity of diamond prices in online retail: Insights from a data mining study. J. Theor. Appl. Electron. Commer. 13(2), 15–28.
[6]. Cardoso, M., & Chambel, L. (2005) A valuation model for cut diamonds. Int. Trans. Oper. Res., 12(4), 417–436.
[7]. Alsuraihi, W., Al-hazmi, E., Bawazeer, K., & AlGhamdi, H. (2020) Machine learning algorithms for diamond price prediction. In Proceedings of the 2020 2nd International Conference on Image, Video and Signal Processing, 150–154.
[8]. James, G., Witten, D., Hastie, T., & Tibshirani, R. (2013) An Introduction to Statistical Learning, 112.
[9]. Vaillant, N., Wolff, F.C. (2013) Understanding diamond pricing using unconditional quantile regressions. Asian Economic and Financial Review, 3(11).
[10]. Pandey, A.C., Misra, S., & Saxena, M. (2019) Gold and diamond price prediction using enhanced ensemble learning. In 2019 Twelfth International Conference on Contemporary Computing, 1–4.
[11]. Scott, F., & Yelowitz, A. (2010) Pricing anomalies in the market for diamonds: Evidence of conformist behavior. Econ. 48(2), 353–368.
[12]. Agrawal, S. (2017) Analyze diamonds by their cut, color, clarity, price, and other attributes. Retrieved on 2024, Retrieved from: https://www.kaggle.com/shivam2503/diamonds.