


1.Introduction
According to the Four Quarter and Full Year 2023 Results, Annual Dividend and Share Repurchase Program released on JD’s official website which revealed the financial results and annual cash dividend for 2023 and was likely to repurchase up to US$3.0 billion worth of its shares(including ADSs) over the next 36 months[1]. This positive trend provides researchers interest and confidence which is likely to result in more profound studying of the financial performance of the corporation.
JD is a self-operated e-commerce company that was originally set up in 1998 and managed to become the most influential agent in opto- magnetic industry within 3 years, followed by a success of coming into the market officially in the NASDAQ Stock Exchange in 2014, which is considered the first large-scale integrated e-commerce platform in China to successfully go to public in the United States.
In Profitability Analysis of Listed E-commerce Enterprises Based on Dupont Model by Gu [2], JD’s profitability between 2017-2019 is analyzed based on DuPont Model and comes to a positive conclusion that JD’s financial performance including profitability have been enhancing. Similarly, another report carried out by Yan, The Financial Analysis of Pingduoduo Based on Harvard Framework[3], studies the factors and causes of expansion of Pingduoduo, another great power in e-commerce industry and gives expectation of its prospect. There is hopeful development tendency in e-commerce enterprises and further research is going to be carried out. Wu and Li Analyse the Investment Value of Sanqi Interactive Entertainment Based on DCF Model [4]. Bao et al. study the SF Holding based on Harvard Analysis Framework[5].
In this paper, the financial performance of JD company in the past five years is going to analyzed and illustrated, which includes the financial health, profitability, risk and return, etc, and it is supposed to give an assessment of the financial and business condition of the enterprise and uncover information on aspects such as the profitability, debt-paying ability, operation capability, and growth ability in order to provide data support to decision-makers.
2.Theoretical Framework
2.1.Financial statement analysis
This reports uses profitability ratios and liquidity ratios to analyze the financial performance of JD. Profitability ratios include growth margin and net profit margin. A greater value of gross margin represents that the company has greater growth in revenue, while net profit margin determines the company’s profitability gained from its revenue and how well it operated. Liquidity ratios include current ratio and quick ratio. Current ratios determines how well a company is able to pay off current debt, a higher value represents a higher capability. Quick ratio determines the company’s ability to pay off debt with current assets and without selling any inventories, a higher value represent better liquidity and financial health.
Leverage ratios, including debt-to-equity ratio (D/E ratio) and debt-to-caoital ratio, are also used in determining the company’s financial ability. The D/E ratio shows how well a company manages debt, where a higher value represents a higher risk, but also a higher reliance in debt financing. The debt-to-capital ratio also shows the company’s manage of debt, a higher value represents that the company has a high debt in the fund, meaning that there would be a higher risk of default.
2.2.Risk and Return
2.2.1.Relative valuation: P/S Ratio (Price-to-sales ratio)
The relative valuation of JD is conducted through the price-to-sales ratio. It compares stock prices to company revenues by representing each dollar the market invested in the company’s revenues. A high P/S value means that the stock can be overpriced or overvalued since the revenue of the stock is not as notable as the value that people are willing to invest.
\( \frac{P}{S}=\frac{Market Value per Sale}{Sales per Share} \)(1)
2.2.2.Capital Asset Pricing Model (CAPM)
The CAPM model assists investors’ risk management by showing whether the stock is valuable and whether the expected return is worthy. Components within the model include risk-free rate, the equity risk premium, and the stock’s beta. The beta value in the CAPM model shows the correlation of the stock’s volatility to the market’s. The closer the beta value is to one, the less diverge it is from the market.
\( {R_{i}}={R_{f}}+{β_{i}} × ({R_{m}}-{R_{f}}) \)(2)
2.2.3.Sharpe Ratio
The Sharpe Ratio is a way to calculate the relationship between historical and current returns to their assumer risk. It shows the risk-adjusted performance of a certain company, which is how a company controls risk and return. The Sharpe ratio is better used when comparing companies of the same sector.
\( Sharpe Ratio=\frac{Stock Excess Return}{Stock Volatility}=\frac{E[{R_{p}}]-{r_{f}}}{SD({R_{p}})} \)(3)
3.Results and Discussion
3.1.Financial statement
3.1.1.Profitability
Profitability is usually defined as the ability of an enterprise to earn profit over a certain period of time. Profitability means the profit is relative to a certain input of resources, which is a certain income. The good or bad business performance of an enterprise can be reflected by the profitability of the enterprise. Taking an investment avauation conducted by Li and Zhang as referrance, net income growth, net profit margin, and gross margin could be used to determine the trend of a company’s performance and the market demand for its survices [6]. In this part, net income growth and compare the net profit margin, and the gross margin of JD with that of Alibaba and PDD to analyze the profitability of JD.
3.1.1.1.Net income and net income growth
As shown in the figure 1, between 2019 and 2023 net interest and net income growth rate of JD show a bumpy variation trend (data is collected from Yahoo Finanace. In 2020,the net income peaked at $7.14 billion while the net income growth rate reached 314%.94.The reason may be that they chose to transform from focusing on e-commerce company to managing supply-chain. JD's service revenue increased significantly in 2020($13 billion).In 2021, JD posted a loss. The main reason for the loss was investment losses. The full-year 2021 loss on equity investments was $ 0.68 billion, compared with a gain of $ 0.6 billion in the same period in 2020. Another reason is the increase in revenue costs(JD’s fulfillment, marketing, and research expenses continue to rise.)However, JD began a steady recovery in 2022 and 2023 due to market demand picking up and cost controlling. Result in an increase in the net income growth rate.
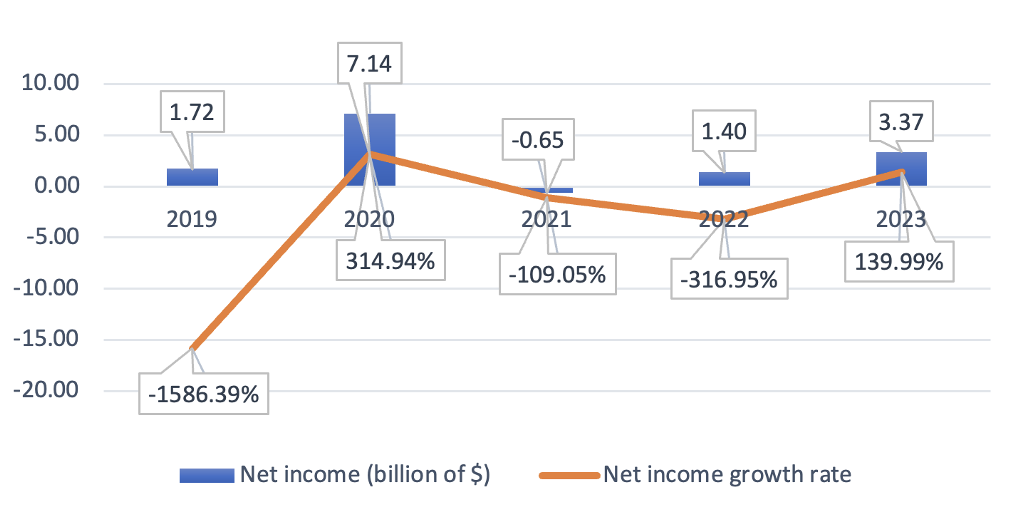
Figure 1: Net income and net income growth rate of JD.
3.1.1.2.Net profit margin
Net profit margin is a percentage to measure how much net profit a company makes up its revenue. It is the ratio of net profits to revenues for a company.
As shown in figure 2, compared with Alibaba and PDD, the net profit margin of JD was more stable. The change in net profit margin of JD was similar to net income. Except for 2020, the figure for Alibaba was always the highest. After the middle of 2022, PDD exceeded JD, remaining growth.
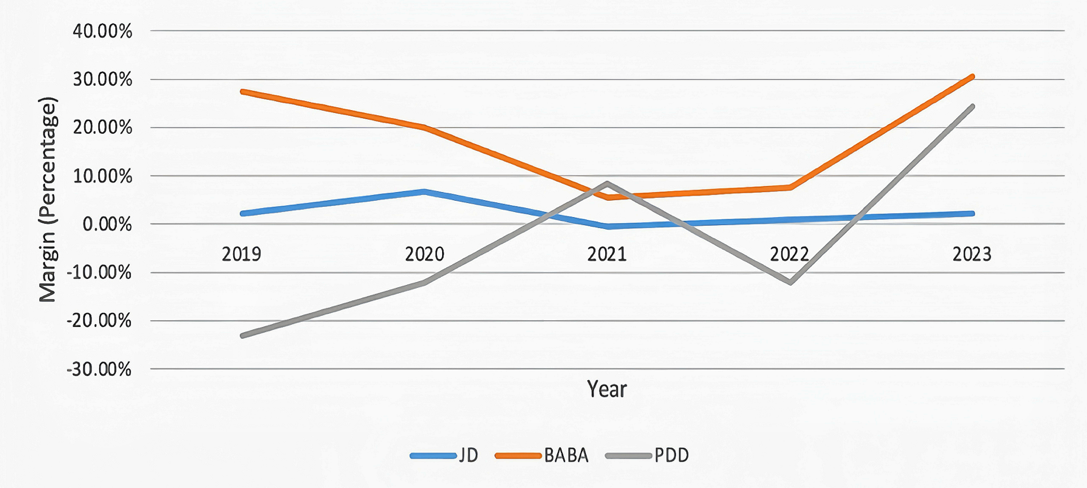
Figure 2: Net profit margin JD, Alibaba, and PDD from 2019-2023
In 2020, competition from peers increased. Because the competition pressures increased and the failure in strategic investments, the net profit margin of Alibaba declined. The data on PDD was negative from 2019 to 2020 due to the heavy investment in the wrong places, such as market penetration and user acquisition. JD realized growth as it net income rose in 2020. In 2021 PDD had a positive spike as economies of scale and improved composition of revenue, while JD and Alibaba decreased for their lower competitiveness. After 2022, PDD and Alibaba rose significantly, but JD grew slowly[2].
The reason for the above difference may be that as an industry giant, JD’s business scale is already quite large, the difficulty of achieving high growth is gradually increasing, and the development space is relatively small.
3.1.1.3.Gross margin
Gross margin is an important measure of profitability, which measures how the company's gross profit compares to its revenue. In this line chart, From 2019 to 2023, PDD’s gross profit has been the highest, with Alibaba in the middle, and JD has been the lowest. JD was the most stable, which Maintained a slight increase. The development was mainly due to the rapid growth of its logistics and technology services businesses, which have higher gross margins than its traditional retail business. The difference in gross profit between these three companies is mainly caused by their different business models. PDD’s social e-commerce model and low-pricing strategy led to rapid growth and significantly increased gross margin; Alibaba's diversified business brought higher gross margins; JD's self-operated model and logistics services grew steadily, resulting in an increase in gross margin, but at a lower overall level.
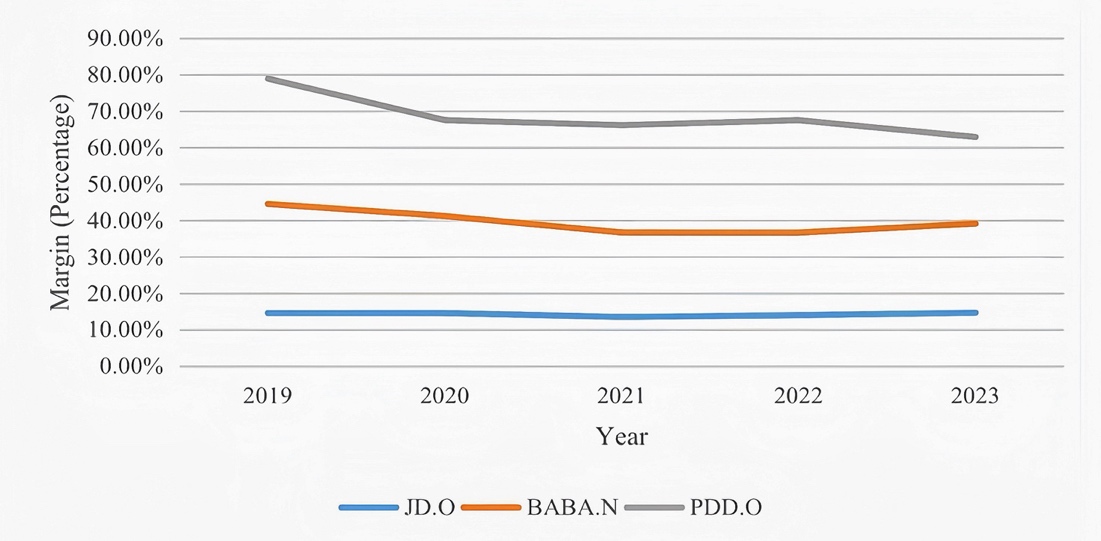
Figure 3: Gross margin JD, Alibaba, and PDD from 2019-2023
3.1.2.Liquidity
Liquidity refers to how well a company's could payoff its short-term liabilities with liquid assets (usually cash or assets that can be quickly converted to cash). It is an important standard to measure a company's financial health and operational efficiency.In this part, current ratio and quick ratio will be used to measure the liquidity of JD.
3.1.2.1.Current ratio
As present in table 1, JD kept a current ratio between 0.9 and 1.36 over the 2019-2023 period, showing that in general, the company was gradually becoming more able to pay its debts in the short term while there was a decline in 2023. The current ratio increased significantly because cash and cash equivalents and other short-term investments grew. This may reflect the company's higher sales revenues and stronger cash inflows during these years. However, there was a drop in 2022 and 2023. There were several factors, such as an increase in short-term debt and accounts payable, changes in the macroeconomic environment, and increased competition in the market, etc.
Table 1: Current Ratio and Quick Ratio
|
JD’s current ratio and quick ratio |
||
|
Year |
Current Ratio |
Quick Ratio |
|
2019 |
0.993 |
0.580 |
|
2020 |
1.349 |
1.011 |
|
2021 |
1.352 |
1.084 |
|
2022 |
1.317 |
1.025 |
|
2023 |
1.159 |
0.903 |
3.1.2.2.Quick Ratio
From the perspective of quick ratio, which is the ratio of an enterpirsse’s quick assets to current liabilities - quick assets is given by the balance of current assets through the difference between inventory and prepaid expenses (these include cash, short-term investments, notes receivable, accounts receivable, etc.). Jingdong's quick ratio in 2019 is the lowest in five years at 0.580, well below the 1:1 traditionally considered by experience, and below the value in the following four years. When the quick ratio is too low, a company's short-term debt service risk is higher, echoing Jingdong's excessively high debt-to-equity ratio in 2019.
3.1.3.Leverage
3.1.3.1.Debt-to-equity ratio and debt-to-capital ratio
Table 2: Debt-to-equity ratio and debt-to-capital ratio
|
JD’s debt-to-equity ratio and debt-to-capital ratio |
||
|
Year |
Debt-to-equity Ratio |
Debt-to-capital Ratio |
|
2019 |
2.068 |
0.674 |
|
2020 |
1.065 |
0.516 |
|
2021 |
1.012 |
0.503 |
|
2022 |
1.171 |
0.539 |
|
2023 |
1.122 |
0.529 |
In this section, the debt-to-equity and debt-to-capital ratios of JD will be analysed. Debt-to-equity ratio is expressed in the formula as total liabilities/shareholders' equity × 100 percent. Out of the debt-to-equity ratios for JD over the past five years, the value reached a high of 2.068 in 2019, which, as a more capital-intensive industry, is still grossly out of the range of values that are commonly taken for debt-to-equity ratios, i.e., this value should be less than 1.0. This indicates that JD could have been aggressively gaining the growth of its business using debt. The additional interest expense may lead to volatility in earnings. However, over the next four years, JD's debt-to-equity ratio went straight back to a value slightly outside the common range and remained stable, a change that certainly makes JD less financially risky for investors. In terms of the debt-to-equity ratio, it is calculated by dividing a company's interest-bearing debt (both short-term and long-term) by its total capital. JD's debt to own capital ratio shows a relatively flat performance over the five years 2019-2023, fixed at around 0.5-0.6, indicating that JD's ratio of fixed assets to debt is relatively balanced, the company's business risk and profitability are stable, and that the company is perceived by investors as low-risk.
3.2.Risk and Return
Assessing the risk and return of a company supports an investor’s decision-making process. Only when the potential risks are analyzed can these risks be controlled. Having an understanding of the potential risks reveals whether a company is at an appropriate place in the market and among other companies in the same sector. Additionally, risk and return analysis manifests the company's historical performances, giving an insight into future performances and investors’ ongoing expectations. Most importantly, the risk of investing in JD's stock could be managed through concepts such as P/S ratio, the Sharpe ratio, and the CAMP model.
3.2.1.P/S Ratio
Furthermore, the relative valuation method, specifically the P/S ratio, examines JD’s value in great depth. The P/S ratio assesses a company’s stock value by measuring the company's stock price to its revenue . The P/S ratio gives the amount of investment per dollar of revenue that investors are willing to invest.
Table 3: Company’s P/S ratio
|
Company’s P/S Ratio |
|||
|
Year |
JD |
PDD |
BABA |
|
2019 |
0.505 |
40.969 |
2.625 |
|
2020 |
0.390 |
20.757 |
1.865 |
|
2021 |
0.306 |
13.144 |
1.568 |
|
2022 |
0.278 |
9.459 |
1.540 |
|
2023 |
0.268 |
4.987 |
5.402 |
For JD, the calculation of its P/S ratio uses the annual revenue of each company divided by the present market capitalization of the enterprise. Its P/S values of 2019, 2020, 2021, 2022, and 2023 are 0.50, 0.39, 0.31, 0.28, and 0.27 respectively. Taking the most recent P/S, the P/S ratio in 2023 is around 0.27x, which means that an investment of $0.27 is willing to be paid for $1 of revenue. Compared to the P/S value of PDD of 4.99x, and 5.40x of BABA, the P/S value of JD shows that it is more undervalued compared to PDD and BABA. The average P/S value of the three stocks is 3.55x, which is 3.28x higher than JD’s P/S ratio, proving that JD is a low-cost company to invest for the same amount of revenue output. In short, this indicates that JD has lower expected growth among PDD and BABA.
3.2.2.Sharpe ratio
Moreover, the Sharpe ratio of the data set determines the risk-adjusted performance of a stock. JD’s Sharpe ratio, calculated annually, between 2019 and 2023 is -59.47, 34.00, 24.78, -33.85, and -181.07. The negative Sharpe return in years 2019, 2022, and 2023 represents that the risk-free rate is greater than the historical return, and the JD is undesirable in its ability to adjust risk with its return. This suggests that JD’s return could become negative if it were to be invested, corresponding with the analysis on annualized return.
3.2.3.CAPM Model
Finally, the risk and return of JD’s stock could be assessed by the CAMP model. The CAPM model asses the systematic risk and expected return of a stock, utilizing the return rate, risk-free rate, and correlation to the market (measured by beta). In JD’s case, the expected return of its investment over the five years is 1.10, -0.11, 0.18, 0.38, and 3.90. The contradiction between the high net income and the low expected return in 2020, could be caused by factors that influenced stock price but not the performance of the company. For instance, if even though the stock price of JD dropped in 2020, its progress in expanding its customer base and its long-term effect in improving the company’s net income would not be affected. However, the expected return of 3.90 in 2023 signifies positive returns, though it could be limited due to assumptions in CAPM. To understand more about the stock, an analysis of beta in the CAPM model is made.
The beta value designates the security and volatility of the company’s stock by showing its correlation with the market. The market is represented by the S&P 500 stock, which has a beta value of 1.0. Taking JD’s “adj close” stock prices from all the opening days between 2019.1.2 to 2023.12.29, the beta value is 1.102, which indicates the company’s stock price is conceptually 10.2% more volatile than the market.
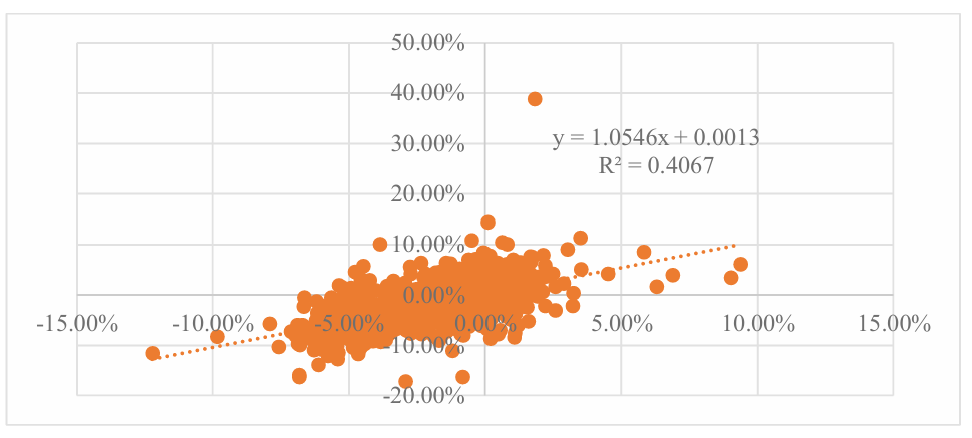
Figure 4: Bata Trend of JD’s stovk 2019-2023.
The corresponding graph shows the correlation of the market return minus the risk-free rate (mkt-Rf) and JD’s return minus the risk-free rate (R(JD)-Rf). Through the slope of the graph, a positive linear correlation of 1.102 is shown, which is also the beta value calculated from the stock prices. The R2 value is 0.4067, which means that the mkt-Rf is 40.67% correlated with R(JD)-Rf.
For an investor, a stock with a beta value close to 1 indicates that it diverges less from the market [7]. As a result, JD’s stocks follows market trend. However, since the JD is only 10% more volatile, this demonstrates that the return of JD would also be less compared to a company whose beta value is higher.
4.Conclusion
As the analysis of JD’s financial analysis came to an end, conclusions on its performance over the five years could be drawn. Between 2019 to 2023, JD experienced the most growth in income and net profit margin in 2020, when JD renovated its supply chain management, while experiencing a large decrease in the years after due to investment losses and expansion costs, which resulted in the steady growth of net income in the end of the five years. The low and steady growth of JD could be influenced by growth in BABA, PDD, and other unmeasured factors, with all three companies being giants in the industry. In terms of JD’s liquidity, JD’s current ratio increased, with better management on paying its debts; while its quick ratio first increased then decreased again, representing a change from higher risk debt, dropping to lower risk, and returning back high. When analyzing JD’s stock market, its stock prices was the highest in 2020, but eventually dropped in 2022-2023; therefore, the investment in JD’s stock market has a prospect of negative return if stock prices continue to drop. Possible reasons for the stock price drop could be the limited room for expansion and development in JD’s business, and that there were relatively fewer innovations that posed an impact in the recent two years when compared to 2020. Additionally, the beta value greater than on in risk and return shows that its fluctuation in the stock is greater than the market fluctuation. The overall financial performance of JD in 2022-2023 was not as high as the year 2020, possibly due to market competition of the same sector and lack of massive innovations in the field to push another surge in income or stock price. When analyzing whether to invest in the stock, investors should note that JD has a positive expected return but may not be a stock that would experience a surge in stock prices. Investors should also note that JD’s stock would be more volatile than the market; therefore risk averse investors may not want to invest in this stock.
In the analysis of financial corporations, the methods all have limitations to certain extents due to problems such as assumptions, unsynchronized information, unmeasured variables, etc.
Overall, the limitations in this research could be concluded to be impacted by unforeseeable factors, assumptions, and the incomprehensiveness of certain models. For instance, the cause of the rise and fall of JD’s stock could not be concluded for particular reasons, it could be affected by innumerable changes in the market, the media, changes within JD’s subdivisions, etc. The same holds true for the rise and drop of net income growth rate, gross margin, and net profit margin. Likewise, the data analysis methods could not completely represent the full picture of JD when there are too many influences that could not be taken into consideration. For future analysis, limitations could be reduced through exploring more on research in the company’s background, which means combining contextual information along with data analysis. Similarly, research on trend in the market and the sector would be conducted for future predictions in both JD’s stock or its financial performance in general.
Authors Contribution
All the authors contributed equally and their names were listed in alphabetical order.
References
[1]. JD.com Announces Fourth Quarter and Full Year 2023 Results, Annual Dividend and Share Repurchase Program. Retrieved from https://ir.jd.com/news-releases/news-release-details/jdcom-announces-fourth-quarter-and-full-year-2023-results-annual.
[2]. Guo Z. Profitability Analysis of Listed E-commerce Enterprises Based on DuPont Model - Based on JD Enterprise. Shanghai Business, 2021, (12): 33-35
[3]. Yan J. The Financial Analysis of Pingduoduo Based on Harvard Framework.China economist 2024, (07):73-74.
[4]. Wu W., Li Y. Analysis of Investment Value of Sanqi Interactive Entertainment Based on DCF Model. Chinese market, 2024, (22): 40-43.
[5]. Bao B., Qiao P., Guo Y. Financial Research of SF Holding based on Harvard Analysis Framework. Logistics Research, 2023, (01): 41-47
[6]. Li, Z., Zhang, Y., Analysis of Investment Value of New Energy Vehicle Companies. Enterprise Reform and Management, 2023, (10):61-62.
[7]. Kenton, Will., (2024), What Beta Means for Investors. Investopedia. Retrieved from https:// www.investopedia.com/terms/b/beta.asp#:~:text=A%20Beta%20of%201.0%20for.
Cite this article
Liu,H.;Niu,X.;Xu,Y. (2025). Research on the Investment Value of JD Based on Multiple Methods. Advances in Economics, Management and Political Sciences,154,42-50.
Data availability
The datasets used and/or analyzed during the current study will be available from the authors upon reasonable request.
Disclaimer/Publisher's Note
The statements, opinions and data contained in all publications are solely those of the individual author(s) and contributor(s) and not of EWA Publishing and/or the editor(s). EWA Publishing and/or the editor(s) disclaim responsibility for any injury to people or property resulting from any ideas, methods, instructions or products referred to in the content.
About volume
Volume title: Proceedings of the 3rd International Conference on Financial Technology and Business Analysis
© 2024 by the author(s). Licensee EWA Publishing, Oxford, UK. This article is an open access article distributed under the terms and
conditions of the Creative Commons Attribution (CC BY) license. Authors who
publish this series agree to the following terms:
1. Authors retain copyright and grant the series right of first publication with the work simultaneously licensed under a Creative Commons
Attribution License that allows others to share the work with an acknowledgment of the work's authorship and initial publication in this
series.
2. Authors are able to enter into separate, additional contractual arrangements for the non-exclusive distribution of the series's published
version of the work (e.g., post it to an institutional repository or publish it in a book), with an acknowledgment of its initial
publication in this series.
3. Authors are permitted and encouraged to post their work online (e.g., in institutional repositories or on their website) prior to and
during the submission process, as it can lead to productive exchanges, as well as earlier and greater citation of published work (See
Open access policy for details).
References
[1]. JD.com Announces Fourth Quarter and Full Year 2023 Results, Annual Dividend and Share Repurchase Program. Retrieved from https://ir.jd.com/news-releases/news-release-details/jdcom-announces-fourth-quarter-and-full-year-2023-results-annual.
[2]. Guo Z. Profitability Analysis of Listed E-commerce Enterprises Based on DuPont Model - Based on JD Enterprise. Shanghai Business, 2021, (12): 33-35
[3]. Yan J. The Financial Analysis of Pingduoduo Based on Harvard Framework.China economist 2024, (07):73-74.
[4]. Wu W., Li Y. Analysis of Investment Value of Sanqi Interactive Entertainment Based on DCF Model. Chinese market, 2024, (22): 40-43.
[5]. Bao B., Qiao P., Guo Y. Financial Research of SF Holding based on Harvard Analysis Framework. Logistics Research, 2023, (01): 41-47
[6]. Li, Z., Zhang, Y., Analysis of Investment Value of New Energy Vehicle Companies. Enterprise Reform and Management, 2023, (10):61-62.
[7]. Kenton, Will., (2024), What Beta Means for Investors. Investopedia. Retrieved from https:// www.investopedia.com/terms/b/beta.asp#:~:text=A%20Beta%20of%201.0%20for.