


1. Introduction
The Dupont analysis system was proposed by scholars Pierre Du Pont and Donaldson Brown. Return on equity was taken as the core financial indicator of the system, which was gradually divided into three indicators: equity multiplier, total asset turnover and net profit margin on sales, and replaced by these three indicators [1]. After decomposing the financial indicators through the Dupont analysis system, we can not only have a more intuitive understanding of the connection between the financial indicators, but also have a clearer grasp of the company's operating conditions [2]. By analyzing the changing factors of the financial indicators, we can timely find the problems of the enterprise and take solutions [3,4].
The application and analysis of the Dupont analysis system in China's chemical industry is relatively rare, and domestic scholars focus more on the application of the Dupont analysis system in the analysis of corporate finance, combined with the actual operating conditions of domestic listed companies [5]. At the same time, the research on corporate profitability by domestic and foreign scholars using the Dupont financial analysis system mostly exists in other industries, and the analysis and research applied to high-tech industries are relatively few, so there are still many shortcomings to be improved [6].
The research feature of this paper is to take ESH company as a representative of high-tech enterprises in the chemical industry and apply the Dupont analysis system to study the profitability of chemical enterprises. Combined with the actual case of ESH company, through the calculation, analysis and comparison of relevant financial indicators, the development status of ESH company is summarized, and a variety of factors that may affect the profitability of chemical enterprises are found, so as to expand the research work of the Dupont analysis system in the chemical field. On the basis of the analysis of relevant financial indicators, the causes of ESH company's financial problems are analyzed, and corresponding improvement measures are put forward [7,8].
2. Theoretical Basis
2.1. The Dupont Financial Analysis System
The Dupont financial analysis system is one of the most commonly used and comprehensive analysis methods to analyze corporate profitability in recent years. In fact, when analyzing the profitability of enterprises, the above indicators are usually further decomposed and analyzed, so that the analysis data can contain multiple aspects of the enterprise, and the problems existing in the production, operation and sales of the whole industry can be found out in more detail, and the corresponding countermeasures can be put forward in time.
2.2. The Decomposed Indicators of the Dupont System
2.2.1. Return on Equity
Return on equity (ROE) is the most important and comprehensive indicator in this analysis system. It reflects the ability of an enterprise to obtain net profit through its own capital. The size of this index can directly reflect the overall sales revenue level, comprehensive profit level and financial status of the enterprise. This index is very comprehensive and plays an important auxiliary role in the formulation of enterprise business strategy and management mode by the future management. ROE is mainly calculated by dividing total net profit by shareholders' equity.
2.2.2. Rate on Assets
Rate on assets (ROA) is one of the comprehensive indicators obtained after decomposition, and is closely related to the two indicators of net profit margin on sales and total asset turnover. Through the vertical and horizontal comparison of ROA values, we can analyze and evaluate the development ability and operating status of an enterprise in the same industry, and then obtain the analysis of its profitability. It is also the main reference data for company managers to judge whether an enterprise can carry out debt management. Together with the above indicators, this index can judge the risk degree of the company's current operation, and at the same time, the enterprise debt factor can be considered in place. ROA is mainly calculated by dividing net profit by average total assets.
2.2.3. Equity Multiplier
EM is strongly related to the asset-liability ratio, which can directly reflect the company's operating debt level and the debt level that the company can bear, and is the embodiment of the company's financial leverage level. At the same time, this indicator can also indicate the level of debt used to purchase fixed assets or maintain the daily operation of the enterprise. The equity multiplier is a risk indicator; the higher its value, the more the enterprise debt financing’s assets increase, the higher the financial leverage of the enterprise, and the greater the capital risk to minority shareholders and creditors. The lower the value is, the more stable the development of the enterprise is, which is more beneficial to the development of the enterprise. However, the lower the value is, the better, and the too-low equity multiplier indicates that the enterprise does not have a good grasp of the capital utilization efficiency, so it needs to improve the enterprise's capital management ability. This indicator can be obtained by dividing average total assets by total net assets.
3. Collection and Sorting of ESH Company's Financial Data
3.1. Summary of Financial Data of ESH Company
Extract and sort out the relevant financial information of ESH company in the five years from 2019 to 2023, including the relevant data from the balance sheet and income statement of the enterprise [9], and the specific situation after summary is shown in Table 1 and Table 2.
Table 1: Assets and liabilities data of ESH Company over the years (Unit: 10,000 yuan)
Year | Total assets | Total liabilities | Shareholders equity |
2019 | 3504225.27 | 1974224.11 | 1530001.16 |
2020 | 8333236.65 | 5318575.63 | 3014661.02 |
2021 | 13200254.32 | 10259451.41 | 2940802.91 |
2022 | 17077815.92 | 13443307.23 | 3634508.69 |
2023 | 19021480.22 | 15472262.11 | 3549218.11 |
Table 2: Profit data of ESH Company over the years (Unit: 10,000 yuan)
Year | Total income | Total cost | Total profit | Profit from operations | Net profit |
2019 | 2488776.90 | 2321389.88 | 190588.40 | 189764.83 | 161216.08 |
2020 | 3369879.70 | 3275700.69 | 111745.48 | 111042.26 | 83972.76 |
2021 | 5172217.97 | 4559927.68 | 605873.17 | 601675.41 | 508624.61 |
2022 | 6387290.01 | 6293051.64 | 53179.38 | 50088.60 | 59959.21 |
2023 | 14043973.81 | 13863707.94 | 31097.07 | 24386.36 | 71119.38 |
3.2. Calculation of the Dupont Financial Analysis Indicators for ESH Inc
Combined with the elaboration of various financial indicators of the Dupont analysis system described above, the collected financial data of ESH company are calculated, and the results are shown in Table 3.
Table 3: The Dupont Financial Analysis indicator calculation of ESH Company
Year | Return on equity | Net profit margin on sales | Total asset turnover | Equity multiplier |
2019 | 0.0460 | 0.0648 | 0.7102 | 2.2903 |
2020 | 0.0101 | 0.0249 | 0.4044 | 2.7642 |
2021 | 0.0385 | 0.0983 | 0.3918 | 4.4887 |
2022 | 0.0035 | 0.0094 | 0.3740 | 4.6988 |
2023 | 0.0037 | 0.0051 | 0.7383 | 5.3593 |
4. Profitability Analysis of ESH Company
4.1. Return on Equity Analysis
The profit indicator with the highest comprehensive rate in the Dupont analysis system of return on equity is the main reference to judge the asset situation and profitability of an enterprise. According to the calculation results in Table 3, the change trend of this indicator of ESH Company from 2019 to 2023 can be obtained, as shown in Figure 1 below.
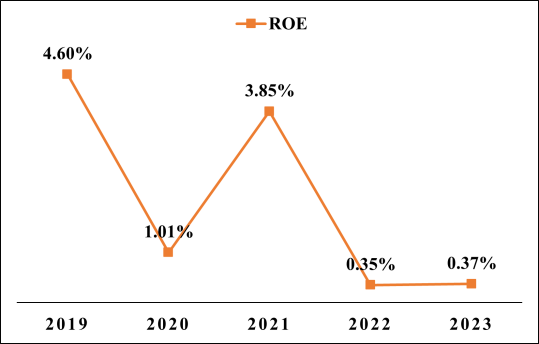
Figure 1: Trend of return on equity of ESH company
From the changing trend of this indicator in Figure 1, it can be found that from 2019 to 2020, the return on equity of ESH company shows a significant downward trend, and then rapidly rebounds to 3.85% in 2021, and stabilizes at about 0.35%-0.37% in 2022 and 2023. From this indicator, the profit trend of ESH company in recent years is not optimistic. At the same time, it is found that during this period, the total operating income and total expenditure of ESH company are on the rise. Combined with the actual enterprise development environment, it can be obtained that due to the COVID-19 epidemic around 2020, the chemical industry including ESH company, as a real industry, has suffered a huge impact and impact. Subsequently, due to the recovery of the industry market and ESH's early resumption of production capacity, the profit recovered significantly in 2021. After the end of the epidemic, ESH companies have been increasing their expenditure, and ESH companies, which are still in the early stage of capacity expansion, show the characteristics of low profitability to a certain extent.
4.2. Net Profit Margin on Sales Analysis
Net profit margin on sales can show the profit level of enterprise sales, which is the ratio of net profit to sales revenue. According to the results calculated in Table 3, the changing trend of this indicator of ESH company from 2019 to 2023 can be obtained, as shown in Figure 2.
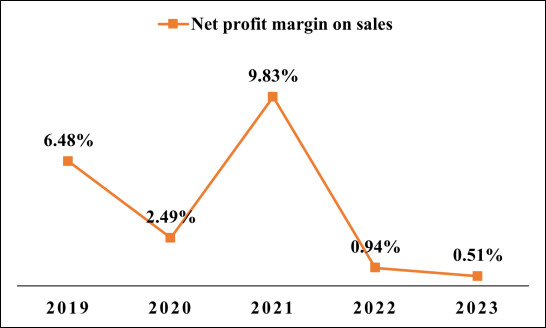
Figure 2: Net profit margin on sales of ESH company
As can be seen from Figure 2, the overall net sales margin of ESH company fluctuates greatly in the past five years, showing a trend of declining and then rising again, reaching the maximum value of 9.83% in 2021 in the past five years. According to the disclosed information, ESH company has invested a large amount of research and development funds after the end of the epidemic, and has launched a number of large-scale projects. The large increase in enterprise R&D investment is difficult to avoid having a negative impact on the evaluation of ESH company's profitability in a short period of time.
4.3. Total Asset Turnover Analysis
Total asset turnover can reflect the level of enterprise capital management, as well as the liquidity and use turnover of assets in product research and development, increasing investment and expanding enterprise scale. According to the results calculated in Table 3, the changing trend of this indicator of ESH company from 2019 to 2023 can be obtained, as shown in Figure 3 below:
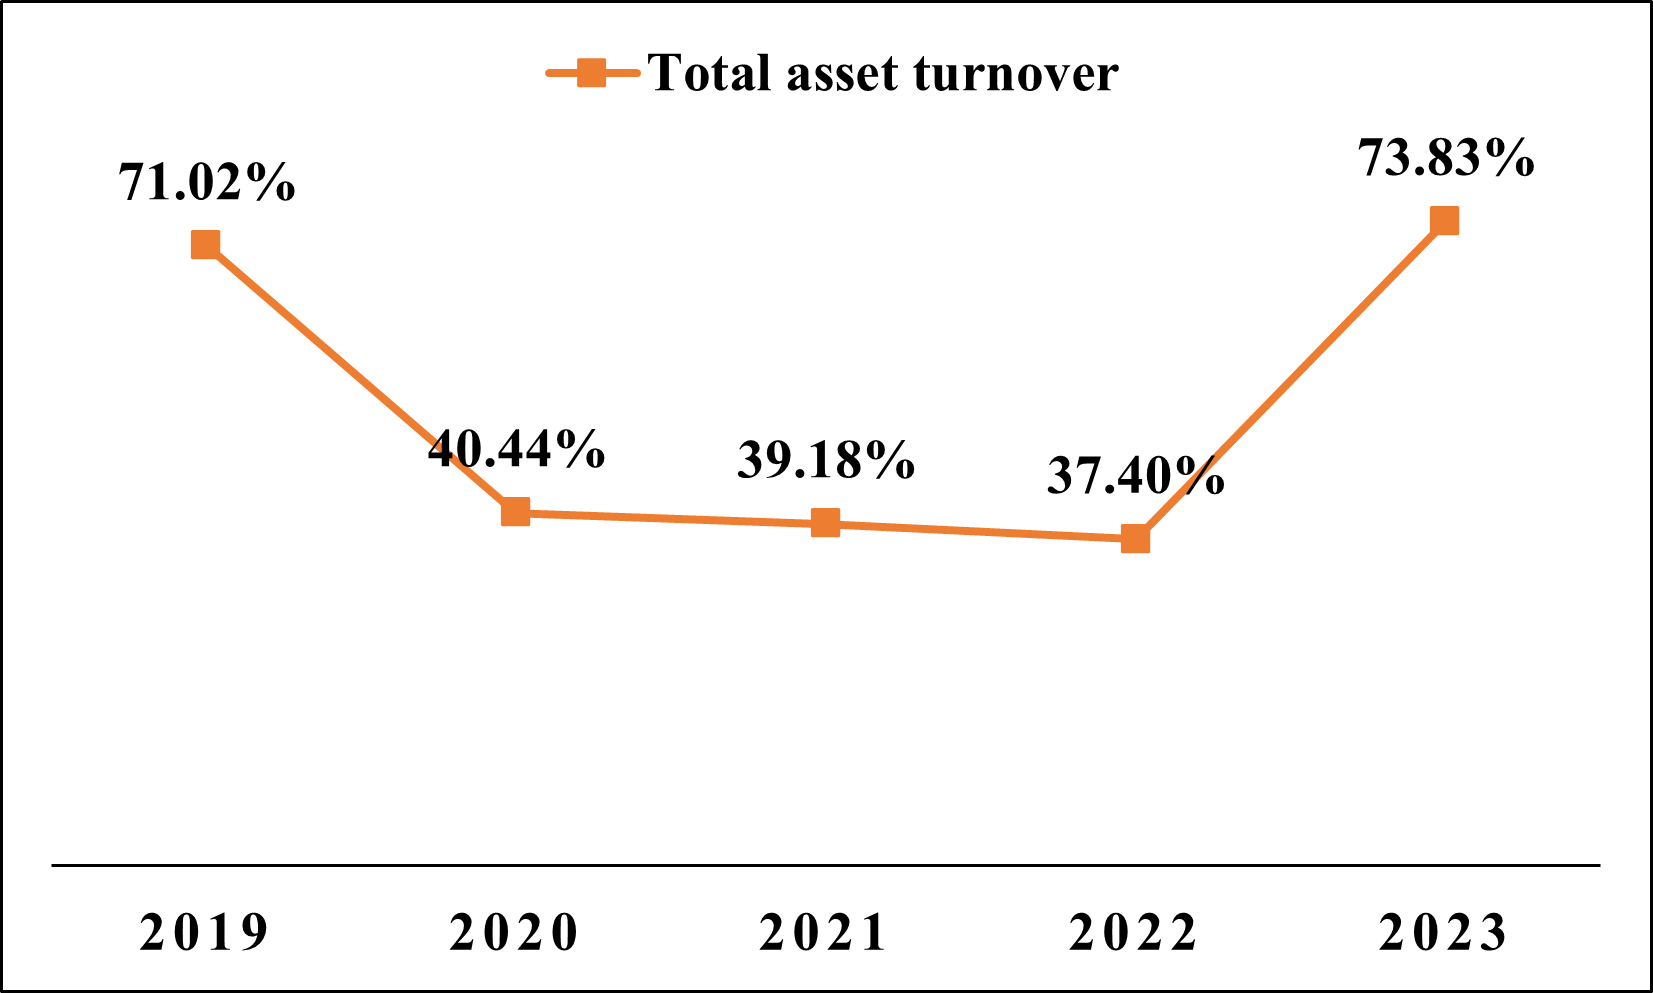
Figure 3: Total asset turnover of ESH company
It can be seen from Figure 3 that the total asset turnover of ESH companies in the past five years shows a trend of declining, stabilizing and then rising. It fell by nearly 30 percentage points around 2020 due to the COVID-19 pandemic, and then stabilized around 40% during the pandemic, indicating a significant reduction in the company's liquidity during this period. After the end of the epidemic in 2023, the overall economy began to recover, and the recovery of asset liquidity in the industry led to the recovery of total asset turnover of ESH company. The managers of the company need to take advantage of the improvement of the general environment, actively strengthen the business level, further analyze the main problems existing in the enterprise, and promote the improvement of the efficiency of asset use.
4.4. Equity Multiplier Analysis
Equity multiplier is mainly used to judge the possibility of enterprise debt operation, which is an important embodiment of enterprise financial leverage. If the index is too high, it means that the financial leverage is large, and the risk of enterprise debt operation is large, while if the index is low, it means that the capital utilization ability of the enterprise needs to be strengthened. According to the results calculated in Table 3, the changing trend of this indicator of ESH company from 2019 to 2023 can be obtained, as shown in the figure below:
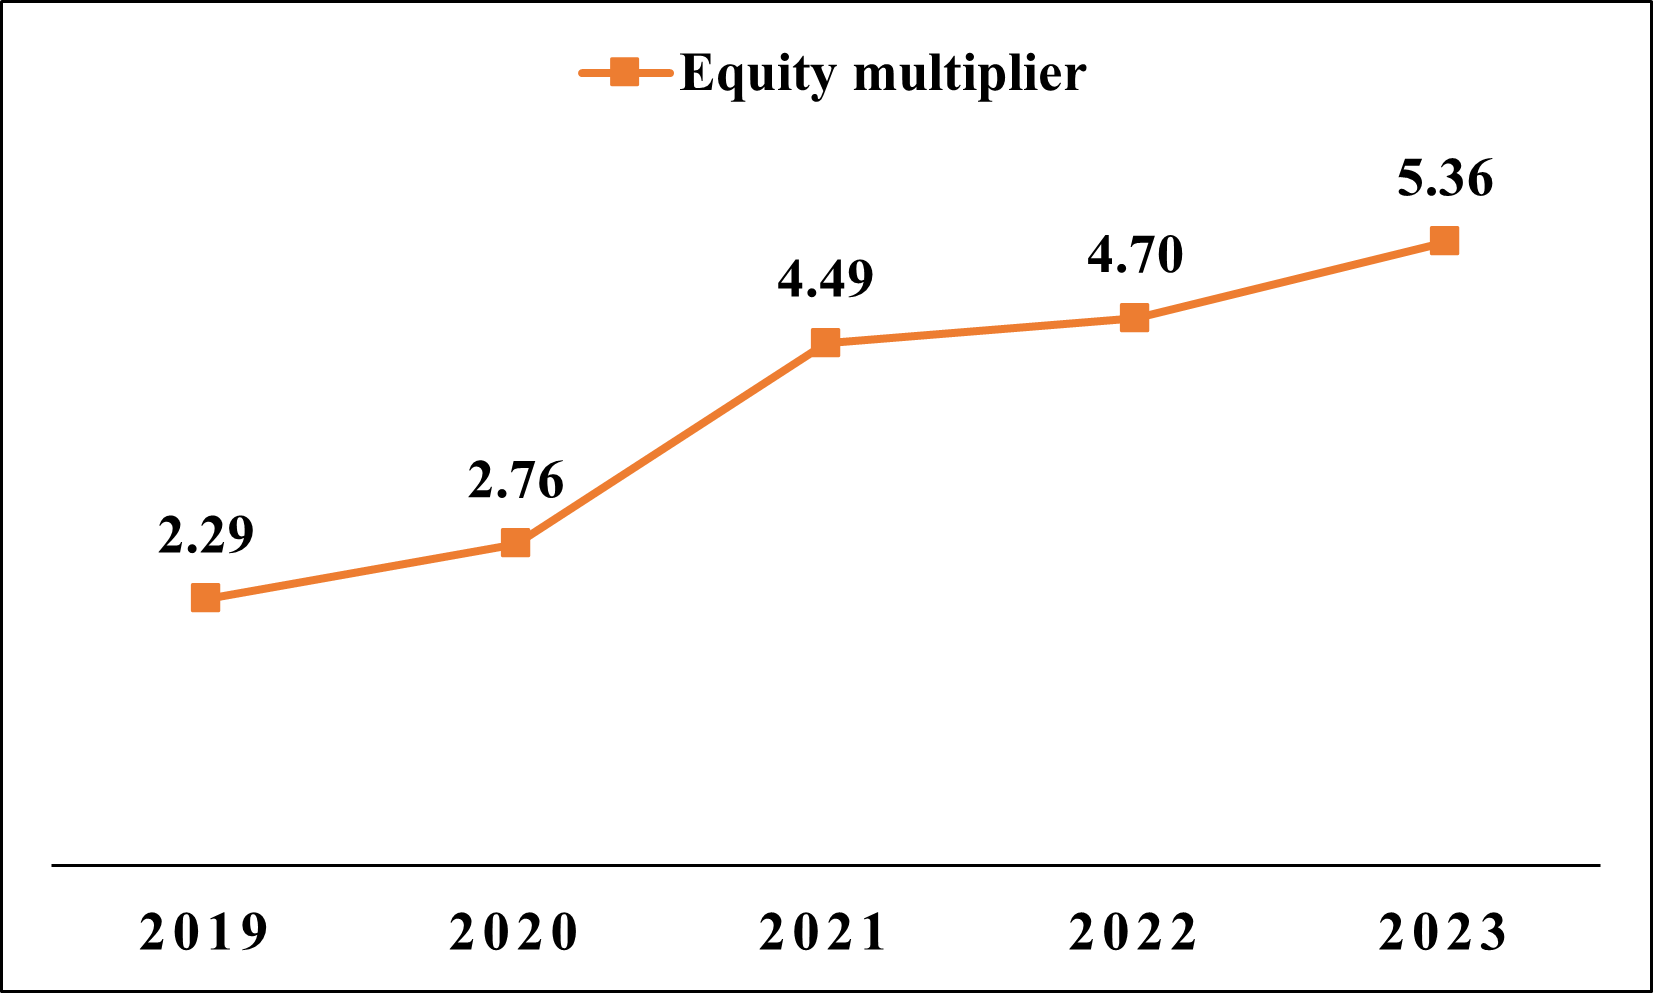
Figure 4: Equity multiplier of ESH company
It can be seen from Figure 4 that the equity multiplier of ESH company has increased year by year in the past five years, indicating that the debt management level of the enterprise has been continuously improved, which is in line with the reality that ESH company has been expanding its industry as shown by the disclosure results. Combined with the fact that the shareholders' equity of the enterprises in Table 1 basically maintains a steady upward trend, and the total assets and operating income can maintain a steady upward trend at the same time, to sum up, SYHG's financial leverage is relatively stable, the enterprise's operating risk is low, and the profitability is relatively strong.
5. Conclusion
Based on the above analysis of the profitability of ESH company in the past five years by using the Dupont financial analysis system, it can be found that the enterprise can continuously improve its operating costs while maintaining stable profits, and the relevant turnover situation has been improved. It is easy to see that after years of development, ESH company's profitability is very stable, especially in 2020. Due to the impact of COVID-19, most enterprises have a great impact, while ESH company can still make stable profits, and rebound quickly and expand production capacity after the end of the epidemic. To a certain extent, this also shows that the company's main business is of great significance to residents' lives, so it can be less affected by the epidemic. Therefore, the company should continue to give full play to its main advantages in the production of core products, adhere to efforts to improve the international and domestic market share of finished products, and pave the way for the possibility of further increasing the profitability of the company. At the same time, ESH company has been increasing leverage in recent years, which is also of great significance for effectively increasing enterprise operating income and steadily increasing market share in the future [10-12].
Through the analysis of the relevant change trend of ESH company, it can be found that the company has been expanding its operation under the condition of increasing leverage in recent years, and the corporate profits have been greatly compressed in this process. Although it is possible to be optimistic about the future operation through analysis, there is no doubt that managers should make strategic decisions with a more prudent attitude to avoid the situation of losing money. At the same time, due to the impact of the epidemic, the cost of some raw materials from the international market is high, the price fluctuates greatly, and the cost situation is not stable. Therefore, simply expanding production capacity may not improve the profitability of enterprises, but may increase the operating cost of enterprises and compress the profit margin, thus affecting the profitability of enterprises.
References
[1]. Goran Karanovic, Sinisa Bogdan, Suzana Baresa. Financial Analysis Fundament for Assessment the Company Value [J]. Utms Journal of Economics, 2010,11.
[2]. Revsine L., Collins D., Johnson B. Financial Reporting and Analysis [M]. Prentice Hall, Upper Saddle River, New Jersey, 1999. 988.
[3]. Nikolaos P. Eriotis, Zoe Frangouli, and Zoe Ventoura Neokosmides. Profit Margin And 45 Capital Structure: An Empirical Relationship [J]. The Journal of Applied Business Research, 2002(8):200-210.
[4]. F.Allen and A.M. Santomero. The theory of financial analysis [J]. Journal of Finance, 1997:141-185.
[5]. Song Sixuan. Based on analysis of Dupont SYHG corporate profitability study [D]. Shenyang chemical industry university, 2021. DOI: 10.27905 /, dc nki. Gsghy. 2021.000158.
[6]. Shan Shihui. Based on dupont financial analysis system of JL company profitability analysis [D]. Liaoning university of petroleum chemical industry, 2019. DOI: 10.27023 /, dc nki. GFSSC. 2019.000033.
[7]. Lengnick-Hall C A. A conceptual framework for evaluating designs for corporate innovation [J]. Journal of Engineering & Technology Management, 1991, 7(3-4):197-227.
[8]. Yang, Q., Duan, X. et al. Analysis on the pattern evolution and influencing factors of China's high-tech industry development level [J]. Resources and Environment in the Yangtze Basin, 2014, 23(12):1649-1658.
[9]. ESH Company. (2019-2023). ESH Company. Annual Report. http://www.jsessh.com/tzzguanxi/qiyegonggao/
[10]. Nissm.K.Financial Analysis Fundament for Assessment the Company Value [J]. Utms Journal of Economics, 2014:332-340.
[11]. Al-Mwalla, The Impact of Working Capital Management Policies on Firm’s Profitability and Value: The Case of Jordan [J]. International Research Journal of Finance and Economics, 2011(85).
[12]. Bodie Z. Making Investment Choices as Simple as Possible, but Not Simpler [J]. Financial Analysts Journal, 2007, 63(3):42-47.
Cite this article
Liu,S. (2025). ESH Company Profitability Study Based on the Dupont Financial Analysis. Advances in Economics, Management and Political Sciences,167,10-16.
Data availability
The datasets used and/or analyzed during the current study will be available from the authors upon reasonable request.
Disclaimer/Publisher's Note
The statements, opinions and data contained in all publications are solely those of the individual author(s) and contributor(s) and not of EWA Publishing and/or the editor(s). EWA Publishing and/or the editor(s) disclaim responsibility for any injury to people or property resulting from any ideas, methods, instructions or products referred to in the content.
About volume
Volume title: Proceedings of the 4th International Conference on Business and Policy Studies
© 2024 by the author(s). Licensee EWA Publishing, Oxford, UK. This article is an open access article distributed under the terms and
conditions of the Creative Commons Attribution (CC BY) license. Authors who
publish this series agree to the following terms:
1. Authors retain copyright and grant the series right of first publication with the work simultaneously licensed under a Creative Commons
Attribution License that allows others to share the work with an acknowledgment of the work's authorship and initial publication in this
series.
2. Authors are able to enter into separate, additional contractual arrangements for the non-exclusive distribution of the series's published
version of the work (e.g., post it to an institutional repository or publish it in a book), with an acknowledgment of its initial
publication in this series.
3. Authors are permitted and encouraged to post their work online (e.g., in institutional repositories or on their website) prior to and
during the submission process, as it can lead to productive exchanges, as well as earlier and greater citation of published work (See
Open access policy for details).
References
[1]. Goran Karanovic, Sinisa Bogdan, Suzana Baresa. Financial Analysis Fundament for Assessment the Company Value [J]. Utms Journal of Economics, 2010,11.
[2]. Revsine L., Collins D., Johnson B. Financial Reporting and Analysis [M]. Prentice Hall, Upper Saddle River, New Jersey, 1999. 988.
[3]. Nikolaos P. Eriotis, Zoe Frangouli, and Zoe Ventoura Neokosmides. Profit Margin And 45 Capital Structure: An Empirical Relationship [J]. The Journal of Applied Business Research, 2002(8):200-210.
[4]. F.Allen and A.M. Santomero. The theory of financial analysis [J]. Journal of Finance, 1997:141-185.
[5]. Song Sixuan. Based on analysis of Dupont SYHG corporate profitability study [D]. Shenyang chemical industry university, 2021. DOI: 10.27905 /, dc nki. Gsghy. 2021.000158.
[6]. Shan Shihui. Based on dupont financial analysis system of JL company profitability analysis [D]. Liaoning university of petroleum chemical industry, 2019. DOI: 10.27023 /, dc nki. GFSSC. 2019.000033.
[7]. Lengnick-Hall C A. A conceptual framework for evaluating designs for corporate innovation [J]. Journal of Engineering & Technology Management, 1991, 7(3-4):197-227.
[8]. Yang, Q., Duan, X. et al. Analysis on the pattern evolution and influencing factors of China's high-tech industry development level [J]. Resources and Environment in the Yangtze Basin, 2014, 23(12):1649-1658.
[9]. ESH Company. (2019-2023). ESH Company. Annual Report. http://www.jsessh.com/tzzguanxi/qiyegonggao/
[10]. Nissm.K.Financial Analysis Fundament for Assessment the Company Value [J]. Utms Journal of Economics, 2014:332-340.
[11]. Al-Mwalla, The Impact of Working Capital Management Policies on Firm’s Profitability and Value: The Case of Jordan [J]. International Research Journal of Finance and Economics, 2011(85).
[12]. Bodie Z. Making Investment Choices as Simple as Possible, but Not Simpler [J]. Financial Analysts Journal, 2007, 63(3):42-47.