


1. Introduction
Gold has long been regarded as a cornerstone of the global financial system, serving as a store of value, a hedge against inflation, and a haven during economic uncertainty. Its historical significance and intrinsic value have made it a key asset for individuals, institutions, and governments. However, in an increasingly interconnected global economy, the dynamics surrounding Gold are influenced by various financial and economic factors. As markets evolve and become more complex, understanding the multifaceted relationships between Gold and other critical variables has become a subject of growing importance. This study investigates the potential correlations between Gold prices and key variables such as Crude Oil and Natural Gas. It further examines how these relationships impact overall economic performance and market behavior, aiming to provide a clear and comprehensive understanding of Gold's role within the broader financial and economic system.
This study focuses on Gold as the central subject, aiming to investigate its relationships with other key financial and economic variables. The objective is to understand how Gold interacts with elements such as Crude Oil, Natural Gas, the NASDAQ 100 Index (NDX), U.S. Treasury Bonds, the U.S. Dollar Index, the Import and Export Index, and the Housing Price Index. The study uses advanced statistical techniques like Vector Auto Regression (VAR) modeling to capture the complexity of these interactions and assess how changes in Gold can influence other variables, ultimately affecting overall economic performance and market.
Understanding these variables is crucial for various stakeholders. In a globalized economy, financial assets are intertwined, and recognizing these relationships can help predict market changes and manage risks more effectively. For policymakers, the insights gained from this research can inform the development of sound economic policies that account for the ripple effects of changes across different variables. Additionally, investors can leverage this knowledge to enhance portfolio management and make strategic decisions in response to economic shifts. By investigating these relationships, this study contributes to a deeper understanding of financial performance dynamics, facilitating more informed and effective policy and investment strategies.
Previous studies on the interdependencies of gold prices with economic variables have yielded mixed results. While some studies established long-run relationships between gold prices and the U.S. retail price index, others found that fluctuations in gold prices have little impact on other economic factors [1].
Energy markets, particularly oil and natural gas, play a critical role in shaping financial markets [2]. For example, Ikhlaas Gurrib's research highlights the Energy Futures Conditions Index as a predictive tool for forecasting the NASDAQ Composite Index, reflecting the importance of energy-related indicators in financial market analysis [3]. Furthermore, Farhat’s findings suggest a positive relationship between oil and gold prices, indicating that changes in energy markets may have direct implications for gold prices [4].
In addition to energy markets, the U.S. Dollar Index (DXY) also plays a crucial role in influencing gold prices. As Rajesh proposed, there is a significant positive correlation between the U.S. dollar exchange rate and gold prices [5]. Movements in the Dollar Index impact global financial markets, influencing trade balances, inflation, and economic growth, all of which may indirectly shape investor sentiment toward gold as a safe-haven asset.
Given the interconnections between energy-related variables, the NASDAQ index, and the U.S. Dollar Index, this study aims to investigate whether energy market dynamics, particularly oil and natural gas prices, exhibit a significant correlation with gold prices. Understanding these relationships is crucial for comprehending gold’s role as a hedge against inflation and economic volatility.
By examining the interrelationships between energy prices, the NASDAQ index, the U.S. dollar index and gold prices, this study seeks to uncover potential linkages that could provide valuable insights for investors and policymakers. Understanding how movements in energy markets influence both the NASDAQ and gold prices could enrich the existing literature on asset correlations and enhance strategic decision-making in investment portfolios. Thus, this research to elucidate these relationships, contributing to a more nuanced understanding of the interconnectedness of financial and commodity markets.
2. Variable Introduction
Table 1: Variable introduction
Gold | A precious metal viewed as a safe-haven asset, with its price influenced by inflation, geopolitical risks, and economic uncertainty; a key indicator of market sentiment. |
Crude Oil | A critical energy resource with price fluctuations driven by supply-demand dynamics, OPEC policies, and geopolitical events, significantly impacting the global economy. |
Natural Gas | Essential for electricity generation and heating; increasingly important as a transition fuel toward cleaner energy; prices affected by weather and market competition. |
NASDAQ 100 Index (NDX) | Tracks the performance of 100 large non-financial companies, primarily in technology; serves as a vital indicator for investor insights into growth and innovation. |
U.S. Treasury Bonds | Safe investments with yields reflecting market expectations for interest rates and economic growth; serve as benchmarks for other interest rates. |
U.S. Dollar Index (DXY) | Measures the dollar's value against a basket of currencies, indicating its strength in the global market and influencing trade and capital flows. |
Import Index (IR) | Reflects trade activity and economic openness; provides insights into consumer demand and production capacity. |
Export Index (IQ) | Reflects trade activity and economic openness; provides insights into production capacity and trade competitiveness |
Housing Price Index | Assesses the health of the real estate market, directly affecting household wealth and consumer behavior; plays a crucial role in economic policymaking. |
Table 1 shows the variable. Together, these variables create a comprehensive picture of economic performance and dynamics. Understanding the interplay among these indicators is essential for analyzing market trends and making more informed economic decisions.
The data utilized in this study is sourced from the Federal Reserve Economic Data (FRED) database and the Yahoo finance database. FRED (Federal Reserve Economic Data) and Yahoo Finance are two highly reliable databases that serve distinct purposes in economic and financial analysis. FRED, maintained by the Federal Reserve Bank of St. Louis, offers a comprehensive range of economic data, including key indicators such as GDP, inflation rates, and employment figures, sourced from credible institutions, ensuring accuracy and regular updates. In contrast, Yahoo Finance provides a wealth of financial information, including stock quotes, historical prices, and company fundamentals, making it a vital resource for investors. Its reputable platform aggregates data from various reliable financial institutions, enhancing its credibility. Both FRED and Yahoo Finance are trusted by researchers, policymakers, and investors due to their authoritative sources, comprehensive coverage, and commitment to providing timely and accurate information.
3. Model building
3.1. Simple Linear Model (md1)
\( gold=IQ.l1+IR.l1+bounds.l1+HPI.l1+gas.l1+oil.l1+gold.l1+ndx.l1+dxy.l1+const \) (1)
The initial model, referred to as md1, utilized a linear regression approach to analyze the relationship between the Gold and a selection of independent variables. This model aimed to identify significant predictors influencing Gold returns and provided insights into their impacts through statistical metrics. While the first model employed simple linear regression, analysis of the Auto-correlation Function (ACF)[figure 1] and Partial Auto-correlation Function (PACF)[figure 2] indicated that this model exhibits strong time series characteristics.
3.2. Stepwise Regression Model (md2)
In the second iteration, using a stepwise regression model, employing backward elimination to refine the set of predictors. This methodology allowed the removal of the least significant variables, resulting in a more parsimonious model. By focusing on the most impactful factors, md2 aimed to enhance interpretability and predictive power, offering a clearer understanding of key influencers on Gold.
The analysis aims to identify optimal model variables based on the Akaike Information Criterion (AIC), which assesses the relative quality of statistical models for a given dataset. A lower AIC value indicates a better model fit compared to other models when comparing them to the same dataset.
If a simple linear regression analysis reveals a time series pattern in your data, then switching to a Vector Auto-regressive (VAR) model is a good choice because VAR models are specifically designed to handle relationships between multiple time series variables, allowing people to capture the dynamic interactions and dependencies within dataset over time, which a simple linear regression cannot fully account for.
3.3. VAR Model (md3)
\( gold=bounds.l1+HPI.l1+oil.l1+gold.l1+ndx.l1+dxy.l1+const(VAR1) \) (2)
\( gold=bounds.l1+HPI.l1+oil.l1+gold.l1+ndx.l1+dxy.l1+bounds.l2+HPI.l2+oil.l2+gold.l2+ndx.l2+dxy.l2+const(VAR2) \) (3)
\( gold=HPI.l1+gold.l1+ndx.l1+dxy.l1+const(md5) \) (4)
The final model, designated as md3, transitioned to a Vector Auto Regression (VAR) model. This approach marked a significant shift from univariate analysis to a framework that simultaneously examines multiple interdependent time series variables. The VAR model captures dynamic relationships over time, allowing for the analysis of how shocks to one variable may influence others. By employing this methodology, md3 facilitates a comprehensive understanding of interconnected financial indicators, enriching the analysis beyond the previous regression models. The VAR approach enables a deeper exploration of economic relationships, making it more suitable for examining the complexities of interconnected financial indicators compared to the initial models.
3.4. Interpretation of Result
Here are the results for ACF and PACF for the simple linear model. Figure 1 for the residuals of the initial model (md1) reveals a gradual decline in auto-correlation values over the lags, indicating the presence of a persistent pattern in the residuals. This exponential decay suggests that the model may not have fully captured the underlying temporal structure of the data, as significant auto-correlation is observed, particularly within the first few lags. The dashed blue lines in the plot represent confidence intervals, and if any bars extend beyond these thresholds, it implies significant auto-correlation at those lags. Such findings suggest that the model may be misspecified or that important lagged relationships have been overlooked. Therefore, addressing these issues through further model refinement, potentially by employing more complex approaches like Vector Auto Regression (VAR), is crucial for improving the model's fit, predictive power, and reliability.
Figure 2 for the residuals of the initial model (md1) provides valuable insights into the serial relationships present in the data. Unlike the ACF, which measures the correlation between a time series and its past values, the PACF focuses on the correlation of the residuals after removing the effects of shorter lags. In this plot, the x-axis represents the lag order, while the y-axis displays the partial autocorrelation coefficients.
The dashed blue lines indicate the confidence intervals; any bars extending beyond these lines signify statistically significant autocorrelation at those lags. This indicates that the model may be misspecified, pointing to the necessity of including additional lagged terms or exploring more complex modeling approaches like Vector Auto Regression (VAR). Addressing these issues is vital for enhancing the model’s accuracy and reliability in capturing the dynamics of the underlying time series.
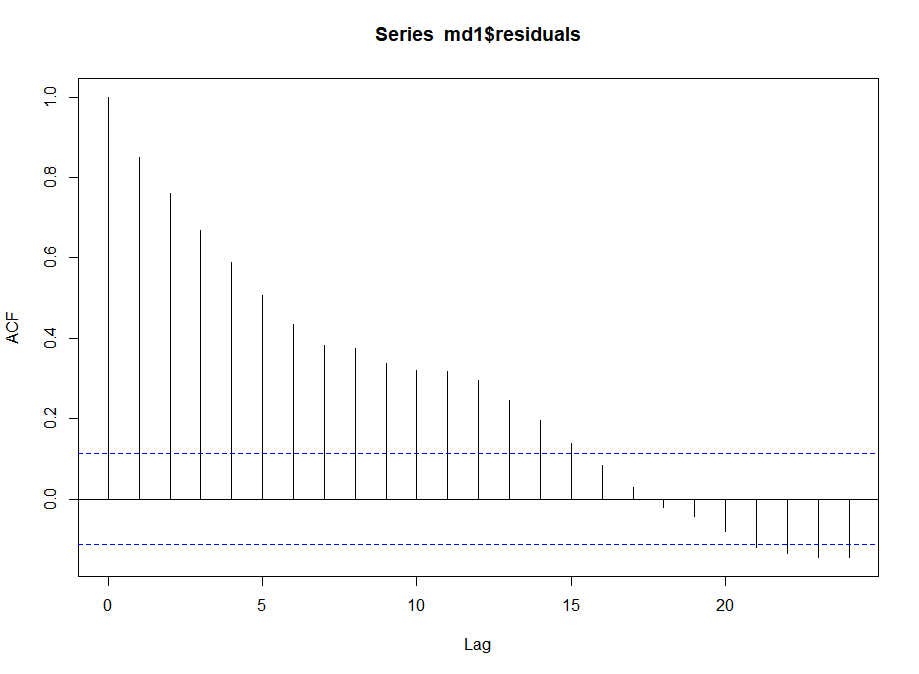
Figure 1: ACF
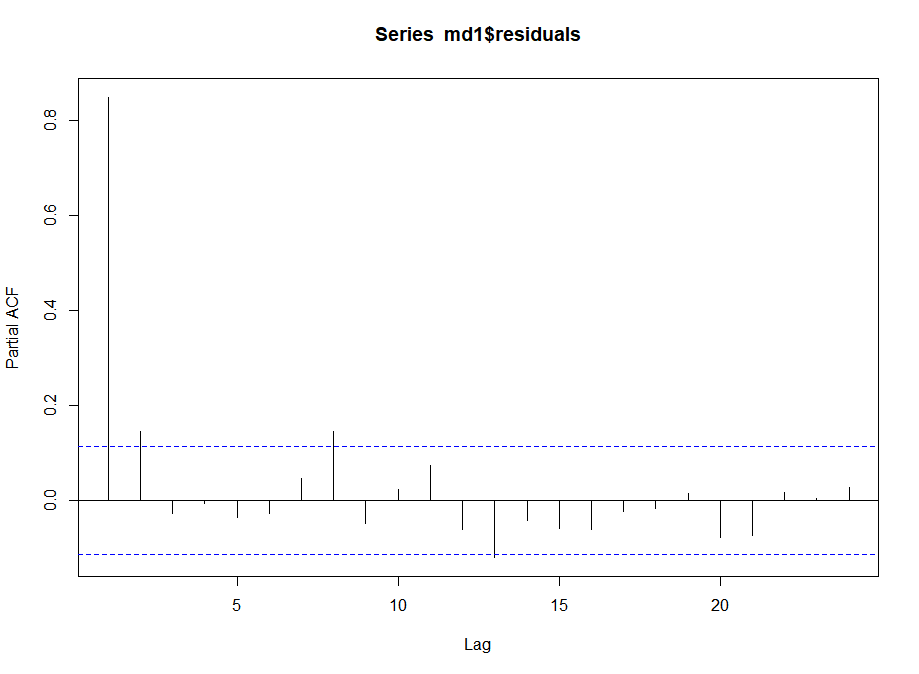
Figure 2: Partial ACF
The study uses stepwise regression based on the Akaike Information Criterion (AIC) to select variables for the model. The dependent variable is Gold prices, while the initial independent variables include Import Price Index (IR), Export Price Index (IQ), U.S. Treasury Bonds, House Price Index (HPI), gas prices, oil prices, the U.S. Dollar Index (DXY), and the NASDAQ index (NDX). The variable with the least significance is removed iteratively through backwards elimination to reduce the AIC value and improve model fit. The initial AIC value of the model is 2323.27, and after removing U.S. Treasury Bonds, the final AIC value decreases slightly to 2321.75. The difference between the two AIC values is minimal, indicating limited optimization. Therefore, the study does not visually represent the AIC changes but instead relies on AIC criteria to select significant variables for model simplification and interpretability.
Subsequent steps consider the removal of other variables (e.g., NASDAQ and U.S. Dollar Index). Each removal adjusts the residual sum of squares (RSS) and the AIC, allowing the analysis to identify the combination of variables that best explains the variations in Gold returns while maintaining simplicity. The summary of the stepwise model will ultimately provide the refined set of variables retained for the final model. The goal of this stepwise approach is to maximize predictive accuracy for Gold by retaining only the most relevant predictors. The output demonstrates an effective model refinement process through backward elimination of variables based on AIC values. This systematic approach ensures the final model is parsimonious while accurately capturing the dynamics influencing Gold returns. Further steps will include fitting the Vector Auto Regression (VAR) model with the selected variables to explore their inter-dependencies and impact comprehensively. Meanwhile Wang's paper concludes that the VAR model is a robust analytical instrument for predicting gold futures prices, offering substantial support for strategic financial decision-making [6].
Table 2: md3, var1
gold = bounds.l1 + HPI.l1 + oil.l1 + gold.l1 + ndx.l1 + dxy.l1 + const |
Estimate Std. Error t value Pr(>|t|) |
bounds.l1 4.968e-01 4.338e-01 1.145 0.2530 |
HPI.l1 4.940e-02 2.665e-02 1.854 0.0648 . |
oil.l1 -7.657e-04 4.521e-02 -0.017 0.9865 |
gold.l1 9.978e-01 8.635e-03 115.559 < 2e-16 *** |
ndx.l1 -1.693e+01 1.474e+01 -1.149 0.2515 |
dxy.l1 -2.414e+02 4.495e+01 -5.372 1.61e-07 *** |
const -8.441e+00 6.104e+00 -1.383 0.1678 |
--- |
Signif. codes: 0 ‘***’ 0.001 ‘**’ 0.01 ‘*’ 0.05 ‘.’ 0.1 ‘ ’ 1 |
Residual standard error: 16.49 on 289 degrees of freedom |
Multiple R-Squared: 0.9933, |
F-statistic: 7174 on 6 and 289 DF, p-value: < 2.2e-16 |
In the VAR model (md3, var1), Gold is significantly influenced by two primary variables: its lagged value (gold.l1) and the U.S. Dollar Index (dxy.l1). The coefficient for gold.l1 is 0.9978, with a highly significant p-value (< 0.0000), indicating a strong positive relationship where past Gold prices substantially impact current prices. Additionally, the U.S. Dollar Index exhibits a significant negative effect on Gold, with a coefficient of -241.4 and a p-value of 0.0000, suggesting that increases in the dollar's value correlate with decreases in Gold prices, as shown in table 2. These findings underscore the critical dynamics influencing Gold, highlighting the importance of its historical prices and fluctuations in the U.S. dollar within the broader economic context.
Table 3: md3, var2
gold = bounds.l1 + HPI.l1 + oil.l1 + gold.l1 + ndx.l1 + dxy.l1 + bounds.l2 + HPI.l2 + oil.l2 + gold.l2 + ndx.l2 + dxy.l2 + const | |
Estimate Std. Error t value Pr(>|t|) | |
bounds.l1 1.86708 1.89993 0.983 0.3266 | |
HPI.l1 -1.03840 0.78715 -1.319 0.1882 | |
oil.l1 0.06680 0.20014 0.334 0.7388 | |
gold.l1 0.97348 0.05915 16.458 < 2e-16 *** | |
ndx.l1 -16.26819 15.47561 -1.051 0.2941 | |
dxy.l1 -238.42112 46.12608 -5.169 4.47e-07 *** | |
bounds.l2 -1.52894 1.82252 -0.839 0.4022 | |
HPI.l2 1.08510 0.78281 1.386 0.1668 | |
oil.l2 -0.10545 0.20514 -0.514 0.6076 | |
gold.l2 0.02942 0.05996 0.491 0.6240 | |
ndx.l2 15.75379 16.64663 0.946 0.3448 | |
dxy.l2 -83.30579 48.43550 -1.720 0.0865 . | |
const -5.70347 6.98643 -0.816 0.4150 | |
--- | |
Signif. codes: 0 ‘***’ 0.001 ‘**’ 0.01 ‘*’ 0.05 ‘.’ 0.1 ‘ ’ 1 | |
Residual standard error: 16.48 on 282 degrees of freedom | |
Multiple R-Squared: 0.9935, | Adjusted R-squared: 0.9932 |
F-statistic: 3565 on 12 and 282 DF, p-value: < 2.2e-16 |
In the VAR model (md3, var2) as the image above shown Table 3, the Gold is significantly influenced by two key variables: its own lagged value (gold.l1) and the U.S. Dollar Index (dxy.l1). The coefficient for gold.l1 is 0.9735, with a highly significant p-value (< 0.0000), indicating a strong positive relationship where past gold prices heavily influence current prices. Additionally, the U.S. Dollar Index shows a substantial negative impact on Gold, with a coefficient of -238.4211 and a significant p-value (0.0000), suggesting that an increase in the dollar's value is associated with a decrease in Gold prices. These findings highlight the critical dynamics that govern Gold's in the context of broader economic conditions.
Table 4: md5
gold = HPI.l1 + gold.l1 + ndx.l1 + dxy.l1 + const | |
Estimate Std. Error t value Pr(>|t|) | |
HPI.l1 3.731e-02 2.288e-02 1.630 0.104 | |
gold.l1 9.984e-01 6.692e-03 149.201 < 2e-16 *** | |
ndx.l1 -1.862e+01 1.463e+01 -1.273 0.204 | |
dxy.l1 -2.434e+02 4.481e+01 -5.431 1.18e-07 *** | |
const -3.708e+00 3.318e+00 -1.118 0.265 | |
--- | |
Signif. codes: 0 ‘***’ 0.001 ‘**’ 0.01 ‘*’ 0.05 ‘.’ 0.1 ‘ ’ 1 | |
Residual standard error: 16.47 on 291 degrees of freedom | |
Multiple R-Squared: 0.9933, | Adjusted R-squared: 0.9932 |
F-statistic: 1.078e+04 on 4 and 291 DF, p-value: < 2.2e-16 |
In the VAR model (md5) shown as table 4, the Gold is significantly influenced by two key variables: its own lagged value (gold.l1) and the U.S. Dollar Index (dxy.l1). The coefficient for gold.l1 is 0.9984, with a highly significant p-value (< 0.0000), indicating a strong positive relationship where past Gold prices heavily influence current prices. Additionally, the U.S. Dollar Index exhibits a notable negative impact on Gold, with a coefficient of -243.4 and a very significant p-value (0.0000), suggesting that an increase in the dollar's value corresponds to a decrease in Gold prices. These findings highlight the critical dynamics that govern Gold within the broader economic context, emphasizing the importance of both its historical prices and fluctuations in the dollar's strength.
4. Summary of Results
The analysis conducted across three different VAR models (md3 var1, md3 var2, and md5) consistently reveals that Gold prices are significantly influenced by their own lagged values and the U.S. Dollar Index. In all models, the coefficient for the lagged Gold price (gold.l1) is consistently high and statistically significant, indicating a strong positive relationship where past Gold prices substantially affect current prices. Additionally, the U.S. Dollar Index demonstrates a significant negative impact on Gold prices, with substantial coefficients and highly significant p-values in each model. This relationship suggests that increases in the value of the dollar are associated with decreases in Gold prices across various model specifications.
5. Limitations Analysis
This study investigates the dynamic relationships between Gold and several key financial and economic variables, including Crude Oil, Natural Gas, the NASDAQ 100 Index, U.S. Treasury Bonds, the U.S. Dollar Index, and the Housing Price Index, employing statistical models such as Vector Auto Regression (VAR). Results reveal that Gold prices are significantly influenced by their lagged values and the U.S. Dollar Index, with a notable negative correlation between Gold and the dollar, highlighting the dollar's strength as a determinant in Gold's valuation. The study also emphasizes Gold's role as a safe-haven asset and its strong self-predictive nature, as past prices heavily shape current values. The analysis leverages comprehensive data from reliable sources like the Federal Reserve Economic Data (FRED) and Yahoo Finance, ensuring the robustness of the findings. These insights contribute to the understanding of Gold's interplay with broader macroeconomic variables, offering valuable implications for investors and policymakers in managing risks and designing informed strategies. However, the study focuses on historical data over a specific period and primarily analyzes U.S.-centric economic indicators. Consequently, the findings may not be directly applicable to other timeframes or global contexts where different economic and financial dynamics prevail. To address these limitations, future research could explore non-linear models or machine learning techniques to capture complex relationships better, expand the analysis to include a broader set of global indicators and regional variables, investigate the impact of geopolitical events and policy changes on Gold prices, examine sector-specific interactions, particularly in energy-intensive industries, and assess the long-term stability of the observed relationships over multiple economic cycles. While this research enhances the comprehension of Gold’s relationships within economic dynamics, these additional avenues of exploration would further refine predictive accuracy and broaden the applicability of the findings.
The dynamic relationship among gold prices, crude oil prices, the US dollar rate, and the stock market(GODS) remains a critical area of analysis, especially in the context of ongoing global economic and geopolitical challenges. Additionally, gold price volatility is closely linked to economic risk, influencing investor decisions during uncertain times. Lis Andriani's study using the VAR(1) model demonstrated its effectiveness in analyzing causality and accurately forecasting gold price trends, providing valuable insights for investment decision-making [7]. In light of current international tensions, such as energy supply uncertainties due to conflicts and sanctions, fluctuations in commodity prices, and divergent monetary policies among major economies, the interplay among these variables continues to influence financial markets significantly. Drawing parallels with the 2008 financial crisis, the current environment underscores the need for robust financial models to understand short-term and long-term causality, as the interconnectedness of GODS variables can have profound implications for economic stability and investment strategies worldwide [8].
6. Conclusion
These findings comprehensively illustrate the critical dynamics driving Gold prices within the broader economic landscape. The persistent significance of the lagged Gold variable underscores the importance of historical price movements in shaping current market behavior. Concurrently, the strong negative correlation with the U.S. Dollar Index highlights the influence of currency strength on Gold, reinforcing its role as a safe-haven asset in times of economic uncertainty. Understanding these relationships is essential for investors and policymakers as they navigate the complexities of financial markets. This research contributes to a deeper comprehension of the interplay between Gold and macroeconomic variables, paving the way for more informed investment strategies and economic policy decisions.
References
[1]. Ikhlaas, G. (2018). The relationship between the nasdaq composite index and Energy Futures Markets. Investment Management and Financial Innovations. Retrieved from https://www.businessperspectives.org/journals/ investment-management-and-financial-innovations/issue-298/the-relationship-between-the-nasdaq-composite-index-and-energy-futures-markets
[2]. Akbar, M., Iqbal, F., Noor, F. (2019). Bayesian Analysis of Dynamic Linkages Among Gold Price, Stock Prices, Exchange Rate and Interest Rate in Pakistan. Resources Policy. 62, 154-164.
[3]. Khalilian, P., Azizi, S., Amiri, M. H., Firouzjaee, J. T. (2022) Design Interpretable Experience of Dynamical Feed Forward Machine Learning Model for Forecasting NASDAQ. arXiv.org.
[4]. Farhat, S., Ghalayini, L. (2020) Modeling and Forecasting Gold Prices. Journal of Economics and Business. .
[5]. Rajesh, R., Bansal, A. (2019) Impact of Macroeconomic Variables on the Prices of Gold. Journal of emerging technologies and innovative research.
[6]. Andriani, L., Kesumah, F., Firdaus, L. (2023) Causality Test on Gold Prices and Economic Risk (Var Model Application). Asian Journal of Economics and Business Management.
[7]. Singh, N., & Sharma, S. (2018) Cointegration and Causality among Dollar, Oil, Gold and Sensex across Global Financial Crisis. Vision: The Journal of Business Perspective, 22, 365 - 376.
[8]. Wang, Z. (2024) Forecasting Gold Futures Prices: An Empirical Analysis Using the Vector Autoregression Model. Advances in Economics, Management and Political Sciences.
Cite this article
Lu,Y. (2025). Predicting Gold Prices: Interactions with Energy Markets, Currencies, and Equity Indices. Advances in Economics, Management and Political Sciences,167,1-9.
Data availability
The datasets used and/or analyzed during the current study will be available from the authors upon reasonable request.
Disclaimer/Publisher's Note
The statements, opinions and data contained in all publications are solely those of the individual author(s) and contributor(s) and not of EWA Publishing and/or the editor(s). EWA Publishing and/or the editor(s) disclaim responsibility for any injury to people or property resulting from any ideas, methods, instructions or products referred to in the content.
About volume
Volume title: Proceedings of the 4th International Conference on Business and Policy Studies
© 2024 by the author(s). Licensee EWA Publishing, Oxford, UK. This article is an open access article distributed under the terms and
conditions of the Creative Commons Attribution (CC BY) license. Authors who
publish this series agree to the following terms:
1. Authors retain copyright and grant the series right of first publication with the work simultaneously licensed under a Creative Commons
Attribution License that allows others to share the work with an acknowledgment of the work's authorship and initial publication in this
series.
2. Authors are able to enter into separate, additional contractual arrangements for the non-exclusive distribution of the series's published
version of the work (e.g., post it to an institutional repository or publish it in a book), with an acknowledgment of its initial
publication in this series.
3. Authors are permitted and encouraged to post their work online (e.g., in institutional repositories or on their website) prior to and
during the submission process, as it can lead to productive exchanges, as well as earlier and greater citation of published work (See
Open access policy for details).
References
[1]. Ikhlaas, G. (2018). The relationship between the nasdaq composite index and Energy Futures Markets. Investment Management and Financial Innovations. Retrieved from https://www.businessperspectives.org/journals/ investment-management-and-financial-innovations/issue-298/the-relationship-between-the-nasdaq-composite-index-and-energy-futures-markets
[2]. Akbar, M., Iqbal, F., Noor, F. (2019). Bayesian Analysis of Dynamic Linkages Among Gold Price, Stock Prices, Exchange Rate and Interest Rate in Pakistan. Resources Policy. 62, 154-164.
[3]. Khalilian, P., Azizi, S., Amiri, M. H., Firouzjaee, J. T. (2022) Design Interpretable Experience of Dynamical Feed Forward Machine Learning Model for Forecasting NASDAQ. arXiv.org.
[4]. Farhat, S., Ghalayini, L. (2020) Modeling and Forecasting Gold Prices. Journal of Economics and Business. .
[5]. Rajesh, R., Bansal, A. (2019) Impact of Macroeconomic Variables on the Prices of Gold. Journal of emerging technologies and innovative research.
[6]. Andriani, L., Kesumah, F., Firdaus, L. (2023) Causality Test on Gold Prices and Economic Risk (Var Model Application). Asian Journal of Economics and Business Management.
[7]. Singh, N., & Sharma, S. (2018) Cointegration and Causality among Dollar, Oil, Gold and Sensex across Global Financial Crisis. Vision: The Journal of Business Perspective, 22, 365 - 376.
[8]. Wang, Z. (2024) Forecasting Gold Futures Prices: An Empirical Analysis Using the Vector Autoregression Model. Advances in Economics, Management and Political Sciences.