


1. Introduction
A firm is considered vertically integrated when it combines two distinct single-output production processes under its operations, meeting either of the following conditions: The upstream division's complete output serves as either a partial or full supply of a specific intermediate input required for the downstream production stage; The downstream division exclusively sources a particular intermediate input – either partially or entirely – from the upstream division's production output [1].
Some studies look at the impact of vertical integration on only one aspect of the firm, such as the cost of equity [2]. Some scholars have studied the impact of upstream and downstream competition on vertical integration, but have not examined what changes the strategy would bring to the business [3]. There is a lack of research on vertical integration in terms of influencing factors affecting the competitiveness of firms, and more attention has been paid to the use of fintechs [4]. This paper explores the relationship between vertical integration and the multifaceted competitiveness of firms is a novel perspective. It will also mention that very few articles focus on the chains that play a role in the competitiveness of firms.
BYD has been engaged in a vertically integrated strategy for a longer period of time, while it has achieved good results in the fiercely competitive new energy neighbourhood. According to BYD's 2023 financial report, the company sold a total of 3,024,400 units in 2023, making it the world's highest-selling new energy vehicle company [5]. In this paper, the author will analyse BYD's financial statements in depth, and explore in which areas the vertical integration of the enterprise makes BYD more competitive compared with its peers by calculating some financial data. Based on BYD's financial statements and other research reports, this paper will explore the positive effects of its vertical integration strategy in enhancing the competitiveness of the company, and at the same time consider whether it has not performed satisfactorily in other areas. This study reveals how vertical integration enhances corporate competitiveness through differentiated mechanisms of "forward integration boosting sales and backward integration optimizing production," providing a decision-making basis for manufacturing firms to implement integration strategies and offering significant practical value for optimizing resource allocation.
2. Literature review
2.1. Vertical integration and drivers
Vertical integration can be further divided into forward and backward integration. Forward integration refers to a firm expanding downstream in its supply chain to control sales and distribution, while backward integration refers to a firm expanding upstream in its supply chain to control raw materials and production processes [6]. Vertical integration remains contested in strategic management research. Proponents emphasize its dual advantages in risk mitigation and value creation. During economic turbulence, this strategy strengthens organizational resilience through enhanced supply chain coordination [7], particularly when contractual enforcement mechanisms prove inadequate [8]. Industrial network analyses reveal that intensified market interdependencies positively correlate with cross-sector M&A activities [9]. Financially, integrated operations enable automotive firms to reduce capital costs via internalized transactions [10], while capturing synergistic value across production stages to boost profit margins [11]. These mechanisms collectively optimize resource allocation efficiency, translating operational synergies into measurable valuation premiums.
2.2. The analytical framework
Vertical integration involves the control of firms both upstream and downstream of the supply chain. First, for backward integration, firms can not only enable scale effects to be realised within the group and reduce information asymmetry between firms upstream and downstream of a supply chain, but also promote innovation by firms. Second, another important advantage of vertical integration is the reduction of information asymmetry. Through vertical integration, enterprises can have more direct contact with the situation of the supplying enterprises, and the risk of default is greatly reduced, thus lowering the transaction costs and the price of raw materials for enterprises.
Technological innovation is another benefit of vertical integration. By more efficiently integrating the capital, technology and talent they possess, companies can more effectively carry out technological innovation activities.
Forward integration of firms to establish their own sales channels and financial lending institutions allows firms to go directly to the consumer. There is no need to go through dealers, reducing mark-ups in the sales chain, and having a clear understanding of inventory speeds up the rate of return of corporate receivables. This can reduce the enterprise's financial pressure to enhance the competitiveness of the enterprise.
3. Case study of BYD
3.1. Content of BYD's vertical integration
BYD's supply chain layout in the new energy vehicle industry runs through the upstream, midstream and downstream of the industry as well as the aftermarket. The company's industry extends from raw materials and semiconductor production for battery manufacturing, to midstream automotive components such as batteries, motors, vehicle control systems, and finally vehicle assembly. As well as post-sales battery recycling, after-sales services and financial services.
In order to measure BYD's vertical integration, this paper draws on the methodology of Fan and Goyal: firstly, the input-output relationship between industries is calculated using the Input-Output Tables issued by the National Bureau of Statistics (NBS), and then the input-output relationship of the derived industries is substituted into Equation (3.1) to calculate BYD's degree of vertical integration [12].
\( (\sum _{i=1}^{n}{w_{i}}\sum _{i≠j}{v_{ij}})/(n-1) \) (1)
\( {w_{i}} \) is the share of industry i's revenue in the firm's total revenue, \( {v_{ij}} \) is the input-output relationship between industry i and industry j, and n is the firm's type of business. larger values of Integration indicate a higher degree of vertical integration. Since the Input-Output Table is not compiled annually, the input-output relationship for 2021-2023 corresponds to the Input-Output Table 2020 published by the National Bureau of Statistics [13]. In the three years 2021-2023, the combined number of BYD's automobile manufacturing and related products and electronic product manufacturing and related products is over 99%, so it is considered that n=2. The calculated value of 2021 is 0.0094, the value of 2022 is 0.0119, and the data of 2023 is 0.0125. It shows a continuous upward trend.
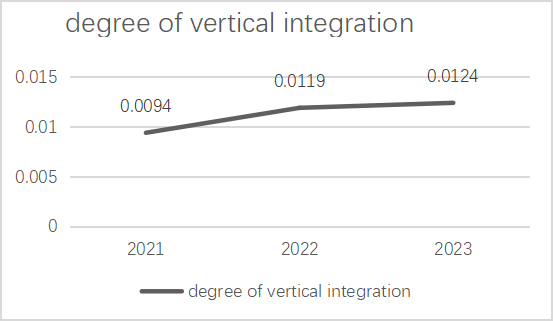
Figure 1: BYD's change in degree of vertical integration 2021-2023
3.2. Overall effect of vertical integration on firm competitiveness
This paragraph will explore whether vertical integration has actually improved BYD's competitiveness. This paper will draw on the research of Gu Feng et al [14] to measure the change in BYD's competitiveness in terms of sustainable growth rate (SGR) for the four years 2020-2023. The sustainable growth rate (SGR) is the growth rate that a firm's sales can achieve without issuing new shares and without changing its operational efficiency (net sales margin and asset turnover) and financial policy (equity multiplier and profit retention). A high SGR usually means that a company is able to effectively reinvest its earnings without relying on external financing to support growth [15]. If SGR is used to measure competitiveness, the formula is:
Sustainable Growth Rate = P \( × \) (1-D) \( × \) (1+L) \( ÷ \) (T - P (1-D) (1+L)) [16]
where: L = debt-to-equity ratio, T = total assets to sales ratio, P = net profit margin, D=dividend payout ratio
The calculation shows that BYD's data for 2020 is 0.09, for 2021 is 0.19, for 2022 is 0.33 and for 2023 is 0.25. Generally speaking, the upward trend is maintained. It can be seen that the competitiveness of BYD is rising steadily with the help of vertical integration strategy. Vertical integration helps to improve the overall competitiveness of the company.
4. The path of vertical integration to firm competitiveness
4.1. Backward integration
Backward integration allows BYD to control the supply chain system, and this section will explore whether a firm's control of the supply chain allows it to reduce costs, increase gross margins, improve R&D, and allow itself to take the lead in these areas.
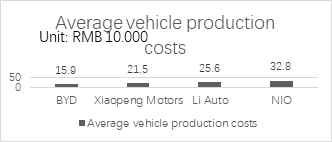
Figure 2: Average production cost of four car brands
4.1.1. Cost management capacity
Through the layout of the whole industry chain, BYD can effectively control costs. Dividing the production cost of a company by the number of cars sold by the company gets the unit production cost of a car. Firstly, comparing vertically, BYD's unit is about 257,500 in 2021, and falls to 188,000 in 2022, about 27%. And by 2023 the value further drops by 15.4% to 159k [5]. The effect of vertical integration can be seen to be significant. Meanwhile, a vertical comparison of China's new energy vehicle companies was conducted. According to Figure 2, Xiaopeng is the best-performing company besides BYD, but its value is still 215,000, 56,000 higher than that of BYD [17]. A comparison of unit production costs reveals that BYD ranks first in its ability to control the cost of a single vehicle.
4.1.2. Profit
The lower cost than peers allows BYD to gain more profit. Compared to other new energy automobile enterprises in the same period, BYD's gross profit margin reaches 20.21% in 2023, much higher than Xiaopeng's 1.47% [17], NIO's 5.5% [18], and lower than Li Auto's 22.2% [19]. Its gross profit margin is in the leading position in the electric vehicle field. Compared to traditional car companies, BYD is higher than Geely at 15.1%, much higher than SAIC at 10.19% [20], and Guangzhou Automobile at 6.9% [21]. Compared to itself, it can see that vertical integration brings a huge increase in gross margin. According to Figure 3, BYD's 2023 gross margin is higher than that of 2022 at 17.03%, which is almost double that of the 2021 gross margin [5].
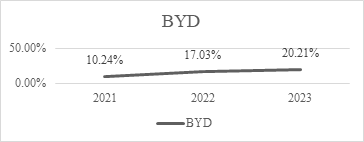
Figure 3: BYD's gross margin change 2021-2023
BYD's better control of vehicle costs means there is more room for price cuts and incentives.2024 At the beginning of the year, BYD announced price increases and price cuts for a number of models, ranging from a few thousand to 50,000 yuan. Affordable pricing has led to rising sales for BYD. in 2021, sales of all passenger cars were 73,093 units, up 75.4 per cent year-on-year. In 2022, car sales were 1,868,543 units, up 152.5 per cent year-on-year. Cmulative sales of new-energy vehicles were 3,024,417 units in 2023, an increase of 61.86 per cent year-on-year [5].
Vertical integration has given BYD more resources to invest in research and development. BYD's R&D expenses were $5.7 billion in 2021. By 2022, R&D expenses increased to $10 billion, up 75.43%, and in 2023, BYD's R&D investment grew steadily by 34% to $13.4 billion. BYD's R&D investment is higher than other new energy companies. [5] BYD is much higher than Xiaopeng's R&D investment of 5.3bn in 2023[17], Li Autoly 10.6bn, [19] which is basically the same as NIO [18]. BYD's performance in terms of the number of R&D patent applications in 2021, 2022, and 2023 is remarkable. In 2023, BYD's cumulative number of Chinese patent applications is 37,869, and its cumulative number of foreign patent applications is 10, 192.
In conclusion, backwards vertical integration allows enterprises to better control their own costs, reduce the production cost of products, increase the profit of a single product, while lowering costs to reduce prices to leave room for price reductions, price reductions so that enterprises can attract more consumers to buy, resulting in increasing sales. Vertical integration also helps to improve the company's scientific research strength.
4.2. Forward integration
Forward integration allowed BYD to establish its own sales channels and after-sales channels. In this section, some financial indicators will be analysed to examine whether the control of sales channels has contributed to the reduction of the cost of sales and the increase of the operating capacity of the company.
4.2.1. Sales capacity
BYD's backward integration significantly improves BYD's sales capacity. The most intuitive manifestation of BYD's improved sales capacity is that the business has lowered its own average car sales expenses (total sales expenses divided by car sales). BYD's average sales expense per vehicle is $3,420 in 2023, $460 lower than in 2022 and $670 lower than in 2021. It can be seen that vertical integration greatly improves sales capacity and reduces sales expenses [5]. Other new energy vehicle companies do not perform as well in this area, and in 2023, Xiaopeng has the highest value of 46,000 yuan, almost 13 times that of BYD [17]. Next is Li Auto at $25,970, [19] 7.6 times BYD's. And NIO also has $11,300 [18], 3.3 times that of BYD. It can be seen that forward vertical integration reduces BYD's selling expenses.
4.2.2. Operational capacity
Vertical integration, however, does not give BYD an advantage over other automakers in terms of inventory turnover and accounts receivable turnover.
Backward control of sales makes BYD's shipment speed slightly increased, inventory turnover ratio from 4.33 in 2021 to 4.47 in 2022, to 5.481 in 2023. but BYD is not outstanding in the industry, only slightly higher than the Peng 5.46, significantly lower than the Li Auto of 14 [19]and the NIO 9.96 [19]. can be seen that the vertical integration of the forward did not make BYD in the shipment speed of the peers. Outperform its peers. At the same time in the accounts receivable turnover ratio BYD's data is not particularly like Li Auto. BYD's accounts receivable turnover in 2021 is 5.97, rising sharply to 10.92 in 2022, but dropping to 9.73 in 2023. BYD's figure for 2023 is only about 2.01 higher than that of NIO, slightly lower than the Li Auto accounts receivable turnover ratio of 10.00 [5]. Xiaopeng has reached the highest value for new energy automobiles in this area, at 11.294 [17]. It is evident that forward integration has not brought BYD any improvement in terms of payback speed and cash flow. BYD has the speed of payback, shipping speed and strong degree of downstream enterprises to bring a huge advantage. Meanwhile, for traditional automakers, Changan's inventory turnover was 9.17 [22], SAIC's was 7.42 [20], and Guangzhou Auto's was only 7.1 [21]. As for accounts receivable turnover, Guangzhou Auto had a very high 22, SAIC was close to the level of new-energy automakers at 9.417, and Changan was at the bottom of the list with only 3.57 [22].
Vertical integration gives BYD an advantage in terms of asset turnover. BYD's asset turnover ratio is 0.73 in 2021, rising to 0.86 in 2022, an increase of 17.8%, and a slight increase of 2.3% in 2023 to 0.88. Other new-energy carmakers' asset turnover ratios are not as good as that of BYD. In addition to BYD, Li Auto's value is the highest at 0.86, 0.02 lower than BYD's [19]. Following Li Auto is NIO, with a value of 0.41 [19], about half of BYD's. The last is Xiaopeng, with a value of 0.41, about half of that of BYD. In last place is Xiaopeng with 0.36, showing that vertical integration has strengthened BYD's asset utilisation [17].
In conclusion, BYD's forward integration allows the company to control the sales channels and improve the sales capacity of the company. At the same time, the enterprise did not get a stronger payback speed and shipment speed, but the efficiency of the use of assets has risen. Vertical integration facilitates the scheduling of the overall resources of the enterprise, so the overall asset management efficiency of the enterprise has seen a huge increase. However, the model of selling through directly-managed shops did not significantly improve BYD's inventory management ability and payback speed.
5. Conclusion
This paper takes BYD as an example to analyse the issue of vertical integration on the role mechanism of corporate influence, and obtains the main research conclusions as follows: (1) Vertical integration helps to enhance the overall competitiveness of enterprises. (2) Vertical integration helps enterprises to reach the goal of improving overall competitiveness through backward integration to enhance the production cost control ability and enterprise research ability, and forward integration to enhance sales ability and asset ability. (3) Vertical integration does not help the enterprise to achieve the improvement in the two operating ability indicators, namely, the speed of payment back and the speed of shipment.
Based on the findings of this paper, the main management insights are obtained as follows: (1) Given that vertical integration does not lead to improvements in all aspects of the firm, firms should take a cautious approach when adopting this strategy. The strategy can play a positive role if the objectives are to reduce costs, improve research capabilities, enhance sales capacity, and achieve effective asset utilization. If the goal is to enhance the enterprise's ability to return payments and shipment speed, this strategy will not be able to play a prominent role. (2) There are differences in the effects of forward and backward integration, and enterprises should distinguish between them when adopting the strategy. For enterprises aiming to reduce production costs and improve research, backward integration is a better choice. If the goal is to achieve better asset management and sales capacity, forward integration is a better choice for enterprises.
References
[1]. Perry, M. K. (1989). Vertical integration: Determinants and effects. Handbook of industrial organization, 1, 183-255.
[2]. Raskin,,& Laura.(2013).Vertical integration.Architectural Record,201(6),199-203
[3]. Chemla,,& G.(2003).Downstream competition, foreclosure, and vertical integration.JOURNAL OF ECONOMICS & MANAGEMENT STRATEGY,12(2),261-289.
[4]. Tang,,Song,Chen,,Zejin,Chen,,Jiawei,Quan,,Lei,Guan,,& Kaiyang.(2023).Does FinTech promote corporate competitiveness? Evidence from China.FINANCE RESEARCH LETTERS,58.
[5]. BYD, 2023, UNITED STATES SECURITIES AND EXCHANGE COMMISSION. https://www.bydglobal.com/cn/Investor/InvestorAnnals.html
[6]. Lin, Y. T., Parlaktürk, A. K., & Swaminathan, J. M. (2014). Vertical integration under competition: Forward, backward, or no integration?. Production and Operations management, 23(1), 19-35.
[7]. Yu,,Zhen,Li,,Yuankun,Ouyang,,& Ziyi.(2021).Economic policy uncertainty, hold-up risk and vertical integration: Evidence from China.PACIFIC-BASIN FINANCE JOURNAL,68,101625-101625.
[8]. Fan,,Joseph,P.,H.,Huang,,Jun,Morck,,Randall,Yeung,,&Bernard.(2017).Institutional determinants of vertical integration in China.JOURNAL OF CORPORATE FINANCE,44,524-539. (https://www.sciencedirect.com/science/article/pii/S0929119914000662)
[9]. Ahern, Kenneth R., Harford, Jarrad( 2014). The importance of industry links in merger waves. J. Financ. 69 (2), 527–576. https://doi.org/10.1111/jofi.12122.
[10]. QIAN Xuesong, CHEN Xueli, WU Ruifang (2018). A comparative study on internal and external borrowing rates of enterprises. Journal of Xi'an Jiaotong University (Social Science Edition), 38(3), 45-66.(In Chinese)
[11]. GUAN Hua(2010). Vertical mergers in imperfectly competitive markets.Journal of Financial and Economic Theory and Practice, 2010, 31(2): 84-87. (In Chinese)
[12]. Fan,,JPH,Goyal,,& VK.(2006).On the patterns and wealth effects of vertical mergers.JOURNAL OF BUSINESS,79(2),877-902.
[13]. National Bureau of Statistics.2021.National input-output table for 2020.https://data.stats.gov.cn/ifnormal.htm?u=/files/html/quickSearch/trcc/trcc01.html&h=740
[14]. Gu Feng., Wang, Y. Z., Jiang, Y., & Ren, J. Y. (2024). ESG performance, R&D investment, and corporate competitiveness. Friends of Accounting, (14), 90–97. (In Chinese)
[15]. Fonseka, M. M., Ramos, C. G., & Tian, G. L. (2012). The most appropriate sustainable growth rate model for managers and researchers. Journal of Applied Business Research (JABR), 28(3), 481-500.
[16]. Naumoski, A. (2022). Financial Policy and Companies’ Sustainable Growth. Economic Themes, 60(3), 281-301.
[17]. XPeng, 2023, UNITED STATES SECURITIES AND EXCHANGE COMMISSION. https://ir.xiaopeng.com/static-files/4244ac4a-0b47-40ed-a0ca-b572e458d2fa
[18]. NIO, 2023, UNITED STATES SECURITIES AND EXCHANGE COMMISSION. https://ir.nio.com/static-files/b9974b9f-e057-41aa-be67-97f41e5c0d82
[19]. Li Auto, 2023, UNITED STATES SECURITIES AND EXCHANGE COMMISSION. https://ir.lixiang.com/static-files/44f4e7a8-cb0d-4742-b8c1-552e50a57f4c
[20]. SAIC, 2023, UNITED STATES SECURITIES AND EXCHANGE COMMISSION. https://www.saicmotor.com/chinese/images/tzzgx/ggb/dqgg/2023ndqgg/2024/3/29/C5303F0A7F774009828802E9562F73FB.pdf
[21]. GAC GROUP 2023, UNITED STATES SECURITIES AND EXCHANGE COMMISSION. https://img.gac.com.cn/topic/file/2024-03-28/1711628960099-2023%E5%B9%B4%E5%B9%B4%E5%BA%A6%E6%8A%A5%E5%91%8A.pdf
[22]. CHANGAN 2023, UNITED STATES SECURITIES AND EXCHANGE COMMISSION.b057648a293411e1305f1cf76a665c33.pdf
Cite this article
Wu,J. (2025). The Impact of Vertical Integration on Firm Competitiveness -- Case Study Based on BYD. Advances in Economics, Management and Political Sciences,186,140-146.
Data availability
The datasets used and/or analyzed during the current study will be available from the authors upon reasonable request.
Disclaimer/Publisher's Note
The statements, opinions and data contained in all publications are solely those of the individual author(s) and contributor(s) and not of EWA Publishing and/or the editor(s). EWA Publishing and/or the editor(s) disclaim responsibility for any injury to people or property resulting from any ideas, methods, instructions or products referred to in the content.
About volume
Volume title: Proceedings of ICMRED 2025 Symposium: Effective Communication as a Powerful Management Tool
© 2024 by the author(s). Licensee EWA Publishing, Oxford, UK. This article is an open access article distributed under the terms and
conditions of the Creative Commons Attribution (CC BY) license. Authors who
publish this series agree to the following terms:
1. Authors retain copyright and grant the series right of first publication with the work simultaneously licensed under a Creative Commons
Attribution License that allows others to share the work with an acknowledgment of the work's authorship and initial publication in this
series.
2. Authors are able to enter into separate, additional contractual arrangements for the non-exclusive distribution of the series's published
version of the work (e.g., post it to an institutional repository or publish it in a book), with an acknowledgment of its initial
publication in this series.
3. Authors are permitted and encouraged to post their work online (e.g., in institutional repositories or on their website) prior to and
during the submission process, as it can lead to productive exchanges, as well as earlier and greater citation of published work (See
Open access policy for details).
References
[1]. Perry, M. K. (1989). Vertical integration: Determinants and effects. Handbook of industrial organization, 1, 183-255.
[2]. Raskin,,& Laura.(2013).Vertical integration.Architectural Record,201(6),199-203
[3]. Chemla,,& G.(2003).Downstream competition, foreclosure, and vertical integration.JOURNAL OF ECONOMICS & MANAGEMENT STRATEGY,12(2),261-289.
[4]. Tang,,Song,Chen,,Zejin,Chen,,Jiawei,Quan,,Lei,Guan,,& Kaiyang.(2023).Does FinTech promote corporate competitiveness? Evidence from China.FINANCE RESEARCH LETTERS,58.
[5]. BYD, 2023, UNITED STATES SECURITIES AND EXCHANGE COMMISSION. https://www.bydglobal.com/cn/Investor/InvestorAnnals.html
[6]. Lin, Y. T., Parlaktürk, A. K., & Swaminathan, J. M. (2014). Vertical integration under competition: Forward, backward, or no integration?. Production and Operations management, 23(1), 19-35.
[7]. Yu,,Zhen,Li,,Yuankun,Ouyang,,& Ziyi.(2021).Economic policy uncertainty, hold-up risk and vertical integration: Evidence from China.PACIFIC-BASIN FINANCE JOURNAL,68,101625-101625.
[8]. Fan,,Joseph,P.,H.,Huang,,Jun,Morck,,Randall,Yeung,,&Bernard.(2017).Institutional determinants of vertical integration in China.JOURNAL OF CORPORATE FINANCE,44,524-539. (https://www.sciencedirect.com/science/article/pii/S0929119914000662)
[9]. Ahern, Kenneth R., Harford, Jarrad( 2014). The importance of industry links in merger waves. J. Financ. 69 (2), 527–576. https://doi.org/10.1111/jofi.12122.
[10]. QIAN Xuesong, CHEN Xueli, WU Ruifang (2018). A comparative study on internal and external borrowing rates of enterprises. Journal of Xi'an Jiaotong University (Social Science Edition), 38(3), 45-66.(In Chinese)
[11]. GUAN Hua(2010). Vertical mergers in imperfectly competitive markets.Journal of Financial and Economic Theory and Practice, 2010, 31(2): 84-87. (In Chinese)
[12]. Fan,,JPH,Goyal,,& VK.(2006).On the patterns and wealth effects of vertical mergers.JOURNAL OF BUSINESS,79(2),877-902.
[13]. National Bureau of Statistics.2021.National input-output table for 2020.https://data.stats.gov.cn/ifnormal.htm?u=/files/html/quickSearch/trcc/trcc01.html&h=740
[14]. Gu Feng., Wang, Y. Z., Jiang, Y., & Ren, J. Y. (2024). ESG performance, R&D investment, and corporate competitiveness. Friends of Accounting, (14), 90–97. (In Chinese)
[15]. Fonseka, M. M., Ramos, C. G., & Tian, G. L. (2012). The most appropriate sustainable growth rate model for managers and researchers. Journal of Applied Business Research (JABR), 28(3), 481-500.
[16]. Naumoski, A. (2022). Financial Policy and Companies’ Sustainable Growth. Economic Themes, 60(3), 281-301.
[17]. XPeng, 2023, UNITED STATES SECURITIES AND EXCHANGE COMMISSION. https://ir.xiaopeng.com/static-files/4244ac4a-0b47-40ed-a0ca-b572e458d2fa
[18]. NIO, 2023, UNITED STATES SECURITIES AND EXCHANGE COMMISSION. https://ir.nio.com/static-files/b9974b9f-e057-41aa-be67-97f41e5c0d82
[19]. Li Auto, 2023, UNITED STATES SECURITIES AND EXCHANGE COMMISSION. https://ir.lixiang.com/static-files/44f4e7a8-cb0d-4742-b8c1-552e50a57f4c
[20]. SAIC, 2023, UNITED STATES SECURITIES AND EXCHANGE COMMISSION. https://www.saicmotor.com/chinese/images/tzzgx/ggb/dqgg/2023ndqgg/2024/3/29/C5303F0A7F774009828802E9562F73FB.pdf
[21]. GAC GROUP 2023, UNITED STATES SECURITIES AND EXCHANGE COMMISSION. https://img.gac.com.cn/topic/file/2024-03-28/1711628960099-2023%E5%B9%B4%E5%B9%B4%E5%BA%A6%E6%8A%A5%E5%91%8A.pdf
[22]. CHANGAN 2023, UNITED STATES SECURITIES AND EXCHANGE COMMISSION.b057648a293411e1305f1cf76a665c33.pdf