


1. Introduction
Investors and portfolio managers in every corner of the globe face a persistent problem of attempting to profile an investment according to its associated risk class, factors affecting price movements, and other influences within a particular risk class in the scope of financial markets. The most basic or primal example of a problem in distinguishing price movements is the misallocation of capital. The ability to ascertain the level of risk associated with a stock is essential in the creation of a portfolio, management of risks, and formulation of investment strategies. Despite the fact that, volatility had been the predominant measure of risk for any financial security, considering other fundamental and technical marks of stock behavior provides an increased understanding about how stocks function under varied risk categories. This study that was undertaken sought to fend volatility by defining a clear in identifying a clearer approach to devising distinct categories of risk levels and determining which variables they used would affect price change within distinct categories. This can empower the investor’s tools in decision making across all types of market scenarios.
The role that classification of risk plays in portfolio management has arguably been a subject of importance ever since Markowitz’s work on modern portfolio theory [1]. There is other research that studies many other methods of categorizing risk. With the introduction of the Capital Asset Pricing Model, Sharpe deepened the comprehension of systematic risk [2]. More recent work has shifted towards multi-factor models, as with Fama and French’s three and five factor models which proved that not only market risk, but various other factors also explain returns [3]. Still, there was contention on what technical indicators are the most important across the various categories of risk. Lo and MacKinlay challenge the random walk hypothesis [4]. Ang and Bekaert contended that the ability to predict returns differ in various states of the market [5]. After all of that research, the answer on how the predictive ability of technical indicators changes with different risk categories, and what trading strategies these disparities could provide for different types of investors remained unanswered. Recent research has moved toward machine learning approaches for asset pricing [6]. Gu, Kelly, and Xiu showed that machine learning methods outperform traditional models in predicting returns [7].
To answer these questions, this study takes a quantitative approach with both fundamental and technical analyses for stock classification and behavior analysis. The research methodology includes a composite risk scoring system. It combines volatility with fundamental markers like the debt-to-equity ratio, market cap, dividend yield, and return on equity. This study classifies investments into conservative, regular, and aggressive risk profiles by analyzing 10 stocks from the U.S. market and the Standard & Poor’s 500 Exchange Traded Fund (SPY ETF) as a benchmark. Representative stocks from each category underwent time series analysis using ARIMA modeling to find the best parameter settings for model forecasting and accuracy determination. Additionally, the study explores the importance of various moving averages, Relative Strength Index (RSI), Moving Average Convergence Divergence (MACD), volatility, and Bollinger Bands in predicting returns for the three risk categories. The study aims to connect theoretical classification of risk with practical trading for diverse investment styles through detailed analysis.
2. Methodology
The research went through the following steps: data collection, feature extraction, stock categorization, time series analysis, and benchmarking. This research uses numerical metrics of risk. It would also analyze the movement of price over time relative to certain technical indicators. This could be more reliable in the context of statistical analysis.
The sample contains 10 publicly traded stocks from diverse sectors of the United States stock market. This would help to capture various levels of company size, industries, risks, and volatility. The chosen stocks were Apple (AAPL), Microsoft (MSFT), Amazon (AMZN), AMD, Tesla (TSLA), JPMorgan Chase (JPM), Johnson & Johnson (JNJ), Procter & Gamble (PG), Exxon Mobil (XOM), Verizon (VZ). These stocks are in the sectors of technology, financial sector, healthcare, consumer goods, energy, and telecommunications.
Additionally, SPY (S&P 500 ETF) was included as a market benchmark. The selection criteria focused on ensuring diversity in market capitalization, industry representation, and perceived market risk. Historical price data was collected from January 2020 to the present date, providing a comprehensive dataset that included both normal market conditions and periods of high volatility (such as the COVID-19 pandemic).
For the data collection and analysis process, historical pricing data which includes the open, high, low, close prices and volume were recorded for selected stocks from January 2020 until the most recent available date.
Several technical indicators were calculated as part of the analysis process. These included moving averages, 14-day RSI, MACD, Bollinger Bands (20 period with 2 standard deviations), and 20-day volatility calculated as rolling standard deviation of returns. Along with these indicators, the study simulated various fundamental metrics such as PE Ratio, Debt-to-Equity Ratio, Return on Equity, Market Capitalization and Dividend Yield due to limitations in accessing real-time fundamental data. These metrics were calculated based on industry standard ranges.
Using various metrics, a composite risk score was generated which contained standard deviation (σ), Debt-to-Equity ratio (D/E), Market Capitalization (MC), Dividend Yield (DY), and Return on Equity (ROE). Through this composite risk score, stocks were categorized into three risk categories: Conservative, Regular and Aggressive. For detailed time series analysis, representative stocks from each category were selected: Amazon (AMZN) for Conservative, Microsoft (MSFT) for Regular, and Apple (AAPL) for Aggressive.
ARIMA modeling was employed on each representative stock to optimize the parameters (p, d, q) based on Akaike Information Criterion (AIC) and Bayesian Information Criterion (BIC) values. Finally, for each risk category, the impacts of technical indicators were analyzed using return prediction linear regression models with returns (R) as the dependent variable and the technical indicators as independent variables.
The analysis was conducted in multiple phases, beginning with the calculation of a composite risk score using a specificformula:
|
(1) |
Where Avg Volatility is the average stock price volatility over the study period; Avg Debt Equity is the average debt-to-equity ratio; Avg Market Cap is the average market capitalization; Avg Dividend Yield is the average dividend yield; Avg ROE is the average return on equity; scale() represents standardization of the variable.
In categorizing stocks into the respective risk categories, breaks at the 33rd and 66th quantiles were used for three groups. For each representative stock's time series modeling, the ARIMA model was optimized using implementations of the Hyndman and Khandakar method [6]. This method consists of several unit root tests, AIC-based model selection, Maximum Likelihood Estimation (MLE), and numerous other criteria for model identification. To evaluate factor significance, a linear regression was conducted for each technical indicator, and the evaluation of influence was done via normalized coefficients with influence measuring via p-value where statistical significance was deemed acceptable. In order to perform a comparative analysis, historical estimations of stock volatility were used to calculate 20-day moving averages in order to benchmark volatility across varying risk categories. In conjunction, the evaluation of forecast accuracy sought to determine how predictable the ARIMA models were for each risk category calculated using the models in each risk category and measured using Mean Absolute Percentage Error (MAPE).
3. Results
3.1. Data presentation
The analysis classified the 11 stocks (including SPY) into three risk categories based on their risk scores, as shown in Figure 1. TSLA and AMD emerged as the most aggressive stocks with the highest risk scores, while SPY, JNJ, AMZN, and PG were classified as conservative investments. MSFT, XOM, and VZ fell into the regular risk category.
The risk classification aligned with general market perceptions. Growth-oriented technology companies like Tesla showing higher risk profiles. Established companies with stable business models like Johnson & Johnson displaying more conservative characteristics.
Figure 1 shows the risk score and classification for each stock. Negative scores indicated more conservative investments and positive scores representing more aggressiveones.
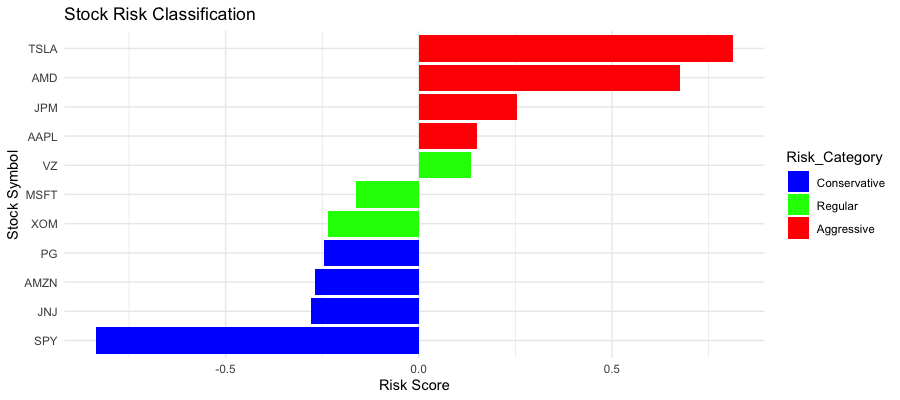
Figure 1: Stock risk classification
The fundamental characteristics that supported this classification are presented in Table 1. Table 1 shows average volatility, PE ratio, debt-to-equity ratio, ROE, market capitalization, and dividend yield for each stock.
|
Symbol |
Avg Volatility |
Avg PE |
Avg Debt-Equity |
Avg ROE |
Avg Market Cap (B) |
Avg Dividend Yield |
Risk Category |
|
TSLA |
0.0366 |
21.3 |
0.743 |
0.0710 |
155.0 |
0.0335 |
Aggressive |
|
AMD |
0.0304 |
20.2 |
1.39 |
0.191 |
356.0 |
0.0000 |
Aggressive |
|
JPM |
0.0151 |
15.9 |
1.02 |
0.0886 |
169.0 |
0.0216 |
Aggressive |
|
AAPL |
0.0166 |
12.2 |
1.47 |
0.220 |
58.0 |
0.0417 |
Aggressive |
|
VZ |
0.0124 |
11.4 |
1.03 |
0.161 |
219.0 |
0.0000 |
Regular |
|
MSFT |
0.0159 |
12.0 |
0.751 |
0.0876 |
385.0 |
0.0232 |
Regular |
|
XOM |
0.0176 |
13.7 |
0.511 |
0.146 |
195.0 |
0.0371 |
Regular |
|
PG |
0.0104 |
19.7 |
0.269 |
0.248 |
27.9 |
0.0000 |
Conservative |
|
AMZN |
0.0207 |
12.5 |
0.428 |
0.240 |
232.0 |
0.0194 |
Conservative |
|
JNJ |
0.0101 |
11.6 |
1.06 |
0.153 |
314.0 |
0.0235 |
Conservative |
|
SPY |
0.00997 |
28.0 |
0.278 |
0.146 |
512.0 |
0.0153 |
Conservative |
3.2. Volatility analysis and technical indicators
The composite risk score methodology successfully differentiated stocks into distinct risk categories. They aligned with general market perceptions. This classification provides a reliable framework for analyzing investment behaviors across different risk profiles.
As shown in Figure 2, the three risk categories displayed distinctly different volatility patterns over the 2021-2025 period. Aggressive stocks consistently show higher volatility, typically ranging between 0.025-0.035. They usually have more notable spikes reaching above 0.04 in 2022 and a dramatic increase to nearly 0.06 in early 2025. Conservative stocks maintained substantially lower volatility levels, generally between 0.01-0.015, demonstrating their relative stability during market fluctuations. Regular stocks occupied the middle ground with moderate volatility levels. All three categories showed synchronized patterns of volatility increases and decreases, though at different magnitudes, suggesting common market-wide influences affecting all risk categories simultaneously.
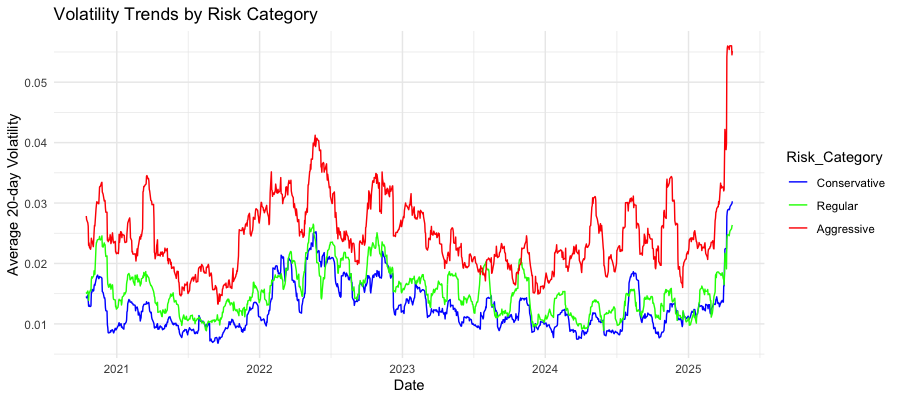
Figure 2: Volatility trends by risk category
The analysis of technical indicators revealed that volatility emerged as the most influential factor across all risk categories, as illustrated in Figure 3. Interestingly, volatility’s importance was most pronounced in the conservative category, with an absolute coefficient value approaching 0.09, significantly higher than in regular (approximately 0.03) or aggressive (approximately 0.01) categories. This suggests conservative investors may be particularly sensitive to volatility signals. Other technical indicators including various moving averages (MA20, MA200, MA50), MACD, and RSI showed minimal influence across all categories, with coefficient values close to zero.
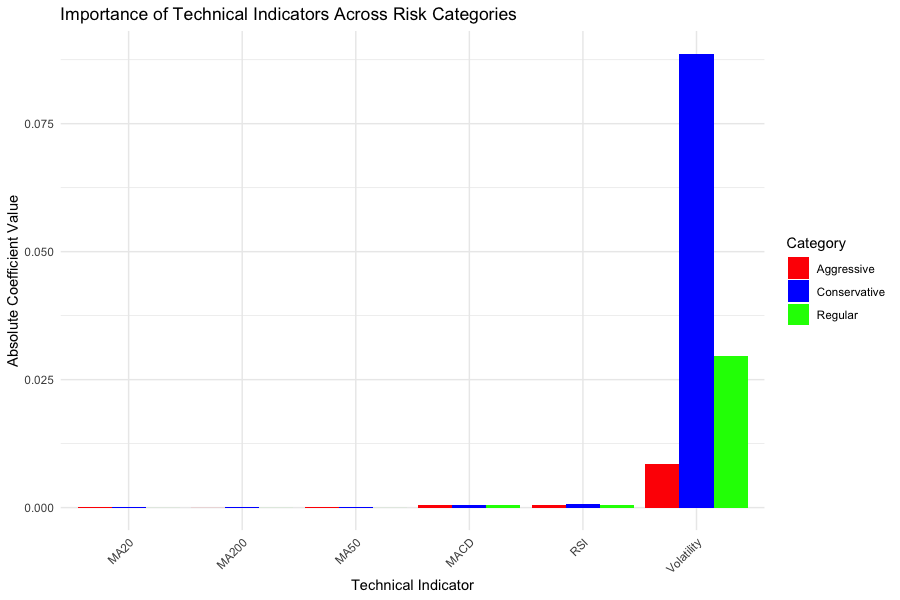
Figure 3: Importance of technical indicators across risk categories
3.3. ARIMA modeling and forecast accuracy
ARIMA models applied to representative stocks (AMZN, MSFT, and AAPL) revealed that all three were best modeled by ARIMA(0,1,0), effectively representing a random walk with drift. This finding aligns with the efficient market hypothesis, suggesting that during the analyzed period, stock prices incorporated available information quickly, making future movements difficult to predict from historical patterns alone.
The ARIMA models demonstrated reasonable forecast accuracy with Mean Absolute Percentage Error (MAPE) values of 1.6% for conservative stocks, 1.23% for regular stocks, and 1.3% for aggressive stocks. It’s noteworthy that regular risk category stocks (represented by MSFT) showed slightly better predictability than either conservative or aggressive stocks, possibly indicating an optimal balance between stability and information-rich price movements.
The ARIMA model summaries for each risk category revealed several insights, as shown in Table 2. This table presents the modeling results for each risk category, including the model type, variance (
|
Risk Category |
Stock |
ARIMA Model |
MAPE |
Most Significant Indicator |
Largest Coefficient (Value) |
Largest Coefficient Significance |
|
Conservative |
AMZN |
ARIMA(0,1,0) |
1.60% |
RSI |
Volatility (-0.089) |
Not significant |
|
Regular |
MSFT |
ARIMA(0,1,0) |
1.23% |
RSI |
Volatility (-0.030) |
Not significant |
|
Aggressive |
AAPL |
ARIMA(0,1,0) |
1.30% |
RSI |
Volatility (-0.009) |
Not significant |
The factor importance analysis demonstrated that volatility exhibited the largest absolute coefficient in all categories, but the most statistically significant predictor of returns in all categories of risk was RSI—which matters more than the rest of the predictors. Therefore, while volatility is an important variable in classification, RSI is a more dependable predictor of price movement over time for short intervals.
4. Discussion
4.1. Interpretation of results
Such findings are very relevant to the classification of stock risks and price movements within the context of differing risk categories.
First, the successful classification of stocks into three distinct risk categories demonstrates that a composite approach using both technical and fundamental metrics can effectively capture risk differences. The clear separation in volatility patterns across the three categories, as shown in Figure 2, validates this classification approach. Aggressive stocks like Tesla and AMD not only had higher risk scores but consistently displayed higher volatility throughout the study period.
Second, the emergence of ARIMA(0,1,0) as the optimal model for all three representative stocks suggests that, regardless of risk category, stock prices largely follow a random walk with drift. This aligns with the weak form of the efficient market hypothesis, which posits that future prices cannot be predicted based solely on past price information. The similarity in model structure across risk categories suggests that while the magnitude of price movements may differ, the underlying stochastic process may be similar.
Third, the factor importance analysis revealed an interesting dichotomy: while volatility had the largest absolute coefficient in predicting returns, RSI was the most statistically significant indicator across all risk categories. This suggests that although volatility is a defining characteristic for risk classification, it may not be the most reliable predictor of short-term price movements. RSI, which measures the speed and changes of price movements, appears to have a more consistent and statistically significant relationship with returns.
4.2. Comparison with previous research
These findings both confirm and extend previous research in several ways. The effectiveness of volatility as a risk classification metric aligns with portfolio theory dating back to Markowitz, who established volatility as a key measure of investment risk [1]. However, the composite approach used in this study, incorporating fundamental metrics alongside volatility, provides a more nuanced classification that better reflects real-world risk perceptions.
The random walk nature of stock prices across risk categories is consistent with the findings of Fama on market efficiency [3]. Recent work by Giglio, Kelly, and Xiu shows that omitted factors can significantly impact asset pricing models [8]. This supports the finding that RSI may capture information not included in standard models. However, the statistical significance of RSI in predicting returns across all categories presents a potential challenge to the strongest forms of the efficient market hypothesis, suggesting that technical indicators may provide some predictive power.
The finding that the regular risk category (represented by MSFT) showed the lowest MAPE value contradicts the common assumption that higher-risk stocks are inherently less predictable. This aligns with research by Ang and Bekaert, who found that predictability in stock returns is not necessarily related to risk levels in a straightforward manner [5].
4.3. Implications
The findings have several important implications for investors, portfolio managers, and financial analysts. The findings have several important implications for investors, portfolio managers, and financial analysts. First, the clear differentiation in volatility patterns across risk categories supports the value of diversification across these categories. Investors could use the risk classification approach to build portfolios that matches their risk tolerance. Second, the statistical significance of RSI across all risk categories suggested that this indicator might contain value in timing investment decisions, regardless of the risk profile of the stock. This aligns with Bianchi, Büchner, and Tamoni, who found that machine learning techniques can identify valuable patterns in financial indicators [9]. Third, the similarity in ARIMA model structures across risk categories could also suggest that while the magnitude of price movements differs, similar forecasting approaches might be applicable across risk categories. Finally, the random walk nature of stock prices across all risk categories could mean that there is a weak form of market efficiency [10]. Sophisticated forecasting models might offer limited advantages over simpler approaches.
5. Conclusion
This research successfully developed and validated a methodology for classifying stocks into distinct risk categories using a composite approach. The approach combined volatility with fundamental metrics. The analysis reveals three well-differentiated risk profiles—conservative, regular, and aggressive—with characteristic volatility patterns that is persistent throughout the study period. ARIMA modeling demonstrated that all stocks, regardless of risk category, are best represented by a random walk with drift model. This supports the weak form of market efficiency. However, the analysis of technical indicators produced intriguing results. While volatility showed the largest absolute coefficients in predicting returns, RSI emerges as the most statistically significant indicator across all risk categories. Notably, regular risk stocks exhibited slightly better predictability than either conservative or aggressive stocks, challenging conventional assumptions about the relationship between risk and predictability. These findings provide a framework for investors to align stock selection with risk tolerance while offering insights into which technical indicators may prove most reliable for different investment styles.
Several limitations of this study should be acknowledged and addressed in future research. The use of simulated rather than actual fundamental data represents a significant constraint, as does the relatively small sample of 10 stocks plus SPY analyzed over a period that included abnormal market conditions during the COVID-19 pandemic. The ARIMA models employed, while appropriate for the scope of this study, may not fully capture complex nonlinear dynamics present in stock prices, and the weights assigned to different metrics in the risk score calculation were somewhat arbitrary. Future research directions include comparing ARIMA models with more sophisticated approaches like GARCH or machine learning models, optimizing the classification methodology, conducting sector-specific analyses, examining how predictive power varies across different time horizons, and investigating the stability of the identified relationships across different market regimes. These extensions would enhance the robustness and practical utility of the findings for investors and portfolio managers.
References
[1]. Markowitz, H. (1952). Portfolio selection. The Journal of Finance, 7(1), 77-91.
[2]. Sharpe, W. F. (1964). Capital asset prices: A theory of market equilibrium under conditions of risk. The Journal of Finance, 19(3), 425-442.
[3]. Fama, E. F. , & French, K. R. (2015). A five-factor asset pricing model. Journal of Financial Economics, 116(1), 1 22.
[4]. Lo, A. W. , & MacKinlay, A. C. (1988). Stock market prices do not follow random walks: Evidence from a simple specification test. The Review of Financial Studies, 1(1), 41-66.
[5]. Ang, A. , & Bekaert, G. (2007). Stock return predictability: Is it there? Review of Financial Studies, 20(3), 651-707.
[6]. Hyndman, R. J. , & Khandakar, Y. (2008). Automatic time series forecasting: The forecast package for R. Journal of Statistical Software, 27(3), 1-22.
[7]. Gu, S. , Kelly, B. , & Xiu, D. (2020). Empirical asset pricing via machine learning. The Review of Financial Studies, 33(5), 2223-2273.
[8]. Giglio, S. , Kelly, B. , & Xiu, D. (2021). Asset pricing with omitted factors. Journal of Political Economy, 128(4), 1947-1990.
[9]. Bianchi, D. , Büchner, M. , & Tamoni, A. (2021). Bond risk premiums with machine learning. The Review of Financial Studies, 34(2), 1046-1089.
[10]. Wang, Y. H. (2022). Research on Epidemic Risk Identification Model Based on User Information Behavior in Online Health Communities: A Case Study of COVID-19 Intelligence Exploration (6), 26-36.
Cite this article
Wang,T. (2025). Stock Risk Classification and Predictive Analysis Using ARIMA Modeling. Advances in Economics, Management and Political Sciences,193,70-78.
Data availability
The datasets used and/or analyzed during the current study will be available from the authors upon reasonable request.
Disclaimer/Publisher's Note
The statements, opinions and data contained in all publications are solely those of the individual author(s) and contributor(s) and not of EWA Publishing and/or the editor(s). EWA Publishing and/or the editor(s) disclaim responsibility for any injury to people or property resulting from any ideas, methods, instructions or products referred to in the content.
About volume
Volume title: Proceedings of ICEMGD 2025 Symposium: Innovating in Management and Economic Development
© 2024 by the author(s). Licensee EWA Publishing, Oxford, UK. This article is an open access article distributed under the terms and
conditions of the Creative Commons Attribution (CC BY) license. Authors who
publish this series agree to the following terms:
1. Authors retain copyright and grant the series right of first publication with the work simultaneously licensed under a Creative Commons
Attribution License that allows others to share the work with an acknowledgment of the work's authorship and initial publication in this
series.
2. Authors are able to enter into separate, additional contractual arrangements for the non-exclusive distribution of the series's published
version of the work (e.g., post it to an institutional repository or publish it in a book), with an acknowledgment of its initial
publication in this series.
3. Authors are permitted and encouraged to post their work online (e.g., in institutional repositories or on their website) prior to and
during the submission process, as it can lead to productive exchanges, as well as earlier and greater citation of published work (See
Open access policy for details).
References
[1]. Markowitz, H. (1952). Portfolio selection. The Journal of Finance, 7(1), 77-91.
[2]. Sharpe, W. F. (1964). Capital asset prices: A theory of market equilibrium under conditions of risk. The Journal of Finance, 19(3), 425-442.
[3]. Fama, E. F. , & French, K. R. (2015). A five-factor asset pricing model. Journal of Financial Economics, 116(1), 1 22.
[4]. Lo, A. W. , & MacKinlay, A. C. (1988). Stock market prices do not follow random walks: Evidence from a simple specification test. The Review of Financial Studies, 1(1), 41-66.
[5]. Ang, A. , & Bekaert, G. (2007). Stock return predictability: Is it there? Review of Financial Studies, 20(3), 651-707.
[6]. Hyndman, R. J. , & Khandakar, Y. (2008). Automatic time series forecasting: The forecast package for R. Journal of Statistical Software, 27(3), 1-22.
[7]. Gu, S. , Kelly, B. , & Xiu, D. (2020). Empirical asset pricing via machine learning. The Review of Financial Studies, 33(5), 2223-2273.
[8]. Giglio, S. , Kelly, B. , & Xiu, D. (2021). Asset pricing with omitted factors. Journal of Political Economy, 128(4), 1947-1990.
[9]. Bianchi, D. , Büchner, M. , & Tamoni, A. (2021). Bond risk premiums with machine learning. The Review of Financial Studies, 34(2), 1046-1089.
[10]. Wang, Y. H. (2022). Research on Epidemic Risk Identification Model Based on User Information Behavior in Online Health Communities: A Case Study of COVID-19 Intelligence Exploration (6), 26-36.