


1. Introduction
Against the backdrop of an aging population, continuous optimization of pharmaceutical policies, and the deepening integration of capital markets, the number of listed companies in the pharmaceutical industry has been steadily increasing. The pricing logic of capital markets for pharmaceutical stocks has also been evolving from a traditional valuation framework to a multi-dimensional pricing system. Amidst the dual context of profound policy reforms in the pharmaceutical sector and heightened market volatility in capital markets, quantitative modeling based on time series has emerged as a pivotal tool for accurately grasping the operational patterns of pharmaceutical stocks.
The ARIMA-GARCH hybrid model represents a foundational analytical framework for financial time series forecasting. This integrated approach synergistically combines ARIMA's capacity to capture serial correlation patterns with GARCH's ability to model volatility clustering—two critical phenomena inherent in financial markets. ARIMA models excel in handling smooth time series data, or data that can be smoothed by transformation methods, and perform well in forecasting linear price components such as trends and seasonal fluctuations. This advantage has been demonstrated in empirical studies of stock markets and commodity pricing [1,2]. Complementing this, the GARCH specification—an extension of the ARCH model—introduces dynamic risk modeling by incorporating lagged variance terms to capture time-varying volatility. This mechanism addresses the well-documented "volatility clustering" characteristic of financial returns, where periods of high market turbulence alternate with relative calm, a phenomenon frequently observed during economic crises or geopolitical shocks [3,4].
The fusion of these methodologies creates a cohesive two-equation system: a mean equation governed by ARIMA processes to forecast conditional expectations, and a variance equation structured through GARCH specifications to quantify evolving risk levels. Research demonstrates that enhanced variants like ARIMA-SGARCH (Stochastic Volatility GARCH) outperform standalone models in capturing return dynamics and conditional heteroskedasticity, particularly in turbulent market regimes [5]. Furthermore, asymmetric extensions such as ARIMA-EGARCH (Exponential GARCH) provide nuanced insights by accounting for leverage effects—where negative news shocks exert disproportionately larger impacts on volatility compared to positive surprises—thereby enhancing the model's explanatory power for asymmetric risk profiles [6]. This hybrid structure's analytical superiority stems from its dual capacity to disentangle predictable trend components from stochastic risk fluctuations, a distinction validated by financial data's inherent fat-tailed distributions and clustered volatility patterns that challenge traditional parametric assumptions [7].
Empirical implementations further reveal the model's utility in long-term risk-return tradeoff analyses. For instance, GARCH-based equilibrium models have identified persistent relationships between expected returns and conditional variances across different investment horizons, facilitating cross-frequency data fusion strategies that reconcile daily volatility estimates with quarterly macroeconomic indicators during parameter calibration [8]. Advanced iterations like Realized GARCH incorporate intraday high-frequency data through realized volatility measures, significantly improving real-time risk assessments and short-term forecast accuracy [9]. However, limitations persist: the model's parametric structure struggles to capture abrupt extreme events and may underperform against non-linear machine learning alternatives like LSTM networks when confronted with unstructured or highly complex datasets [10]. These challenges suggest potential avenues for hybrid improvements, such as combining ARIMA-GARCH cores with neural network architectures to retain interpretability while enhancing flexibility.
Ultimately, the ARIMA-GARCH framework offers a robust theoretical and practical toolkit for financial market analysis. By integrating trend prediction capabilities with sophisticated risk measurement mechanisms, it provides a coherent structure for evaluating both the directional trajectory and the uncertainty bounds of asset prices. This dual focus on mean and variance dynamics renders the model particularly valuable for portfolio optimization, derivatives pricing, and systemic risk monitoring, where accurate quantification of both expected returns and tail risks remains paramount.
2. Data sources and model establishment
2.1. Sample introduction
The stock selected for this study is Apeloa Pharmaceutical (Stock Code: 000739). As a leading pharmaceutical enterprise in China, the company’s business encompasses the production, sales and R&D of active pharmaceutical ingredients (APIs), Contract Development and Manufacturing Organization (CDMO) services, and pharmaceutical preparations. Leveraging its technological advantages and large-scale production capabilities, the company holds a significant market position in fields such as anti-infectives, cardiovascular and cerebrovascular diseases, and anti-tumor therapies. It is deeply embedded in the global innovative drug industry chain, providing overseas top pharmaceutical companies with one-stop CDMO services from preclinical to commercial stages. The pharmaceutical preparations segment is also accelerating its breakthrough in the centralized procurement market through an integrated transformation of APIs-preparations.
In recent years, Apeloa Pharmaceutical has driven the growth of its pharmaceutical business by continuously optimizing its sales model and strengthening R&D investment, while actively expanding its international presence to enhance its global competitiveness. In 2025 Q1, it achieved a growth rate of 1.98% on net profit, demonstrating strong cost control and business structure optimization capabilities. The sales revenue of its CDMO business increased by 10% year-on-year, making it the most prominent growth driver in recent years. With its robust financial performance and promising industry prospects, Apeloa Pharmaceutical has become one of the focal points for investors in the pharmaceutical sector. This paper will select Apeloa Pharmaceutical as the research object.
2.2. Model introduction
The ARIMA model shown in equation (1) is a classic time series analysis method used for modeling and predicting non-stationary time series. The core idea is to transform non-stationary sequences into stationary sequences through differential operations, and then combine AR and MA processes to describe the dynamic characteristics of the sequences.
ARIMA models typically use the MLE method for estimation, i.e., to solve the parameters by maximizing the likelihood function [3]. The method uses numerical optimization algorithms to search in the parameter space to find the parameter combination that maximizes the likelihood function. These parameters are the estimated parameters of ARIMA models, which enable the model to best fit the observed data [7].
Financial time series data often exhibit significant ARCH effects, and the GARCH model can model the volatility clustering phenomenon, so this study will combine the ARIMA and the GARCH model.
2.3. Data pre-processing
This study selects daily closing price data of Apeloa Pharmaceutical from 2020 to 2024, sourced from IFinD Financial Terminal. According to the Figure1, the stock price may be non-stationary as it has a clear trend in some specific periods. A stationarity test is needed. This study uses the ADF test method for stationarity testing. ADF testing tests the stationarity of a sequence by constructing a regression model that includes lagged differences. According to the test, the DF statistic is -2.75 and the p-value is 0.26. Thus, there exists a unit root in the stock price series at 95% confidence level, indicating that it’s non-stationary.
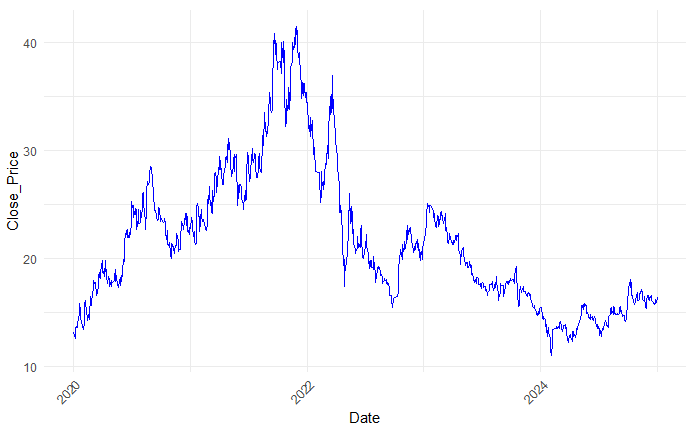
Figure 1: Stock price series chart of prospect pharmaceutical
This study selects daily closing price data of Apeloa Pharmaceutical from 2020 to 2024, sourced from IFinD Financial Terminal. According to the Figure1, the stock price may be non-stationary as it has a clear trend in some specific periods. A stationarity test is needed. This study uses the ADF test method for stationarity testing. ADF testing tests the stationarity of a sequence by constructing a regression model that includes lagged differences. According to the test, the DF statistic is -2.75 and the p-value is 0.26. Thus, there exists a unit root in the stock price series, indicating that it is non-stationary.
Based on this, the paper takes the first-difference of the stock price to remove the trend. The differenced series is subjected to ADF test again. The DF statistic is -10.11 and the p-value is smaller than 0.01. Hence, the differenced series is stationary. In addition, this study also uses the Ljung Box statistics to test whether the data is a white noise sequence. The results of shows that the LB test statistic is 31 and the p-value is 0.0457, rejecting the null of white noise.
2.4. Model computation and testing
To determine the parameters of the ARIMA model, the paper uses the information criteria, including the AIC and BIC (equation (2) and (3)). The specific procedure involves fitting ARIMA models with different orders, such as various combinations of AR(p), differencing (d), and MA(q) terms. Subsequently, the paper calculates the AIC and BIC values for each model. Both AIC and BIC evaluate models by considering a balance between the model's goodness-of-fit and its complexity, with BIC imposing a heavier penalty on complexity. The model with the smallest AIC or BIC value is optimal.
During the model-building process, this study exhaustively examined various combinations of orders. The results are presented in Table 1, where the order combination (p, d, q) = (2, 1, 2) corresponds to the smallest AIC value. Consequently, the model's final selected order is ARIMA (2, 1, 2).
|
ARIMA (p, d, q) |
AIC |
BIC |
|
ARIMA (0, 1, 0) |
2455.773 |
2460.873 |
|
ARIMA (0, 1, 1) |
2457.354 |
2467.552 |
|
ARIMA (0, 1, 2) |
2459.346 |
2474.644 |
|
ARIMA (0, 1, 3) |
2459.677 |
2480.074 |
|
ARIMA (1, 1, 0) |
2457.356 |
2467.555 |
|
ARIMA (1, 1, 1) |
2459.355 |
2474.652 |
|
ARIMA (1, 1, 2) |
2460.834 |
2481.231 |
|
ARIMA (1, 1, 3) |
2460.217 |
2485.713 |
|
ARIMA (2, 1, 0) |
2459.335 |
2474.632 |
|
ARIMA (2, 1, 1) |
2456.82 |
2477.217 |
|
ARIMA (2, 1, 2) |
2442.338 |
2467.834 |
|
ARIMA (2, 1, 3) |
2459.954 |
2490.550 |
Specifically, the autoregressive coefficients (AR1 and AR2) are -1.04 and -0.91, respectively. These coefficients reflect the linear relationships between the current value and its two preceding lagged values. The moving average coefficients (MA1 and MA2) are 1.08 and 0.97, respectively, representing the linear relationships between the current error term and its two preceding error terms. By considering both the estimated values and standard errors, the paper concludes that the model parameters are significant at the 5% level.
After establishing the ARIMA model, the distribution figure of the model's residuals will be plotted. Subsequently, the Ljung-Box test on the model residuals will be conducted to determine whether they constitute a white noise sequence. If this condition is met, it implies that the ARIMA model has effectively extracted the significant patterns from the dataset. The Ljung-Box test results yield a p-value of 0.5816, indicating no statistical evidence against the null hypothesis that the residuals are white noise. Consequently, the residuals can be considered a white noise sequence, supporting the suitability of the ARIMA (2,1,2) model for modeling and forecasting the time series.
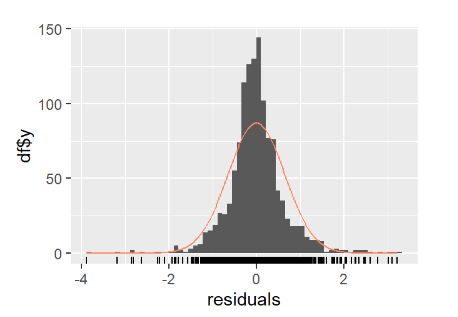
Figure 2: Distribution chart of residual series from the ARIMA model
As illustrated in Figure 2, which presents the residual series from the ARIMA model, there appears to be evidence of an ARCH effect. To investigate this further, the Lagrange Multiplier (LM) test was conducted. The test produced a statistic of 1184.4 with a p-value below 0.01, leading to the rejection of the null hypothesis of no ARCH effect. As a result, a GARCH component was introduced, forming an ARIMA(2,1,2)-GARCH(1,1) model. For this combined model, both the white noise test and the ARCH test yielded p-values above 0.05, indicating that the residuals exhibit no significant autocorrelation or ARCH effect. This suggests that the ARIMA(2,1,2)-GARCH(1,1) model effectively captures not only the trend but also the volatility structure of the stock price data.
2.5. Model forecasting
ARIMA-GARCH model forecasting involves constructing a model using historical time series data and then estimating future values based on it. The principle is as follows: After processing the data, model parameters are fitted using methods like maximum likelihood estimation. Once the model fitting results are obtained, the well-fitted model is extrapolated. Future values are predicted using past observed values and error terms, guided by autoregressive and moving average relationships. Based on the previously calculated ARIMA-GARCH model parameters, backward forecasting can be conducted. This study presents the forecast results for the next five trading days and compares them with actual values, as shown in Table 2 and Figure 3.
|
Date |
True value |
Forecast Value |
Lo.80 |
Hi.80 |
Lo.95 |
Hi.95 |
|
2025-01-02 |
15.56 |
16.24 |
15.39 |
17.09 |
14.94 |
17.54 |
|
2025-01-03 |
15.75 |
16.30 |
15.07 |
17.52 |
14.43 |
18.17 |
|
2025-01-06 |
16.35 |
16.26 |
14.74 |
17.77 |
13.94 |
18.57 |
|
2025-01-07 |
15.62 |
16.25 |
14.51 |
17.98 |
13.59 |
18.90 |
|
2025-01-08 |
15.28 |
16.29 |
14.35 |
18.24 |
13.31 |
19.27 |
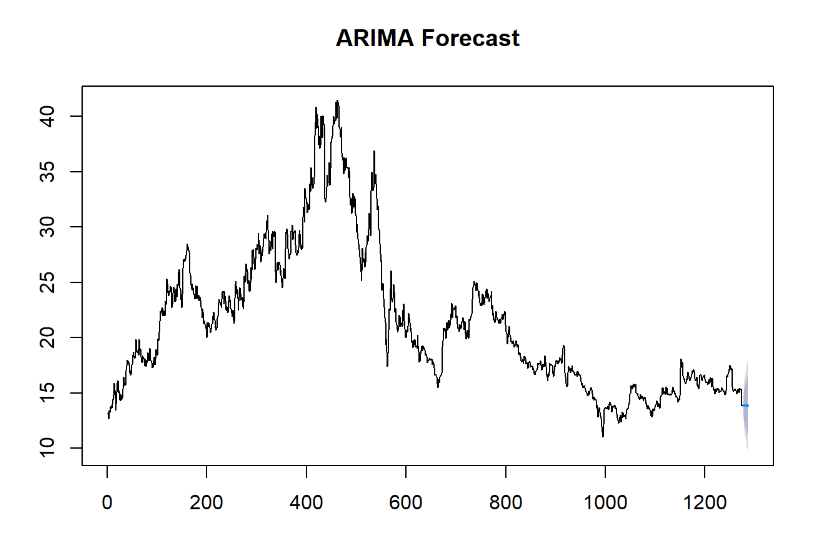
Figure 3: Out-of-sample forecast
In time series forecasting tasks, the MAPE and MSE shown in equation (4) and (5) are commonly used to evaluate model prediction accuracy.
The model achieves a MAPE of 3.81%, well below the 10% threshold, along with a MSE of 0.438. These results indicate that the ARIMA-GARCH model demonstrates strong predictive accuracy in capturing the stock price trend of Apeloa Pharmaceutical.
3. Conclusion
In this study, model parameters were estimated using data from 2020 to 2024, followed by a five-period forecast. The resulting MAPE of 3.81% highlights the strong predictive performance of the ARIMA-GARCH model, demonstrated here with Prologue Pharma as a case study. This outcome underscores the effectiveness of time series models that account for both trend and volatility in capturing stock price dynamics. Pharmaceutical stocks, often characterized by smaller market capitalizations, heightened volatility, and pronounced trends, benefit particularly from such models. Unlike traditional fundamental analysis, time series approaches can provide valuable insights into market trends and price behavior, offering a more comprehensive analytical tool for navigating the capital market.
In addition to forecasting stock prices, the ARIMA-GARCH model can be leveraged by investors to anticipate market volatility and price fluctuations. This enables more informed, dynamic portfolio adjustments aimed at risk control and enhancing risk-adjusted returns. By incorporating such models into their investment strategies, investors can better navigate market uncertainties and improve the overall quality of their investment experience.
The limitations of this study are that when modeling the stock prices in the pharmaceutical industry, only the stock price data were used, and other dimensional information such as fundamental financial indicators and trading volumes were not considered. In addition, besides the ARIMA-GARCH model, machine learning and deep learning methods can also be used to comprehensively utilize multi-dimensional market information to predict stock prices, which is the area for future improvement of this study.
References
[1]. Ho, M. K. , Darman, H. and Musa, S. (2021) Stock Price Prediction using ARIMA, Neural Network and LSTM Models. Journal of Physics. Conference Series, 1988, 12041.
[2]. Yu, Z. (2024) Stock Price Prediction using the ARIMA Model. Highlights in Science, Engineering and Technology, 88, 516–521.
[3]. Engle, R. F. (1982) Autoregressive Conditional Heteroscedasticity with Estimates of the Variance of United Kingdom Inflation. Econometrica, 50, 987-1007.
[4]. Ahmar, A. S. , Singh, P. K. , Thanh, N. V. , Tinh, N. V. and Vo, M. H. (2022) Prediction of BRIC Stock Price using ARIMA, SutteARIMA, and Holt-Winters. Computers, Materials & Continua, 70, 523.
[5]. Vaibhava Lakshmi, R. and Radha, S. (2021) Time Series Forecasting for the Adobe Software company’s Stock Prices using ARIMA (BOX-JENKIN’) Model. Journal of Physics. Conference Series, 2115, 12044.
[6]. Bagalkot, S. S. , A, D. H. and Naik, N. (2024) Novel Grey Wolf Optimizer Based Parameters Selection for GARCH and ARIMA Models for Stock Price Prediction. PeerJ. Computer Science, 10, e1735.
[7]. Almaafi, A. , Bajaba, S. and Alnori, F. (2023) Stock Price Prediction using ARIMA Versus XGBoost Models: The Case of the Largest Telecommunication Company in the Middle East. International Journal of Information Technology (Singapore. Online), 15, 1813-1818.
[8]. Gao, J. (2021) Research on Stock Price Forecast Based on ARIMA-GARCH Model. E3S Web of Conferences, 292, 2030.
[9]. TOMA, L. R. (2023) Exploring the Effectiveness of ARIMA and GARCH Models in Stock Price Forecasting: An Application in the IT Industry. Informatica Economica, 27, 61-72.
[10]. Lahboub, K. and Benali, M. (2024) Assessing the Predictive Power of Transformers, ARIMA, and LSTM in Forecasting Stock Prices of Moroccan Credit Companies. Journal of Risk and Financial Management, 17, 293
Cite this article
Li,M. (2025). Research on Stock Price Forecasting Based on the ARIMA-GARCH Model: A Case Study of Apeloa Pharmaceutical. Advances in Economics, Management and Political Sciences,193,86-93.
Data availability
The datasets used and/or analyzed during the current study will be available from the authors upon reasonable request.
Disclaimer/Publisher's Note
The statements, opinions and data contained in all publications are solely those of the individual author(s) and contributor(s) and not of EWA Publishing and/or the editor(s). EWA Publishing and/or the editor(s) disclaim responsibility for any injury to people or property resulting from any ideas, methods, instructions or products referred to in the content.
About volume
Volume title: Proceedings of ICEMGD 2025 Symposium: Innovating in Management and Economic Development
© 2024 by the author(s). Licensee EWA Publishing, Oxford, UK. This article is an open access article distributed under the terms and
conditions of the Creative Commons Attribution (CC BY) license. Authors who
publish this series agree to the following terms:
1. Authors retain copyright and grant the series right of first publication with the work simultaneously licensed under a Creative Commons
Attribution License that allows others to share the work with an acknowledgment of the work's authorship and initial publication in this
series.
2. Authors are able to enter into separate, additional contractual arrangements for the non-exclusive distribution of the series's published
version of the work (e.g., post it to an institutional repository or publish it in a book), with an acknowledgment of its initial
publication in this series.
3. Authors are permitted and encouraged to post their work online (e.g., in institutional repositories or on their website) prior to and
during the submission process, as it can lead to productive exchanges, as well as earlier and greater citation of published work (See
Open access policy for details).
References
[1]. Ho, M. K. , Darman, H. and Musa, S. (2021) Stock Price Prediction using ARIMA, Neural Network and LSTM Models. Journal of Physics. Conference Series, 1988, 12041.
[2]. Yu, Z. (2024) Stock Price Prediction using the ARIMA Model. Highlights in Science, Engineering and Technology, 88, 516–521.
[3]. Engle, R. F. (1982) Autoregressive Conditional Heteroscedasticity with Estimates of the Variance of United Kingdom Inflation. Econometrica, 50, 987-1007.
[4]. Ahmar, A. S. , Singh, P. K. , Thanh, N. V. , Tinh, N. V. and Vo, M. H. (2022) Prediction of BRIC Stock Price using ARIMA, SutteARIMA, and Holt-Winters. Computers, Materials & Continua, 70, 523.
[5]. Vaibhava Lakshmi, R. and Radha, S. (2021) Time Series Forecasting for the Adobe Software company’s Stock Prices using ARIMA (BOX-JENKIN’) Model. Journal of Physics. Conference Series, 2115, 12044.
[6]. Bagalkot, S. S. , A, D. H. and Naik, N. (2024) Novel Grey Wolf Optimizer Based Parameters Selection for GARCH and ARIMA Models for Stock Price Prediction. PeerJ. Computer Science, 10, e1735.
[7]. Almaafi, A. , Bajaba, S. and Alnori, F. (2023) Stock Price Prediction using ARIMA Versus XGBoost Models: The Case of the Largest Telecommunication Company in the Middle East. International Journal of Information Technology (Singapore. Online), 15, 1813-1818.
[8]. Gao, J. (2021) Research on Stock Price Forecast Based on ARIMA-GARCH Model. E3S Web of Conferences, 292, 2030.
[9]. TOMA, L. R. (2023) Exploring the Effectiveness of ARIMA and GARCH Models in Stock Price Forecasting: An Application in the IT Industry. Informatica Economica, 27, 61-72.
[10]. Lahboub, K. and Benali, M. (2024) Assessing the Predictive Power of Transformers, ARIMA, and LSTM in Forecasting Stock Prices of Moroccan Credit Companies. Journal of Risk and Financial Management, 17, 293