


1. Introduction
The rapid expansion of the digital economy has increased the importance of data as a fundamental component in production. Concurrently, China faces persistent disparities in digital economic progress across its regions, with conventional sectors urgently requiring a digital overhaul. Aiming to foster growth in the digital economy sector, the concept of "big data" was initially presented by China in the 2014 Government Work Report. Progressing further in 2015, the State Council released a series of significant guidelines, including the "Outline of Action for Promoting the Development of Big Data" and the "Guiding Opinions on Actively Promoting the Action of 'Internet +'". These documents underscored a strong commitment to advancing the big data sector. Additionally, the 13th Five-Year Plan, ratified at the Fifth Plenary Session of the 18th CPC Central Committee, delineated the strategic planning and execution of the country's big data initiative with greater precision. China's government has set up a number of national-level big data pilot zones since 2016[1], and has made every effort to create seven platforms for big data demonstration, big data clustering, big data application, big data trading, big data financial services, big data exchange and cooperation, and big data entrepreneurship and innovation, and to carry out the following tasks: data resource convergence, government data sharing and openness, and comprehensive governance demonstration and enhancement. Ten major projects will be implemented, including data resources convergence, government data sharing, openness, and comprehensive governance demonstration and enhancement. The purpose of establishing the pilot zone is to investigate how to utilize data resources effectively and to develop innovative models. This is achieved through policy direction, technological advancements, and the concentration of industry efforts, thereby encouraging enterprises to undergo digital transformation [2].
In September 2023, on an inspection tour in Heilongjiang, Xi Jinping, the secretary-general, officially presented the essential notion of "new quality productivity" for the first time. Arising within the framework of the era of big data, new quality productivity constitutes a distinct sort of productivity. It is supported by novel digital, interconnected, and intelligent technologies, using advances in science and technology as the primary driving force. Its main characteristic lies in the deep application of high - tech. This type of productivity is highly permeable and convergent. It emphasizes the transformation of productivity centered around data elements, technological innovation, and digital management, which is distinct from the traditional growth model that depends on capital and labor [3]. The new quality productivity is highly dependent on the rich data resources, innovation ecology and policy support offered from the Big Data Pilot Zone. By gathering massive data resources, the Big Data Comprehensive Pilot Zone provides enterprises and innovation subjects with the core driving force of data elements, helping them achieve breakthroughs in technology research and development, enhance production process efficiency, and innovate business models. The innovation ecosystem within the demonstration area encompasses the utilization of advanced technologies, the establishment of digital The innovation ecosystem in the demonstration area includes the application of sophisticated technologies, the establishment of digital facilities and the joint initiatives of diverse innovation entities. This comprehensive setup creates an ideal environment conducive to fostering new productivity. Meanwhile, the policy support system of the pilot zone, including financial subsidies, tax incentives and regulatory guarantees, offers a robust foundation for the advancement of new quality productivity, facilitating its high-performance and high-quality evolution in the digital economy era [4].
As can be seen from the above, existing studies mostly concentrate on the economic effect of big data technology itself, or analyze the path of action from the perspective of innovation empowerment, resource allocation optimization, supply chain optimization and so on. However, in summary, there are still places worth exploring in depth for the detailed analysis of the impact path. This study used the difference-in-differences methodology to validate the beneficial effect of the Big Data Comprehensive Pilot Zone on the innovative quality productivity of firms. This paper's incremental contribution lies in its systematic analysis of the impact of policy on the elements of new quality productivity. This study empirically investigates the influence of the Big Data Integrated Pilot Zone on the new quality productivity of firms and further analyzes whether the Big Data Integrated Pilot Zone enhances new quality productivity through supply chain efficiency.
2. Theoretical analysis and research hypothesis
2.1. Impact of big data development on new qualitative productivity
First, the establishment of the extensive big data experimental zone has greatly expanded the scope and scale of labor objects. In the process of advancing the data strategy, intangible elements such as digitized resources, intelligent data and knowledge reserves constitute a new type of object of action for modern production. [5]. In addition, based on the transaction cost theory articulated by Ronald Coase, big data technology optimizes the resource allocation of labor objects, breaks the geographical and industrial restrictions, allows firms to acquire and utilize necessary resources more extensively, and increases the efficiency of resource consumption.
Second, the Big Data Comprehensive Pilot Zone promotes the digital transformation and intelligent upgrading of the means of production. According to the theory of factor endowment upgrading proposed by Justin Yifu Lin, economies should choose industrial and technological structures based on their own factor endowments. The aggregation of digital factors promotes the transformation of production tools from traditional forms to intelligent equipment. The digital transformation of production methods not only increases efficiency but also fosters synergy and sharing across production resources. [6] Big data technology breaks the information barriers between enterprises and improves the efficiency of industrial chain synergy through data sharing and synergy.
Finally, the creation of the big data pilot zone has enhanced the digital literacy as well as innovation capabilities of the workforce. On the one hand, drawing from the skill - biased technological change theory, digital technology is increasing the demand for high - skilled labor, which is causing a differentiation in the labor market. To meet the requirements of new - quality productivity development, workers must acquire digital skills such as big data analysis and artificial intelligence. On the other hand, according to the theory of technology diffusion, the popularization of new technologies will penetrate into the production field through education, training and other channels, changing the way of knowledge dissemination, and big data technology provides new means of labor training, and laborers can acquire knowledge and skills through online learning and other means. In addition, according to Schumpeter's theory of creative destruction, the Big Data Comprehensive Experimental Zone promotes the transformation of economic structure while triggering a fundamental reconfiguration of the labor market, giving rise to emerging occupations such as data analysts and artificial intelligence experts.
Based on the earlier analytical framework, this paper provides Hypothesis H1: Big data policies can increase the level of new quality productivity development in enterprises.
2.2. Big data comprehensive experimental zone improves new quality productivity levels of enterprises by improving supply chain efficiency
First, optimizing the procurement process with big data is crucial for improving supply chain efficiency. Big data enables enterprises to integrate supplier information and conduct scientific screening based on multi-dimensional data, reducing procurement costs and enhancing supplier cooperation stability. This not only improves raw material quality and supply reliability but also supports the efficient operation of the production process, providing a foundation for new quality productivity [7]. Second, intelligent production is key to supply chain efficiency. By analyzing production data, enterprises can optimize processes, predict and prevent equipment failures, and reduce downtime [8]. Lastly, efficient logistics and distribution collaboration is essential for supply chain efficiency. Big data allows real-time monitoring of logistics data, enabling enterprises to optimize distribution plans and dynamically adjust transportation routes. This ensures timely and accurate delivery, reduces logistics costs, and provides flexible resource allocation for new quality productivity [9].In summary, hypothesis H2 is proposed: the establishment of a big data pilot zone can improve supply chain efficiency and thus new quality productivity.
3. Research design
3.1. Model setting
In this paper, the policy of "national big data comprehensive pilot zone" is regarded as a quasi-natural experiment, and a double-difference model is constructed to explore the causal relationship with the level of firms' new quality productivity, and the baseline regression model is set up as in Equation (1):
The explanatory variable
3.2. Variable selection
3.2.1. Explained variables
The concept of new quality productivity is fundamentally about the transformation in the quality of labor, the objects of labor, and the materials used in labor, along with their most effective integration [10]. Based on this, drawing on the methodology of literature [11], we construct the enterprise new quality productivity index system with 12 indicators as shown in Table 1, and then determine the weight of each indicator by using the entropy method to calculate the enterprise new quality productivity index of the sample.
|
Level indicators |
Secondary indicators |
Tertiary indicators |
calculation method |
Weight % |
|
New Quality Laborers |
Quality of employees (in ideological education) |
Percentage of R&D staff |
(Number of R&D staff/number of employees)×100 |
12.985 |
|
Percentage of highly educated personnel |
(Number of graduate students or above/number of employees)×100 |
8.855 |
||
|
Management quality |
Executive Green Perceptions |
ln (+1 word frequency of green development keywords in annual reports) |
6.320 |
|
|
Management's overseas background |
The value of 1 if there are executives with overseas background, 0 otherwise. |
6.617 |
||
|
new object of labor |
ecological environment |
Environmental governance score |
The E indicator of CSI's ESG rating, with each of the 9 levels assigned a value from 1 to 9. |
7.929 |
|
future development |
Fixed assets as a percentage |
(Fixed assets/total assets) x 100 |
2.732 |
|
|
rate of capital accumulation |
(Increase in owner's equity for the year/owner's equity at the beginning of the year) x 100 |
1.124 |
||
|
new material for production |
Scientific and technical labor information |
Innovation level |
ln(number of patents granted + 1) |
21.81 |
|
Digital labor information |
Degree of digitization |
ln(frequency of digitized keywords in the annual report +1) |
4.62 |
|
|
Intangible assets as a percentage |
(Intangible assets/total assets) x 100 |
4.10 |
||
|
Green labor information |
Level of green technology |
ln(number of green patents granted +1) |
9.96 |
|
|
Percentage of Green Patents |
(Number of green patents granted/number of patents granted) x 100 |
12.95 |
3.2.2. Core explanatory variables
The core explanatory variable is a dummy variable for the national-level comprehensive big data pilot zone policy. In 2016, the State Council approved pilot zones in Guizhou and later in Beijing, Tianjin, Hebei, Shanghai, Guangdong, Henan, Chongqing, Shenyang, and Inner Mongolia. These regions form the experimental group, while others are the control group. The dummy variable did equals 1 if the enterprise is in a pilot city post-policy, otherwise 0, assessing big data development.
3.2.3. Control variable
Referring to the existing studies [12], this paper sets the following control variables to exclude possible interference with the empirical results. Firm size (size) ; Financial leverage (lever) ; Return on enterprise assets (roa) ; Growth (growth) ; Cash flow ratio (cash) ; TobinQ ; Shareholding concentration (top10) ; Board of directors' size (broad) ; Percentage of independent directors (indep) ; Age of the firm ; Dual job ( dual) .
|
new mass productivity |
NPRO |
See table above for details |
|
Policy dummy variables |
did |
The city is a pilot city and takes the value of 1 in the year of policy implementation or later, otherwise it takes the value of 0. |
|
Enterprise size |
size |
Expressed using the logarithmic value of the total assets of the enterprise |
|
financial leverage |
lever |
Measured by total business liabilities divided by total business assets |
|
Return on business assets |
roa |
Expressed using the ratio of net profit to total assets |
|
growth |
growth |
Expressed as growth rate of operating income |
|
Cash flow ratio |
cash |
Expressed as the ratio of cash flow to current liabilities |
|
Tobin's Q |
TobinQ |
Expressed in terms of the firm's Tobin's q-value |
|
shareholding concentration |
top10 |
Measured by the percentage of shares held by the top ten shareholders of a company |
|
Board size |
broad |
Expressed as the natural logarithmic value of the total number of board members |
|
Percentage of independent directors |
indep |
Expressed as the ratio of the number of independent directors to the total number of board members |
|
Age of business |
age |
Expressed as the logarithm of the year the business was established |
|
two jobs in one |
dual |
Enterprise chairman and general manager of the two positions in one take the value of 1, otherwise 0 |
3.3. Data sources and descriptive statistics
Based on the big data policy implementation cycle and data availability, this study selects China A-share non-financial listed companies as the initial sample from 2012 to 2021. The data preparation adheres to strict exclusions: financial service companies are left out, as are those marked with special treatment designations (ST/*ST). Any data entries with missing key variable data are discarded, and extreme values are managed by applying a 1% Winsorizing process to continuous variables. Following these criteria, a final dataset of 26,108 firm-year entries is compiled from the CSMAR database, forming an unbalanced panel. Table 2 outlines the main variables' statistical summaries. For robustness, the study adopts methods from existing literature [13] to reassess new quality productivity, and for evaluating supply chain efficiency, it follows techniques from [14], which interprets efficiency through the lens of inventory turnover, using the formula ln(365/inventory turnover rate) based on stock levels.
|
Variable |
Obs |
Mean |
Std. |
Min |
Max. |
|
NPRO |
26108 |
0.126 |
0.067 |
0.012 |
0.373 |
|
did |
26108 |
0.289 |
0.453 |
0 |
1 |
|
size |
26108 |
22.200 |
1.280 |
19.971 |
26.24 |
|
lever |
26108 |
0.412 |
0.203 |
0.055 |
0.88 |
|
roa |
26108 |
0.040 |
0.06 |
-0.239 |
0.197 |
|
growth |
26108 |
0.362 |
0.911 |
-0.679 |
6.337 |
|
cash |
26108 |
0.050 |
0.067 |
-0.145 |
0.239 |
|
TobinQ |
26108 |
2.051 |
1.309 |
0.855 |
8.587 |
|
top10 |
26108 |
0.595 |
0.149 |
0.248 |
0.907 |
|
board |
26108 |
2.279 |
0.251 |
1.609 |
2.890 |
|
indep |
26108 |
0.383 |
0.073 |
0.250 |
0.600 |
|
age |
26108 |
3.214 |
0.222 |
2.565 |
3.689 |
|
dual |
26108 |
0.286 |
0.452 |
0 |
1 |
4. Empirical analysis
4.1. Baseline regression results
The benchmark regression analyses, which utilize a multi-period double-difference method, are summarized in Table 4. The first column (1) focuses solely on the core explanatory variables. The second column (2) expands on this by including control variables at the firm level. Columns (3) and (4) go further by integrating fixed effects for both city and industry. A consistent finding across these regressions is the significantly positive coefficients for the big data policy's interaction terms at the 1% significance level. This finding underscores the substantial enhancement in the development of new quality productivity among firms located within the established big data pilot zones. Therefore, from the results of columns (1) to (4), hypothesis H1 is preliminarily tested.
|
(1) |
(2) |
(3) |
(4) |
|
|
VAR |
NPRO |
NPRO |
NPRO |
NPRO |
|
did |
0.005*** |
0.005*** |
0.005*** |
0.005*** |
|
(0.002) |
(0.002) |
(0.002) |
(0.002) |
|
|
size |
0.011*** |
0.011*** |
0.0118*** |
|
|
(0.001) |
(0.001) |
(0.001) |
||
|
lever |
-0.008* |
-0.008* |
-0.008* |
|
|
(0.004) |
(0.004) |
(0.004) |
||
|
roa |
-0.028*** |
-0.028*** |
-0.027*** |
|
|
(0.007) |
(0.007) |
(0.007) |
||
|
growth |
-0.001*** |
-0.001*** |
-0.001*** |
|
|
(0.000) |
(0.000) |
(0.000) |
||
|
cash |
-0.006 |
-0.006 |
-0.007 |
|
|
(0.005) |
(0.005) |
(0.005) |
||
|
TobinQ |
0.001*** |
0.0013*** |
0.001*** |
|
|
(0.000) |
(0.000) |
(0.000) |
||
|
top10 |
-0.006 |
-0.006 |
-0.004 |
|
|
(0.006) |
(0.006) |
(0.005) |
||
|
board |
0.003* |
0.003* |
0.003* |
|
|
(0.002) |
(0.002) |
(0.002) |
||
|
indep |
-0.016*** |
-0.016*** |
-0.016*** |
|
|
(0.005) |
(0.005) |
(0.005) |
||
|
dual |
-0.003*** |
-0.003** |
-0.003*** |
|
|
(0.001) |
(0.001) |
(0.001) |
||
|
age |
-0.213*** |
-0.213*** |
-0.214*** |
|
|
(0.014) |
(0.014) |
(0.014) |
||
|
Constant |
0.095*** |
0.541*** |
0.534*** |
0.532*** |
|
(0.001) |
(0.054) |
(0.055) |
(0.055) |
|
|
Enterprise fixed Year fixed Province fixed Industry Fixed |
YES YES NO NO |
YES YES NO NO |
YES YES YES NO |
YES YES YES YES |
|
Observations |
26,108 |
26,108 |
26,108 |
26,108 |
|
R-squared |
0.134 |
0.145 |
0.147 |
0.155 |
|
Number |
4,072 |
4,072 |
4,072 |
4,072 |
*** p<0.01, ** p<0.05, * p<0.1
4.2. Robustness test
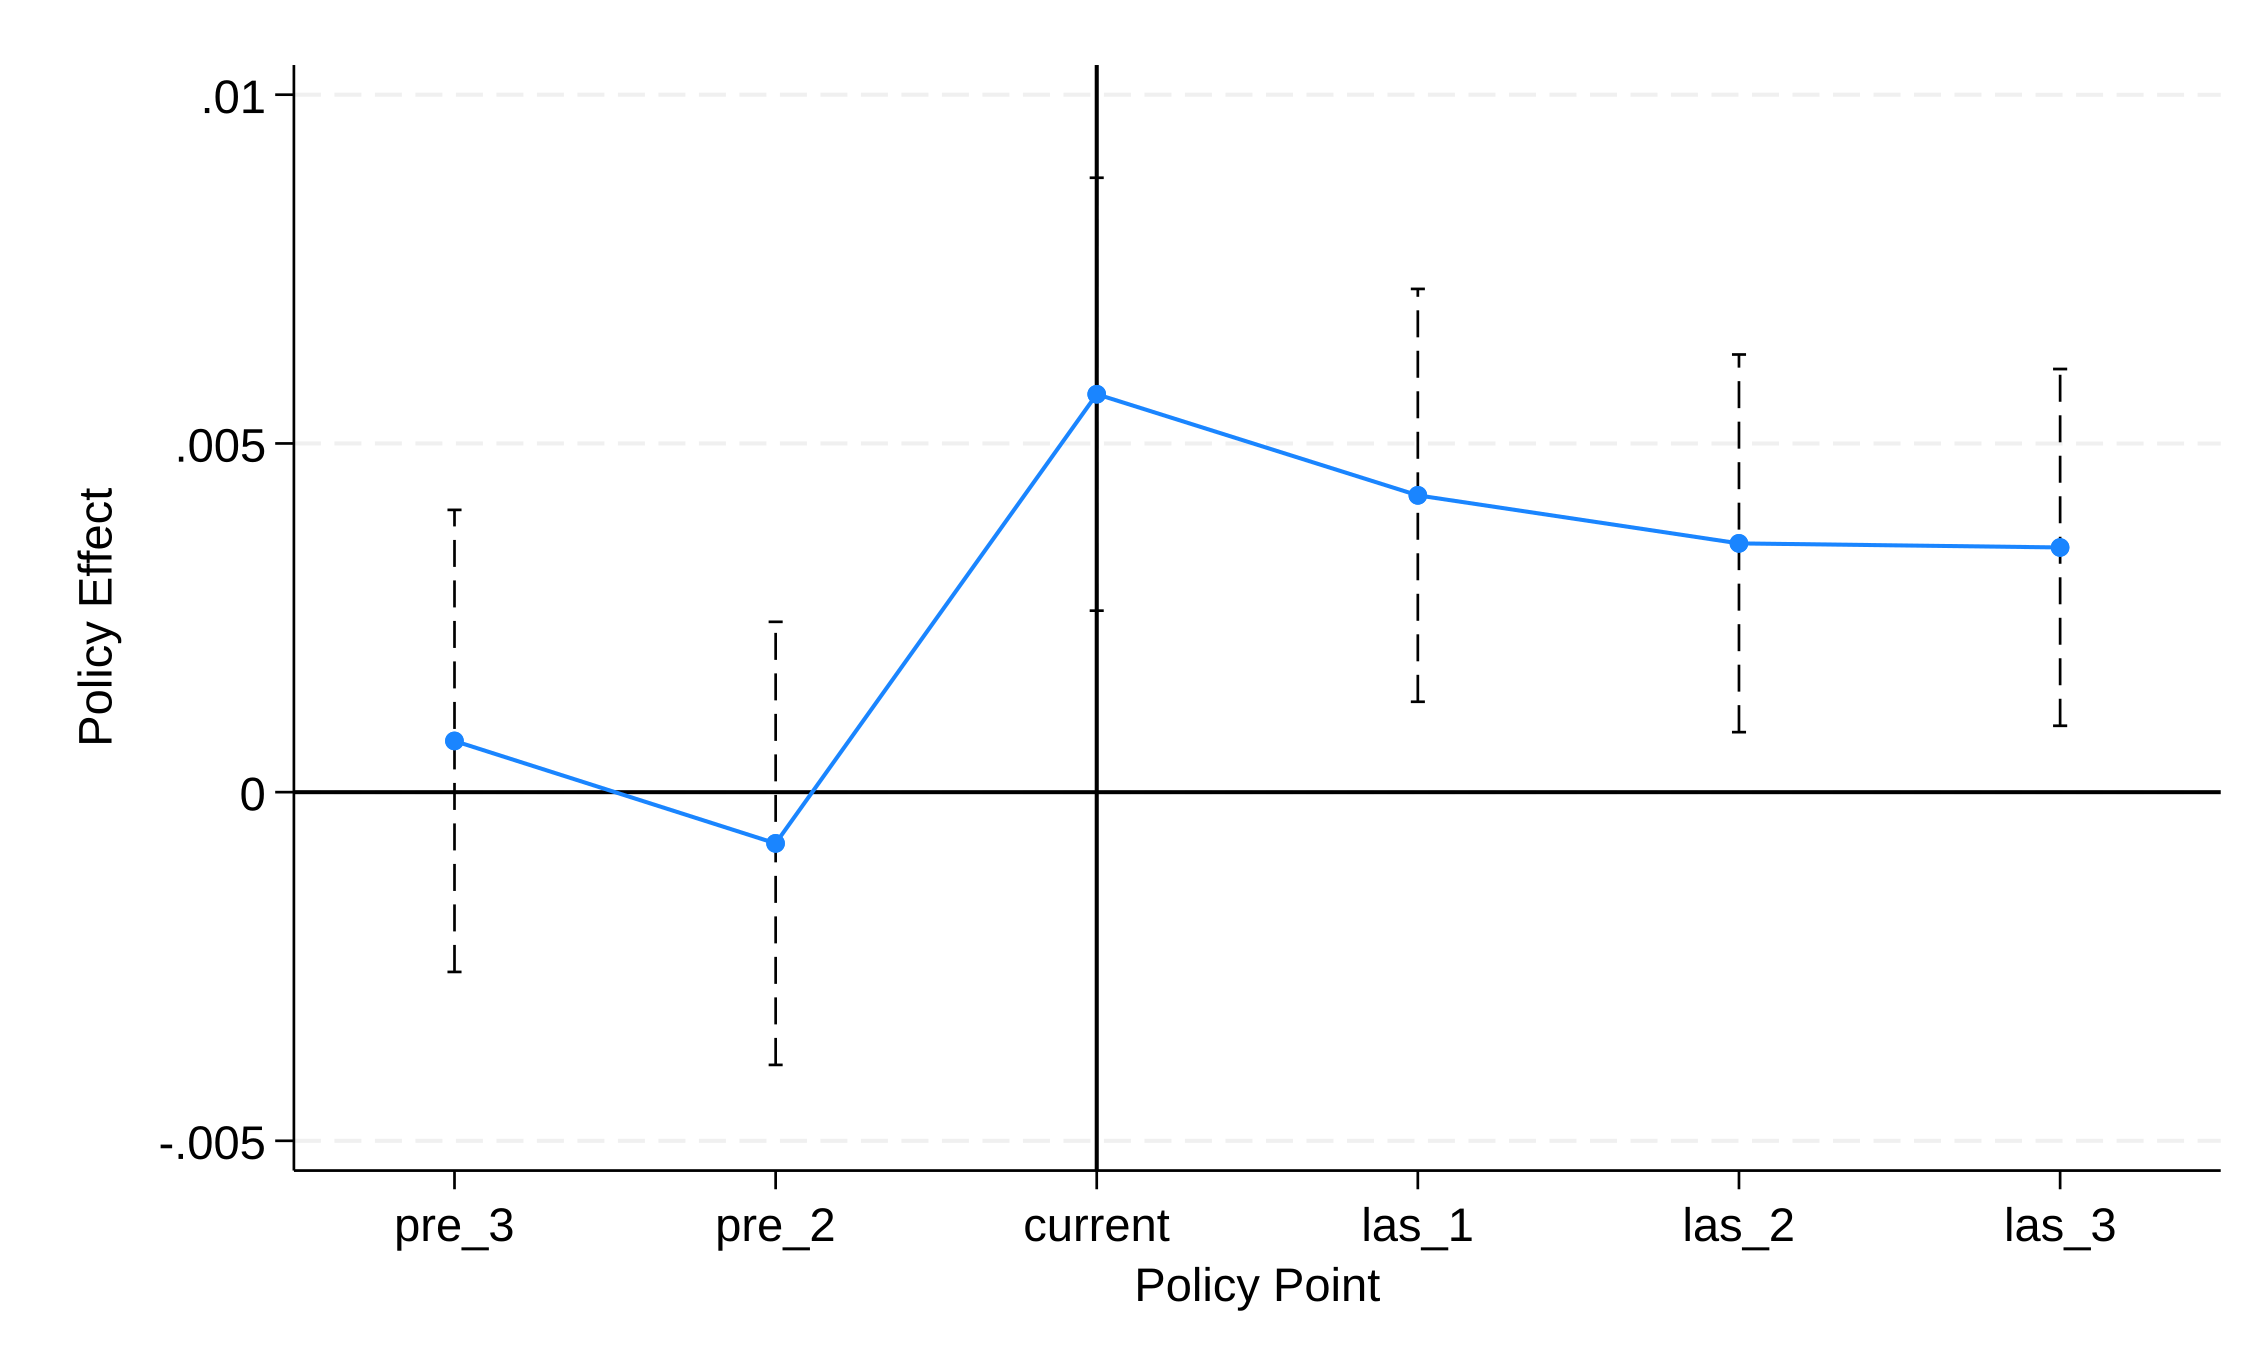
4.2.1. Parallel trend test
Building on prior studies [15], this analysis considers a six-year timeframe encompassing the initial and final three-year segments post the inception of the big data pilot zone. The parallel trend test results illustrated in Figure 1 indicate that prior to the pilot's implementation, the regression coefficients hover around zero, signifying no notable divergence in the trajectory of new quality productivity between the treatment and control groups, thus validating the parallel trend assumption. In contrast, the coefficient observed four years post the pilot zone's establishment is markedly above zero, suggesting that the pilot zone's influence has led to a substantial and enduring disparity in new quality productivity levels between the groups. This finding reinforces the credibility of the empirical outcomes discussed earlier.
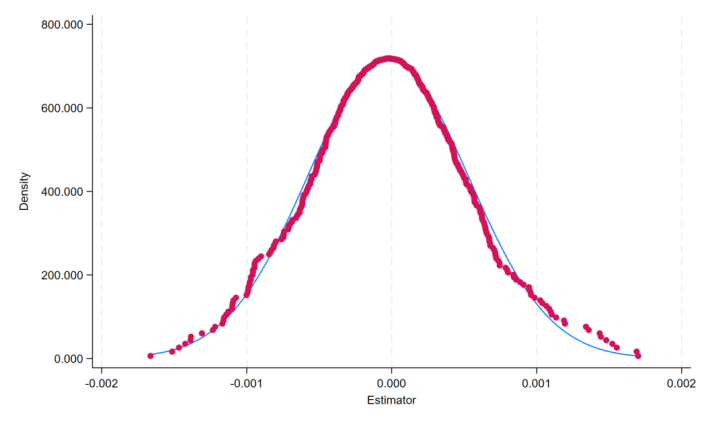
4.2.2. Placebo testing
In order to exclude other unobserved omitted variables from interfering with the regression results, a placebo test was conducted using randomly generated treatment and control groups. Meanwhile, the time of establishment of the big data test area for the treatment group was randomized so that a new quasi-natural experiment could be constructed and regression analyses performed. The above practice was repeated 500 times and the regression coefficients were counted. Observing Figure 2, it's evident that the regression coefficients from the 500 randomized pseudo-natural experiments cluster near zero. In contrast, the benchmark regression coefficient of 0.00465 indicates that the outcomes of the benchmark analysis were likely not a result of random variation.
4.2.3. Substitution of explanatory variables
In order to validate the robustness of the model results, this study refers to the neoplasm productivity data constructed by [13] using the entropy method containing 11 indicators as a new measure of NPRO ratings. By comparing the regression results of the original model with the model after replacing the metric, we find that the coefficient estimates of most of the explanatory variables and their statistical significance levels remain consistent.
4.2.4. Lagging by one period
The dynamic effect test results depicted in Figure 1 demonstrate that the creation of a big data pilot zone influences the improvement of enterprises' new quality productivity with a delay. Consequently, this study performs a robustness test with a one-period lag on the explanatory variables. The data in column (3) of Table 5 reveal that after a one-period lag, the regression coefficient for the pilot zone establishment (did) is 0.0033, which is statistically significant at the 10% level. This suggests that the introduction of a big data pilot zone indeed has a delayed impact on enhancing the new productivity level of enterprises, confirming the reliability of the findings presented in this paper.
|
(1) |
(2) |
(3) |
|
|
VAR |
NPRO |
NPRO (Song Jia) |
NPRO |
|
did |
0.005*** |
0.207*** |
|
|
(0.00178) |
(0.0753) |
||
|
L. did |
0.003* |
||
|
(0.00175) |
|||
|
Cons |
0.534*** |
80.790*** |
0.300*** |
|
(0.0549) |
(2.383) |
(0.058) |
|
|
CV |
YES |
YES |
YES |
|
fixed effect |
YES |
YES |
YES |
|
Obs |
26,108 |
24,750 |
21,092 |
|
R-squared |
0.147 |
0.199 |
0.118 |
|
Number |
4,072 |
3,791 |
3,578 |
*** p<0.01, ** p<0.05, * p<0.1
4.3. Heterogeneity analysis
4.3.1. Nature of equity
Based on enterprise ownership type, the analysis splits the sample into state-owned (SOE=1) and non-state-owned enterprises (SOE=0). Table 6 columns (1) and (2) present the findings. Big data development positively affects the new quality productivity of both groups, with SOEs experiencing a more noticeable boost. This could be because SOEs typically receive greater policy backing and resources for digital transformation, thus speeding up the development of new productivity. Meanwhile, SOEs have an advantage in attracting digital technology talents and have a perfect system and guarantee mechanism, which enables them to make more effective use of big data policies, optimize resource allocation, resist digital risks, and deeply integrate digital technologies, thus significantly enhancing productivity.
4.3.2. Regional heterogeneity
As a result of the unequal pace of development in different regions, there is a marked contrast in economic development stages between the eastern region of China and its central and western counterparts. This section conducts a regression analysis to examine how the regional disparities in establishing big data pilot zones impact the development of enterprises' new quality productivity levels [17]. The corresponding econometric outcomes are presented in columns (3), (4), and (5) of Table 6. The impact coefficients and statistical tests show that the big data pilot zone policy is more beneficial for companies in China's central region. It's less so for those in the east and has little effect in the west. This disparity might be attributed to the fact that the central region, characterized by its current economic development phase and industrial framework, harbors a more substantial need for and capacity to integrate new technologies, such as big data. This positioning allows these areas to more effectively capitalize on the opportunities presented by the big data pilot zone policy, thereby fostering an increase in the level of new productivity among enterprises. In contrast, the eastern region's more mature industrial structure makes its demand for new technology applications less urgent than the central region's, weakening the policy's promotion effect. In the western region, lower economic development and insufficient infrastructure and human resources limit the widespread application of new technologies like big data, resulting in an insignificant policy promotion effect.
|
(1) |
(2) |
(3) |
(4) |
(5) |
|
|
VAR |
NPRO |
NPRO |
NPRO |
NPRO |
NPRO |
|
did |
0.008*** |
0.005*** |
0.004*** |
0.013*** |
0.005 |
|
(0.002) |
(0.002) |
(0.001) |
(0.004) |
(0.004) |
|
|
Cons |
0.006 |
-0.043* |
0.033 |
||
|
(0.037) |
(0.022) |
(0.021) |
|||
|
CV |
YES |
YES |
YES |
YES |
YES |
|
fixed effect |
YES |
YES |
YES |
YES |
YES |
|
Obs |
8,836 |
15,268 |
17,004 |
3,905 |
3,075 |
|
Number |
1,223 |
2,683 |
2,699 |
566 |
437 |
*** p<0.01, ** p<0.05, * p<0.1
4.4. Conduction path analysis
4.4.1. Supply chain efficiency
Efficiency in managing supply chains is crucial for business operations. Firstly, companies located within the pilot zones are capable of leveraging big data to refine their processes, including procurement, manufacturing, and distribution, which leads to a decrease in both excess inventory and transportation expenses. This approach also bolsters the agility and collaborative dynamics within the supply chain [16]. Secondly, the implementation of big data solutions enhances the clarity of supply chain operations and mitigates disparities in information availability, thereby boosting the overall effectiveness of the supply chain [17]. Following the methodology proposed by Zhang Shushan, the efficiency of a company's supply chain is quantified using the logarithm of its non-product inventory levels. As illustrated in Table 7, Column (1), there is a marked enhancement in supply chain efficiency attributed to advancements in big data technology. Hypothesis H2 is verified.
|
(1) |
|
|
VAR |
Supply Chain Efficiency |
|
did |
0.067** |
|
(0.028) |
|
|
Constant |
-36.400*** |
|
(1.071) |
|
|
CV |
YES |
|
fixed effect |
YES |
|
Obs |
25,435 |
|
R-squared |
0.048 |
|
Number |
3,974 |
*** p<0.01, ** p<0.05, * p<0.1
5. Conclusions and policy recommendations
With the backdrop of initiating large-scale data comprehensive test areas at the national level and utilizing panel data from 4,076 publicly traded firms in China spanning 2012 through 2021, this study employs the double-difference approach to assess the impact of developing these data test areas on firms' advancement in new quality productivity. Key findings include: firstly, the inception of extensive data test areas notably enhances companies' new quality productivity, predominantly through enhancing supply chain efficiency, which serves as a pivotal pathway through which data policies influence corporate new quality productivity. Secondly, the influence of data policies on augmenting new productivity is particularly pronounced in state-owned and centrally located businesses, whereas the impact on those in the western region is minimal. This indicates that the execution of data policies varies among businesses based on their ownership structure and geographical location. Consequently, this paper proposes a series of policy recommendations:
Firstly, authorities should guide enterprises to use big data technology to enhance their supply chain operations, which in turn boosts the efficiency of purchasing, manufacturing, and transportation processes. Establishing a platform for sharing supply chain information will facilitate the dissemination of data across businesses, thereby lowering the levels of excess inventory and cutting down on shipping expenses, all while improving the supply chain's ability to respond quickly and work cohesively. Additionally, enhancing supply chain resilience ensures stable enterprise production and sustainable new quality productivity.
Secondly, to address regional disparities, the government must prioritize boosting digital infrastructure funding in the central and western areas, thereby speeding up the development of critical new infrastructure, such as data centers, 5G networks, and the industrial Internet. To promote coordinated regional development and address the digital economy lag in the west, a special support fund should be set up to encourage enterprise investment in western digital infrastructure. Meanwhile, using tax incentives and financial subsidies, the government should guide eastern digital tech enterprises to cooperate with western ones, promoting balanced regional digital economy development.
Thirdly, policy formulation should be more targeted, with differentiated support based on regional and enterprise characteristics. For example, state-owned enterprises can focus on R&D and innovative application investment support, while private enterprises can receive more tax incentives and financial support to overcome digital transformation financial bottlenecks. Additionally, the government should improve big data policy support measures, including data security regulations, intellectual property protection, and talent training. A sound regulatory system ensures enterprise data security and legal use while incentivizing increased technological innovation investment and enhanced new quality productivity.
References
[1]. ZHANG Weichong, WANG Fang, HUANG Yi. Research on big data policy knowledge modeling in Guizhou Province based on graph database[J]. Digital Library Forum, 2020, (04):30-38.
[2]. HONG Yinxing, REN Baoping. Connotation and ways of deep integration of digital economy and real economy[J]. China Industrial Economy, 2023, (02):5-16.
[3]. Cai Fang. How China's economic growth is shifting to total factor productivity-driven[J]. China Social Science, 2013, (01):56-71+206.
[4]. Meng J, Han WL . New quality productivity theory: a historical materialist interpretation[J]. Economic Research, 2024, 59 (3): 29-33
[5]. LI Hualong, LI Zhongwen, YANG Kefan, et al. Whether big data policy can catalyze new quality productivity of enterprises--a quasi-natural experiment based on national-level big data comprehensive pilot zone[J]. China Science and Technology Forum, 2025, (02):137-149.
[6]. ZHAO Peng, ZHU Yenan, ZHAO Li. State-level Big Data Comprehensive Pilot Zones and New Quality Productivity - Empirical Evidence Based on 230 Cities[J]. Journal of Chongqing University (Social Science Edition), 2024, 30(04):62-78.
[7]. Huang Jing, Yang Wensheng. A supply chain decision model based on CVaR and supplier commitment buyback[J]. Journal of Management, 2016, 13(08):1250-1256.
[8]. MENG Hu, LIANG Xiaobei, YANG Yixiong, et al. Supply chain performance evaluation and optimization based on LMBP algorithm in the context of big data[J]. Data Analysis and Knowledge Discovery, 2018, 2(11):37-45.
[9]. Han Xiaoying. Supply chain optimization and efficiency improvement driven by new quality productivity[J]. National Circulation Economy, 2024, (24):86-89.
[10]. Liu W . Scientific understanding and practical development of new quality productivity [J]. Economic Research, 2024, 59 (3): 4-11.
[11]. LI Xinru, TIAN Zengrui, CHANG Purchyuan. New quality productivity, resource utilization and organizational resilience of firms[J]. Western Forum, 2024, 34(04):35-49.
[12]. Song Jia, Zhang Jinchang, Pan Yi. A study on the impact of ESG development on firms' new quality productivity: empirical evidence from Chinese A-share listed firms[J/OL]. Contemporary Economic Management
[13]. ZHANG Shushan, ZHANG Peiwen, GU Cheng. Enterprise digital transformation and supply chain efficiency[J]. Statistics and Decision Making, 2023, 39(18):169-173.
[14]. Zou K, Zheng Yundan, Liu Xiwei. Did the pilot policy promote the combination of science and technology and finance? ---An empirical test based on double-difference propensity score matching[J]. China Soft Science, 2022(7):172-182.
[15]. LI Xiaosheng, HU Jianbing, SONG Malin. How digital economy policies can empower the development of new quality productivity[J]. Economic Management, 2025, 47(02):5-26.
[16]. Yin Hang. Research on supply chain transparency and traceability[J]. China Logistics and Purchasing, 2025, (01):159-160.
[17]. Liu Jiamin, Ma Xiaoyu. Can Big Data Development Generate New Quality Productivity of Enterprises --A Quasi-Natural Experiment Based on the National-level Big Data Comprehensive Pilot Zone[J]. Finance and Economy, 2024, (07):1-13.
Cite this article
Sun,E. (2025). An Empirical Analysis of the New Quality Productivity of Firms in a Comprehensive Big Data Pilot Zone. Advances in Economics, Management and Political Sciences,195,108-120.
Data availability
The datasets used and/or analyzed during the current study will be available from the authors upon reasonable request.
Disclaimer/Publisher's Note
The statements, opinions and data contained in all publications are solely those of the individual author(s) and contributor(s) and not of EWA Publishing and/or the editor(s). EWA Publishing and/or the editor(s) disclaim responsibility for any injury to people or property resulting from any ideas, methods, instructions or products referred to in the content.
About volume
Volume title: Proceedings of ICMRED 2025 Symposium: Effective Communication as a Powerful Management Tool
© 2024 by the author(s). Licensee EWA Publishing, Oxford, UK. This article is an open access article distributed under the terms and
conditions of the Creative Commons Attribution (CC BY) license. Authors who
publish this series agree to the following terms:
1. Authors retain copyright and grant the series right of first publication with the work simultaneously licensed under a Creative Commons
Attribution License that allows others to share the work with an acknowledgment of the work's authorship and initial publication in this
series.
2. Authors are able to enter into separate, additional contractual arrangements for the non-exclusive distribution of the series's published
version of the work (e.g., post it to an institutional repository or publish it in a book), with an acknowledgment of its initial
publication in this series.
3. Authors are permitted and encouraged to post their work online (e.g., in institutional repositories or on their website) prior to and
during the submission process, as it can lead to productive exchanges, as well as earlier and greater citation of published work (See
Open access policy for details).
References
[1]. ZHANG Weichong, WANG Fang, HUANG Yi. Research on big data policy knowledge modeling in Guizhou Province based on graph database[J]. Digital Library Forum, 2020, (04):30-38.
[2]. HONG Yinxing, REN Baoping. Connotation and ways of deep integration of digital economy and real economy[J]. China Industrial Economy, 2023, (02):5-16.
[3]. Cai Fang. How China's economic growth is shifting to total factor productivity-driven[J]. China Social Science, 2013, (01):56-71+206.
[4]. Meng J, Han WL . New quality productivity theory: a historical materialist interpretation[J]. Economic Research, 2024, 59 (3): 29-33
[5]. LI Hualong, LI Zhongwen, YANG Kefan, et al. Whether big data policy can catalyze new quality productivity of enterprises--a quasi-natural experiment based on national-level big data comprehensive pilot zone[J]. China Science and Technology Forum, 2025, (02):137-149.
[6]. ZHAO Peng, ZHU Yenan, ZHAO Li. State-level Big Data Comprehensive Pilot Zones and New Quality Productivity - Empirical Evidence Based on 230 Cities[J]. Journal of Chongqing University (Social Science Edition), 2024, 30(04):62-78.
[7]. Huang Jing, Yang Wensheng. A supply chain decision model based on CVaR and supplier commitment buyback[J]. Journal of Management, 2016, 13(08):1250-1256.
[8]. MENG Hu, LIANG Xiaobei, YANG Yixiong, et al. Supply chain performance evaluation and optimization based on LMBP algorithm in the context of big data[J]. Data Analysis and Knowledge Discovery, 2018, 2(11):37-45.
[9]. Han Xiaoying. Supply chain optimization and efficiency improvement driven by new quality productivity[J]. National Circulation Economy, 2024, (24):86-89.
[10]. Liu W . Scientific understanding and practical development of new quality productivity [J]. Economic Research, 2024, 59 (3): 4-11.
[11]. LI Xinru, TIAN Zengrui, CHANG Purchyuan. New quality productivity, resource utilization and organizational resilience of firms[J]. Western Forum, 2024, 34(04):35-49.
[12]. Song Jia, Zhang Jinchang, Pan Yi. A study on the impact of ESG development on firms' new quality productivity: empirical evidence from Chinese A-share listed firms[J/OL]. Contemporary Economic Management
[13]. ZHANG Shushan, ZHANG Peiwen, GU Cheng. Enterprise digital transformation and supply chain efficiency[J]. Statistics and Decision Making, 2023, 39(18):169-173.
[14]. Zou K, Zheng Yundan, Liu Xiwei. Did the pilot policy promote the combination of science and technology and finance? ---An empirical test based on double-difference propensity score matching[J]. China Soft Science, 2022(7):172-182.
[15]. LI Xiaosheng, HU Jianbing, SONG Malin. How digital economy policies can empower the development of new quality productivity[J]. Economic Management, 2025, 47(02):5-26.
[16]. Yin Hang. Research on supply chain transparency and traceability[J]. China Logistics and Purchasing, 2025, (01):159-160.
[17]. Liu Jiamin, Ma Xiaoyu. Can Big Data Development Generate New Quality Productivity of Enterprises --A Quasi-Natural Experiment Based on the National-level Big Data Comprehensive Pilot Zone[J]. Finance and Economy, 2024, (07):1-13.