


1. Introduction
1.1. Research Background
Linking executive rewards to Environmental, Social, and Governance (ESG) achievements not only aligns business goals with societal well-being but also paves the way for enduring corporate success. In the past, executive compensation was linked to financial fields such as stock price. However, criticisms on ESG’s failure to address problems such as green washing and profit VS purpose debate had evoked the urgent need to develop a new route for ESG to facilitate the process of achieving its original purpose. By the 2010s, major capital management company such as BlackRock had started to push companies to adjust executive incentives with ESG metrics that emphasized sustainability goals. At the same time, regulatory bodies like the United States Securities and Exchange Commission further reinforced this trend through projects such as the Sustainable Finance Disclosure Regulation [1]. In 2023 73% of the firms from S&P 500 companies had bridged executive compensation to ESG metrics [2]. This reflects the trend of growing determination to make long-term value and balance out chase on financial achievement while handling ESG principles properly.
1.2. Research Significance
ESG’s application carries great potential to introduce double-winning circumstance to both businesses and society. For corporations, ESG were founded to be positively related to their financial performance in most studies that were widely distributed around the world [3]. To be more specific, solid ESG performances would promote higher flexibility in risk management and access to capital. For example, Microsoft had devoted itself to investments that are related to key ESG principles: carbon, waste, water, and ecosystems in 2023. After that, the firm had highlighted the ambition of achieving “carbon negative, water positive, zero waste” goals in 2030 [4]. This had brought Microsoft boosted investor confidence and significant progress on its shift to renewable energy. On the societal side, bridging ESG with compensations would allow them to contribute to global climate objectives. For instance, in its Sustainable Living Plan from 2010 to 2020, Unilever had made substantive progress on reducing waste footprint (by 34%) and greenhouse gas emission (51.9% of energy used in manufacture were generated by renewable resources in 2020) [5]. In terms of the environmental benchmarks established by the Paris Agreement, firms and industries were playing increasing significant roles in reinforcing them. This dual impact highlights ESG’s role in bridging profit and purpose, positioning companies as active participants in addressing global challenges rather than passive bystanders.
1.3. Current Research Progress
While prior studies had devoted a lot on exploration of ESG metric’s impact on compensation, they still lack some critical examinations on equally important areas, this had limited their validity on explaining the topic. One of the major drawbacks that was previously mentioned is their focus on short-term responses: those studies were placing their focus on immediate circumstances of the market such as stock price reactions. However, ESG metrics were meant to be studied by examine sustainability impacts in the long run. In addition, prior studies were mostly interested on analyzing Western markets in US and Europe, this had led to ignoration of diverse market in Asia and other emerging economies; due to complex cultural and social context, the findings of previous study would not be generalizable on them too.
For example, China had prioritized the goal of “peaking carbon emission by 2030 and achieving carbon neutrality before 2060” [6]. In order to accelerate the progress on accomplishing that objective, Chinese ESG policies had formulated three critical categories that navigate financial institutions over the path of sustainable development: high-level guidance, incentive mechanism, and information closure. By combining these three criteria together, Chinese firms shall yield a better understanding of ESG principles and facilitate the transparency of related policies in response to previously mentioned drawbacks of ESG employment in other nations.
Another area that was rarely covered in the past is metric ambiguity as studies would frequently conflate superficial metrics that were vague and diverse with goals that were way too substantive to fit. On the other hand, the problem of greenwashing was also poorly addressed even if it is a troublemaker that would damage firm’s reputation and bring them penalties, such as Goldman Sachs’ $4 million fine for failing to follow ESG investment policies and misleading its customers [7]. These forgotten gaps from prior studies highlights the need for more systematic research that would carefully examines the long-term, global, and measurable impacts of ESG’s role in compensation and thereby fulfill both corporate and societal goals.
1.4. Research Questions
The effectiveness of ESG on executive compensation will be explained from three perspectives:
(1) Is there a positive relationship between ESG and executive compensation?
(2) What are the boundary conditions for ESG effectiveness?
(3)Is the survey result robust?
These questions explore how well ESG principles work in encouraging better executive pay practices and offer practical advice for regulators and businesses looking to include ESG factors in their executive compensation plans down the line.
1.5. Research Contributions
This paper contributes to the field by proposing a longitudinal framework to assess ESG compensation’s impact over decades, rather than isolated individual years [8]. The research uncovers compelling evidence that Chinese enterprises demonstrating strong ESG performance tend to offer higher executive compensation packages. Based on these insights,
2. Definition and Evolution of ESG Metrics
2.1. Core Definitions and Classifications of ESG Metrics
ESG metrics is a structured evaluation tool for stakeholders, enabling them to assess how organizations address risks and opportunities across environmental stewardship, social equity, and governance integrity. This framework challenges narrow environmental views by emphasizing sustainability's need for integrated ecological resilience, social equity, and institutional accountability. By going deeper with the topic, ESG could be broken down to three major pillars: Environmental metrics, social metrics, and Governance.
Environmental metrics stress conserving natural resources and protecting ecosystems to sustain human life on Earth by reducing waste, combating climate change, and preserving biodiversity. For instance, Unilever had reduced its greenhouse gas emission by 37% in its homecare sector [5].
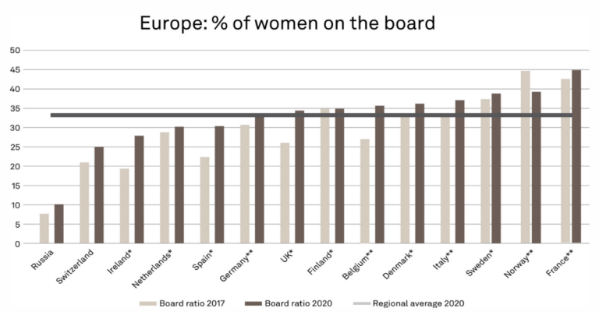
Social metrics prioritize fairness, human rights, and community progress. They aim to build welcoming societies that give everyone equal chances, free from bias or unfair treatment. This was exemplified by the increasing proportion of women on the board for reaching the balance with men [9].
Governance metrics are composed of corporate structure, board composition, business ethics and anti-corruption. Patagonia has built a strong reputation for ethical business practices by embedding environmental conservation and social responsibility into its fundamental principles. Some of its initiatives were perfect examples that exemplified ESG principles such as using recycled and organic materials in its products, ensures fair pay and safe workplaces for employees, and contributes a portion of its profits to environmental groups. (ESG PRO). These metrics are further classified into quantitative (projects that give out numerical expectations and goals) and qualitative (ones that indicate a bold direction for their moves) targets, with industry-specific standards like SASB tailoring frameworks to sectors such as oil and technology.
2.2. Historical evolution of ESG metrics globally
2.2.1. Embryonic stage (mid-20th century - late 20th century)
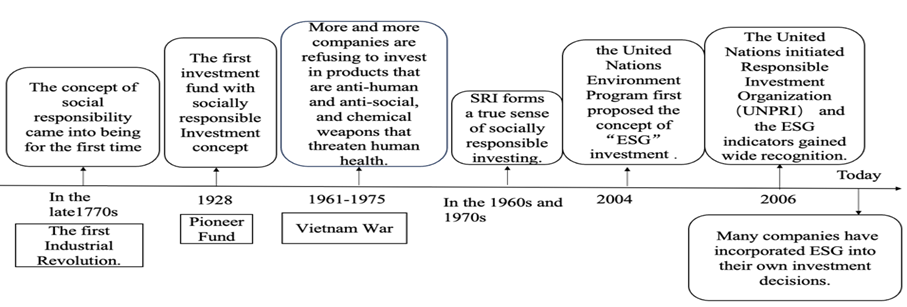
The concept of ESG was originally driven by the social dimension. The first Industrial Revolution drew people’s attention to factory conditions, and they realized that it is bad for workshop’s growth if only focus on the profit, because it would impose more human costs and even trigger labor campaigns. In the United States, many industrialists began to pay attention to the welfare and health of their workers by providing accommodations to improve their productivity. During the first Industrial Revolution, religious groups such as the Methodist established guidelines for “Social responsible” [10], thus became the original form of “social responsible investment” (SRI). Based on religious teachings, they refused to invest in businesses related to alcohol, tobacco, gambling, or weapons.
In 1928, the Pioneer Fund [10], the first investment fund with social responsible Investment concept. This foundation is based on specific ethical considerations to eliminate or increase some investments, and social responsible investors may also avoid companies related to alcohol, gambling, weapons production, environmental damage, and it is interesting to note that this is still exists today.
2.2.2. Initial formative stage (late 20th century -2004)
The social breakthrough for the topic came about ten years later, around 1970,in the midst of Vietnam War. The peace movement that followed the war was the real catalyst for SRI. The US military used nuclear weapons and even chemical weapons such as Agent Orange [10] in the war to obtain the absolute status, which was not only damage the environment, but also bring a disaster for the Vietnamese people. Even today, the Vietnam War still affects the thinking of the world on war and peace,and more and more people are rejecting this controversial practice of war. In the 1960s and 1970s, the original intention of SRI gradually changed from a religious doctrine to a reflection of social ideology, thus forming a true sense of "socially responsible" investment. In 1987, the Responsible Investment Declaration was released, which marked the beginning of the ESG. In 2004, the United Nations Environment Program first proposed the concept of ESG investment.
2.2.3. Rapid development stage (2004 to today)
In 2006, the United Nations launched the Principles for Responsible Investment Organization (UNPRI). At the beginning of its establishment, more than 80% of the signatories came from Europe and the United States. Today, global institutions and corporations have incorporated ESG factors into their decision-making systems.
3. Integration of ESG metrics in executive pay
3.1. How corporations incorporate ESG into executive compensation systems
3.1.1. Incentive contracting
In terms of incentive mechanisms, executive compensation has a positive effect on enterprise performance, that is, the higher the executive compensation level, the higher the enterprise value. [11]. Material incentive is one of the more common incentive ways, which is usually explicit incentive, including monetary compensation, stock options. Spiritual motivation is usually non-material hidden motivation, including social status, excellent reputation and so on. From the perspective of the length of incentive time, it can be divided into short-term and long-term incentive. The main way of short-term incentive is monetary incentive, such as performance compensation and profit sharing, it usually associated with performance and can be cashed in a short period of time. Equity incentive is the main way of long-term incentive, which is focus on the overall long-term interests of the organization. Through incentive contracting, the use of ESG index can adjust the enterprise risk.
3.1.2. Stakeholder preference alignment
The adoption of ESG compensation can serve as a mechanism for aligning the objectives of management with owners’ preferences. For instance, asset managers could support the adoption of ESG metrics in executive pay plans help portfolio companies attract investors focused on ESG outcomes. Shareholders not only concerned about financial results, but also focus on the ESG results, the adoption of ESG indicators can align the objectives of the company's management with those of shareholders. Moreover, Investors may accept lower financial returns to prioritize ESG progress, pushing companies to incorporate ESG criteria into executive compensation. Make it have ESG preferred customers [12].
3.2. Case study analysis
In this chapter, we categorize cases into success vs. failure groups and analyze differences in ESG compensation design.
3.2.1. Success groups: Apple
(1) Labor: Back to 2017, Apple issued a compensation equity commitment to maintain pay equity. It’s compensation equity goals include: 1:1 global gender pay equity; Pay equity by race and ethnicity in the United States at 1:1; 1:1 Gender pay parity across countries. Apple also employs independent third-party experts to assess and address differences based on race and ethnicity and gender intersections in the United States.
(2) Executive compensation: Before ESG were included in Apple, Tim Cook, Apple's CEO, Cook would receive an additional bonus equal to 50% of the base salary, and if it exceeded the highest standard, it would receive a bonus equal to twice the base salary. Starting in 2021, Apple's compensation committee incorporated ESG into its annual cash incentive plan for executives. For example, his total compensation is made up of base salary, stock awards, performance-based awards, and other compensation (insurance, security, air travel, etc.)
3.2.2. Failure groups: China Evergrande Group
Since 2021, China Evergrande Group has been in deep financial crisis. Evergrande Group has carried out the work of streamlining institutions, optimizing personnel, and significantly reducing salaries, but the huge debt crisis is still the biggest dilemma facing the group at this stage.
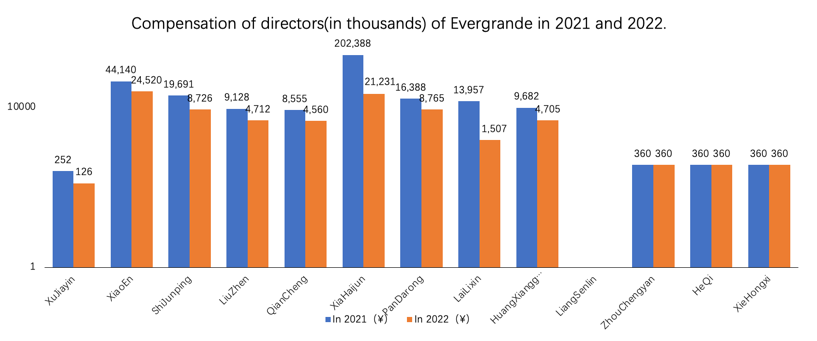
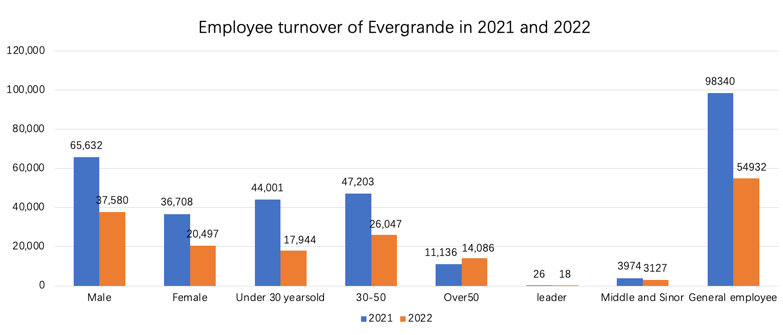
From the perspective of executive compensation of Evergrande Group from 2021 to 2022, executive compensation in 2022 is generally significantly lower than that in 2021. In addition to senior executives, Evergrande employees are also facing salary cuts and layoffs. In 2022, Evergrande Group lost 58,077 employees, as can be seen from the following table, the number of ordinary employees losing the most. It is obvious that Evergrande's ESG work performance is not good.
Although Evergrande Group is in financial distress, its management still receive an annual salary of more than 10 million yuan while ordinary employees are not paid in full, which has caused labor disputes and has been fined 50,000 yuan. In terms of labor security, Evergrande has proposed in the report that it will protect the basic interests of general employee, but there is no relevant data support.
Differences: Compared with the successful case of Apple, Evergrande is facing a serious financial distress, the reason is Evergrande does not take care of the compensation and interests of ordinary employees. However, the executive compensation of Evergrande Group is obviously too high, which is not in line with the law of the market and social fairness.
3.3. Design and challenges of incentive mechanisms
In terms of incentive mechanisms, executive compensation has a positive effect on enterprise performance, that is, the higher the executive compensation level, the higher the enterprise value. However, when executive do not have excellent ability, they usually employ professional person for daily operation. Therefore, the situation of separation of ownership and control has emerged, which has led to the principal-agent problem. Based on the principal-agent theory, when the ownership and control power are separated, the agent may use the power for personal interest. Therefore, enterprises need to encourage and restrict senior managers to put corporate interests first to reduce agency costs [13].
On the other hand, in social and economic activities, some people can obtain information, but others cannot have through various methods, which is called asymmetry information. Moral hazard is also caused by asymmetric information, In the process of operation and management, people usually choose to conceal negative information and incline to disclose more positive information to avoid some costs. For example, executives show the public the whitewashed falsity ESG performance misleads people's judgment of the current situation of the enterprise and makes all stakeholders think that the development of the enterprise is good. What’s more, external stakeholders can only know the situation of enterprises through publicly disclosed information [14], and they are at a disadvantageous position with incomplete information.
4. Longitudinal Study Methodology
4.1. Data Sources and Sample Selection
The focus of this study is to incorporate environmental, social, and governance (ESG) standards into executive compensation. The purpose is to fill the theoretical and practical gaps in this field. Despite global attention to linking ESG performance to compensation, its long-term impact has not been fully explored.
Adopting a mixed method. Fixed effects panel regression was applied to 46701 observation datasets of 5432 companies in the CSMAR and Wind databases of Chinese A-share listed companies from 2010 to 2023. This ensures the comprehensiveness and representativeness of the data.
Analysis shows a significant positive correlation between ESG indicators and executive compensation (coefficient=7.755, p<0.01). However, the effectiveness of this connection depends on factors such as company size, financial condition, and governance. Larger companies and companies with higher ROA exhibit higher consistency. This study enriches the understanding of sustainable finance and provides practical recommendations for better integrating corporate incentives with sustainable development goals.
4.2. Quantitative and Qualitative Research Methods
4.2.1. Quantitative Analysis
(1) Fixed-Effects Panel Regression: This method helps account for differences between companies and over time [15].
(2) Hausman Test: This test was used to confirm that fixed-effects models are better than random-effects models [16].
(3) Generalized Method of Moments (GMM): This method helps address potential issues with ESG metrics [17].
4.2.2. Qualitative Analysis
Content analysis of ESG disclosure standards and executive pay contracts was performed to contextualize quantitative findings [18].
|
Variables |
(1) |
(2) |
(3) |
(4) |
|
AEC |
1.000 |
|||
|
ESG |
0.213* (0.000) |
1.000 |
||
|
Size |
0.421* (0.000) |
0.269* (0.000) |
1.000 |
|
|
ROA |
0.013* (0.004) |
0.035* (0.000) |
0.005 (0.315) |
1.000 |
|
***p<0.01, **p<0.05, *p<0.1 |
||||
4.3. Research Hypotheses and Variable
4.3.1. Hypotheses
H1: The level of executive compensation(AEC) is positively correlated with corporate ESG performance.
4.3.2. Variables definitions
(1)Dependent Variable:
AEC (Average Executive Compensation), an indicator reflecting the level of executive compensation within a company.
(2)Independent Variables:
ESG, scored on a scale of 1 to 8, represents the performance of a company in terms of Environmental, Social, and Governance (ESG) practices.
(3)Control Variables:
Size: Firm size, measured by common logarithm of total assets.
ROA: Financial performance, measured by return on assets.
|
Variable |
Obs |
Mean |
Std.Dev. |
Min |
Max |
|
Year |
46701 |
2017.691 |
3.96 |
2010 |
2023 |
|
AEC |
46694 |
74.023 |
75.197 |
0 |
2010.77 |
|
ESG |
46701 |
4.1 |
0.966 |
1 |
8 |
|
Size |
46701 |
9.659 |
0.659 |
5.679 |
13.65 |
|
ROA |
46701 |
0.03 |
0.628 |
-48.316 |
108.366 |
4.4. ESG- Executive Compensation Model Building
To explore the relationship between firms' ESG metrics and executive compensation levels, we modeled the following based on panel regression:
where
5. Data Analysis and Results
5.1. The Relationship Between ESG Metrics and Executive Compensation.
Empirical results show a significant link between ESG performance and executive pay, and its analysis uses fixed-effects regression. The analysis reveals that companies with higher ESG scores tend to provide greater remuneration to their executives. The estimated coefficient for ESG scores is 7.755 (t-value = 23.50, p < 0.01), suggesting that improved ESG performance is positively linked to increased executive pay.
To further validate this relationship, a pairwise correlation analysis was conducted, producing a positive and statistically significant correlation coefficient of 0.213 (p < 0.01) between ESG scores and executive compensation. This result emphasizes the growing trend among organizations to align executive rewards with sustainability performance metrics.
Moreover, multiple checks were conducted to confirm the reliability of the results. The Hausman test (χ² = 587.19, p = 0.000) confirmed the suitability of the fixed-effects model over the random-effects alternative. To address potential endogeneity issues, the Generalized Method of Moments (GMM) was employed. These methodological safeguards reinforce the conclusion that ESG metrics are not only measures of corporate sustainability but also significant factors in shaping executive remuneration.
To explore how ESG factors relate to executive pay, corporate reputation studies show better ESG results boost company worth. This effect is particularly significant in companies such as non-state-owned enterprises, where ESG performance more effectively translates into financial and reputational gains [19]. As is well known, higher company value correlates with higher executive pay. Thus, better ESG performance might lead to higher executive pay, aligning with our study results.
|
AEC |
Coef. |
St.Err. |
t-value |
p-value |
[95% Conf |
Interval] |
Sig |
|
ESG |
7.755 |
0.33 |
23.50 |
0 |
7.108 |
8.402 |
*** |
|
Size |
42.108 |
0.485 |
86.85 |
0 |
41.157 |
43.058 |
*** |
|
ROA |
1.593 |
0.497 |
3.21 |
0.001 |
0.619 |
2.567 |
*** |
|
Constant |
-364.528 |
4.518 |
-80.68 |
0 |
-373.384 |
-355.672 |
|
|
Mean dependent var |
74.023 |
SD dependent var |
75.197 |
||||
|
R-squared |
0.176 |
Number of obs |
46694 |
||||
|
F-test |
3317.108 |
Prob > F |
0.000 |
||||
|
Akaike crit.(AIC) |
523433.517 |
Bayesian crit.(BIC) |
523468.523 |
||||
|
***p<0.01, **p<0.05, *p<0.1 |
|||||||
5.2. Key Tests
In order to strengthen the research results, several important tests were conducted.
5.2.1. F-test
|
AEC |
Coefficient |
Std.err. |
t |
P > | t | |
[95% conf. |
interval] |
|
ESG |
7.75522 |
0.3300005 |
23.50 |
0.000 |
7.108414 |
8.402026 |
|
Size |
42.10757 |
0.4848262 |
86.85 |
0.000 |
41.1573 |
43.05784 |
|
ROA |
1.593111 |
0.4970251 |
3.21 |
0.001 |
0.6189342 |
2.567287 |
|
_cons |
-364.5278 |
4.518331 |
-80.68 |
0.000 |
-373.3838 |
-355.6718 |
|
sigma_u |
16.881225 |
|||||
|
Sigma_e |
65.765227 |
|||||
|
rho |
0.06181632 |
(fraction of variance due to u_i) |
||||
|
F test that all u_i = 0: F(13, 46677) = 222.79 Prob > F = 0.0000 |
||||||
The F-test evaluated the significance of individual fixed effects in the model. The F-statistic is 222.79, with a p-value of 0.0000, much lower than 0.05. This allows us to reject the null hypothesis that all individuals have a fixed effect of zero. Therefore, the fixed effects model is appropriate as it controls for individual differences and can more accurately estimate the variable impact on executive compensation.
5.2.2. VIF Analysis
|
Variable |
VIF |
1/VIF |
|
ESG |
1.08 |
0.926470 |
|
Size |
1.08 |
0.927428 |
|
ROA |
1.00 |
0.998902 |
|
Mean VIF |
1.05 |
Variance Inflation Factor (VIF) analysis tested multicollinearity. The average VIF is 1.05, close to 1. ESG's VIF is 1.08, Size is 1.08, and ROA is 1.00. Their 1/VIF values indicate that the contribution of variables to the model is independent, thus validating the regression results.
5.2.3. GMM
|
Estimates efficient for homoskedasticity only Statistics consistent for homoskedasticity only Number of obs = 40832 F (3,36195) =2327.96 Prob > F = 0.0000 Total (centered) SS = 86746056.59 Centered R2 = 0.1605 Total (uncentered) SS = 86746056.59 Uncentered R2 = 0.1605 Residual SS = 72822969.9 Root MSE =44.85 |
||||||
|
AEC |
Coef. |
Std. Err. |
z |
P >| z | |
[95% Conf. |
Interval] |
|
ESG |
-1.359761 |
0.9084073 |
-1.50 |
0.134 |
-3.140206 |
0.4206848 |
|
Size |
76.01874 |
0.9367033 |
81.16 |
0.000 |
74.18284 |
77.85465 |
|
ROA |
0.0114159 |
0.0035783 |
3.19 |
0.001 |
0.0044026 |
0.0184293 |
|
Underidentification test (Anderson canon. Corr. LM statistic): 4521.088 Chi-sq(1) P-val = 0.0000 |
||||||
|
Weak identification test (Cragg-Donald Wald F statistic): 5165.932 Stock-Yogo weak ID test critical values: 10% maximal IV size 16.38 15% maximal IV size 8.96 20% maximal IV size 6.66 25% maximal IV size 5.53 Source: Stock-Yogo ( 2005 ). Reproduced by permission. |
||||||
|
Sargan statistic (overidentification test of all instruments) : 0.000 (equation exactly identified) |
||||||
The model introduces the lagged variable ESG _lag as an excluded instrument,and the result shows that the Cragg-Donald Wald F statistic (5165.932) far exceeds the Stock-Yogo critical values (16.38 at the 10% level), indicating that ESG _lag is a strong instrument capable of addressing endogeneity. The Anderson LM test (p=0.000) further confirms the relevance between the instrument and the endogenous variable, reinforcing model reliability.
Although the coefficient of contemporaneous ESG is negative (Coef.=-1.36), its statistical insignificance (p=0.134) shows there may be a time-lagged effect. The model assumes that lagged ESG (ESG _lag) influences current ESG performance, which in turn affects executive compensation. For instance, ESG investments may need to improve financial performance, governance, or market reputation over time before they are reflected in compensation adjustments. Other positive effects such as company size (Size) and return on assets (ROA) (Coef.=76.02 and 0.011, p=0.000 and 0.001) indicate that the direct impact of company size and immediate financial performance on executive compensation is more pronounced, further highlighting the lagging characteristics of ESG effects. The Sargan statistic (0.000) confirms the model is exactly identified, ensuring no over-identification issues.
5.3. Boundary Conditions: ESG Compensation Effectiveness
The effectiveness of linking executive compensation to ESG goals varies depending on boundary conditions, primarily company size and financial performance.
Company size: Large companies are more effective in incorporating ESG indicators into executive compensation. Regression analysis shows that company size has a significant positive coefficient (β=42.108, p<0.001). They have more resources and better infrastructure, which promotes the implementation of ESG goals and accurate performance evaluation in compensation plans.
Financial performance: Companies with better ROA are more likely to adopt compensation linked to ESG. ROA is positively correlated with ESG compensation effectiveness (β=1.593, p=0.001). A strong financial position enables the company to flexibly invest in sustainable practices and align executive incentives with ESG goals. Companies facing financial difficulties may not have the ability to prioritize ESG related compensation.
5.4. Recommendations
Based on research findings, we have made the following recommendations for regulators and companies:
5.4.1. Recommendations for Regulators:
ESG Disclosure Standards: Regulators should create standardized ESG reporting rules to ensure consistency and comparability across companies. This would help investors and stakeholders make better decisions and encourage firms to adopt best practices.
Incentive Mechanisms: Regulators could offer incentives, like tax breaks or subsidies, to companies with strong ESG performance. This would motivate firms to focus more on sustainability.
5.4.2. Recommendations for Corporations:
Standardization of ESG Metrics: Companies should use consistent frameworks to measure ESG performance. This reduces confusion and makes ESG-linked compensation more credible [20].
Integration of ESG Goals into Compensation Design: Firms should align ESG metrics with their long-term strategies and include them in executive pay contracts. This ensures sustainability goals are prioritized and rewarded [21].
Transparency in ESG Disclosures: Companies should provide clear, detailed, and verifiable data on their ESG performance. Transparent reporting builds trust with stakeholders and strengthens the legitimacy of ESG-linked pay [22].
Tailored ESG Compensation for Firm Size and Financial Performance: Firms should design ESG-linked pay plans based on their size and financial health. Larger companies and those with strong financial performance may have more resources to implement these programs effectively [23].
6. Conclusion
This study delved into the integration of ESG metrics in executive compensation, aiming to address the long - term effectiveness of ESG - based incentives and related issues. We analyzed large amount of data on China A-share Listed Companies from 2010 to 2023, which sourced from CSMAR databases, and Wind databases. Employing both quantitative methods and qualitative analysis of ESG disclosure standards and executive pay contracts, we conducted a comprehensive research. The results indicate a significant positive correlation between ESG scores and executive pay. Higher ESG scores are associated with greater executive compensation. Larger companies and those with stronger financial performance are more likely to integrate ESG metrics into executive pay effectively. This research provides valuable insights for promoting the effective integration of ESG in executive compensation, contributing to corporate long - term sustainability and social responsibility.
References
[1]. Commission, U. S. S. A. E. (2024, March 6). SEC Adopts Rules to Enhance and Standardize Climate-Related Disclosures for Investors. U. S. Securities and Exchange Commission. Retrieved March 15, 2025, from https://www. sec. gov/newsroom/press-releases/2024-31
[2]. Kalfen, D. , McGough, J. , & Jarvis, T. L. S. F. O. C. (2023, July 20). Incentives linked to ESG metrics among S&P 500 companies. Harvard Law School Forum on Corporate Governance. Retrieved March 15, 2025, from https://corpgov. law. harvard. edu/2023/07/20/incentives-linked-to-esg-metrics-among-sp-500-companies/
[3]. Glendinning, I. (2013). Comparison of policies for Academic Integrity in Higher Education across the European Union. Retrieved from http://ketlib. lib. unipi. gr/xmlui/bitstream/handle%20European%20Union. pdf?sequence=2
[4]. Microsoft. (2024). 2024 Environmental Sustainability Report. Microsoft. Retrieved March 15, 2025, from https://cdn-dynmedia 1. microsoft. com/is/content/microsoftcorp/microsoft/msc/documents/presentations/CSR/Microsoft-2024-Environmental-Sustainability-Report. pdf
[5]. Unilever. (2021, March). Unilever Sustainable Living Plan 2010 to 2020 Summary of 10 years' progress. Unilever. Retrieved March 15, 2025, from https://www. unilever. com/files/92ui5egz/production/16cb778e4d31b81509dc5937001559f1f5c863ab. pdf
[6]. International Capital Market Association. (2023, January). White paper on ESG practices in China [Fact sheet]. ICMAgroup. Retrieved April 10, 2025, from https://www. icmagroup. org/assets/ Whitepaper-on-ESG-practices-in-China-ENG-January-2023. pdf
[7]. Davison, T. (2024, February 8). Greenwashing Examples: The Nine Biggest Fines Handed Out So Far. CleanHub. Retrieved March 15, 2025, from https://blog. cleanhub. com/greenwashing-examples
[8]. Schoenmaker, D. , & Schramade, W. (2018, December 11). Principles of Sustainable Finance. SSRN. Retrieved March 15, 2025, from https://papers. ssrn. com/sol3/papers. cfm?abstract_id=3282699
[9]. Froehlicher, M. , Griek, L. K. , Nematzadeh, A. , Hall, L. , & Stovall, N. (2021, February 5). Gender equality in the workplace: going beyond women on the board. S&P Global. Retrieved March 15, 2025, from https://www. spglobal. com/esg/csa/yearbook/articles/gender-equality-workplace-going-beyond-women-on-the-board
[10]. Kirchhoff, Klaus Rainer (2024). ESG: Sustainability as a Strategic Success Factor. Wiesbaden: Springer Fachmedien Wiesbaden.
[11]. Lu Jingyi (2022). Study on the impact of ESG performance on firm value and firm risk: from the perspective of Executive compensation incentive.
[12]. Kofi, M. O. , & Mallikarjunappa, T. (2019). Corporate social responsibility investment, third-party assurance and firm performance in India: The moderating effect of financial leverage. South Asian Journal of Business Studies, 8(3), 303-324. https://doi. org/10. 1108/SAJBS-08-2018-0091
[13]. Lee, J. , Koh, K. & Shim, E. D. (2024). Managerial incentives for ESG in the financial services industry: Direct and indirect association between ESG and executive compensation. Managerial Finance, 50(1), 10-27. https://doi. org/10. 1108/MF-03-2023-0149
[14]. Hastings, K. , & Cotter, M. (2015). Revisiting executive incentive compensation: A new challenge. Trustee, 68(4), 15-18. Retrieved from https://www. proquest. com/trade-journals/revisiting-executive-incentive-compensation-new/docview/1677203883/se-2
[15]. Hajivassiliou, V. A. (1988). [Review of Analysis of Panel Data. , by C. Hsiao]. Journal of Economic Literature, 26(4), 1761–1763. http://www. jstor. org/stable/2726876
[16]. Hausman, J. A. (1978). Specification Tests in Econometrics. Econometrica, 46(6), 1251–1271. https://doi. org/10. 2307/1913827
[17]. Arellano, M. , & Bond, S. (1991). Some Tests of Specification for Panel Data: Monte Carlo Evidence and an Application to Employment Equations. The Review of Economic Studies, 58(2), 277–297. https://doi. org/10. 2307/2297968
[18]. Gray Rob, Kouhy Reza and Lavers, Simon (1995). Accounting, auditing, & accountability, 8(2), 47-77.
[19]. Wang, Linlin, Lian, Y. & Dong, J. . (2022). Research on the impact mechanism of ESG performance on corporate value. Securities Market Herald, 5, 23-34.
[20]. O’Brien, R. M. (2007). A caution regarding rules of thumb for variance inflation factors. Quality & Quantity, 41(5), 673–690. https://doi. org/10. 1007/S11135-006-9018-6
[21]. Robert G. Eccles, Ioannis Ioannou, George Serafeim (2014). The Impact of Corporate Sustainability on Organizational Processes and Performance. Management Science, 60(11):2835-2857. https://doi. org/10. 1287/mnsc. 2014. 1984
[22]. Bebchuk, Lucian, and Jesse Fried (2004). Pay without Performance: The Unfulfilled Promise of Executive Compensation. Harvard University Press, 2004. JSTOR, https://doi. org/10. 2307/j. ctv2jfvcp7. Accessed 14 Mar. 2025.
[23]. Margolis, J. D. , Elfenbein, A. H. , & Walsh, J. P. (2009). Does It Pay to Be Good…and Does It Matter? A Meta-Analysis of the Relationship between Corporate Social and Financial Performance. SSRN Electronic Journal, 1-68. https://doi. org/10. 2139/ssrn. 1866371
Cite this article
Xie,Y.;Zhao,L.;Zhang,X.;Chen,Z.;Che,J. (2025). The Impact of ESG Metrics on Executive Compensation: A Longitudinal Study of Their Evolution and Effectiveness. Advances in Economics, Management and Political Sciences,191,230-243.
Data availability
The datasets used and/or analyzed during the current study will be available from the authors upon reasonable request.
Disclaimer/Publisher's Note
The statements, opinions and data contained in all publications are solely those of the individual author(s) and contributor(s) and not of EWA Publishing and/or the editor(s). EWA Publishing and/or the editor(s) disclaim responsibility for any injury to people or property resulting from any ideas, methods, instructions or products referred to in the content.
About volume
Volume title: Proceedings of ICEMGD 2025 Symposium: The 4th International Conference on Applied Economics and Policy Studies
© 2024 by the author(s). Licensee EWA Publishing, Oxford, UK. This article is an open access article distributed under the terms and
conditions of the Creative Commons Attribution (CC BY) license. Authors who
publish this series agree to the following terms:
1. Authors retain copyright and grant the series right of first publication with the work simultaneously licensed under a Creative Commons
Attribution License that allows others to share the work with an acknowledgment of the work's authorship and initial publication in this
series.
2. Authors are able to enter into separate, additional contractual arrangements for the non-exclusive distribution of the series's published
version of the work (e.g., post it to an institutional repository or publish it in a book), with an acknowledgment of its initial
publication in this series.
3. Authors are permitted and encouraged to post their work online (e.g., in institutional repositories or on their website) prior to and
during the submission process, as it can lead to productive exchanges, as well as earlier and greater citation of published work (See
Open access policy for details).
References
[1]. Commission, U. S. S. A. E. (2024, March 6). SEC Adopts Rules to Enhance and Standardize Climate-Related Disclosures for Investors. U. S. Securities and Exchange Commission. Retrieved March 15, 2025, from https://www. sec. gov/newsroom/press-releases/2024-31
[2]. Kalfen, D. , McGough, J. , & Jarvis, T. L. S. F. O. C. (2023, July 20). Incentives linked to ESG metrics among S&P 500 companies. Harvard Law School Forum on Corporate Governance. Retrieved March 15, 2025, from https://corpgov. law. harvard. edu/2023/07/20/incentives-linked-to-esg-metrics-among-sp-500-companies/
[3]. Glendinning, I. (2013). Comparison of policies for Academic Integrity in Higher Education across the European Union. Retrieved from http://ketlib. lib. unipi. gr/xmlui/bitstream/handle%20European%20Union. pdf?sequence=2
[4]. Microsoft. (2024). 2024 Environmental Sustainability Report. Microsoft. Retrieved March 15, 2025, from https://cdn-dynmedia 1. microsoft. com/is/content/microsoftcorp/microsoft/msc/documents/presentations/CSR/Microsoft-2024-Environmental-Sustainability-Report. pdf
[5]. Unilever. (2021, March). Unilever Sustainable Living Plan 2010 to 2020 Summary of 10 years' progress. Unilever. Retrieved March 15, 2025, from https://www. unilever. com/files/92ui5egz/production/16cb778e4d31b81509dc5937001559f1f5c863ab. pdf
[6]. International Capital Market Association. (2023, January). White paper on ESG practices in China [Fact sheet]. ICMAgroup. Retrieved April 10, 2025, from https://www. icmagroup. org/assets/ Whitepaper-on-ESG-practices-in-China-ENG-January-2023. pdf
[7]. Davison, T. (2024, February 8). Greenwashing Examples: The Nine Biggest Fines Handed Out So Far. CleanHub. Retrieved March 15, 2025, from https://blog. cleanhub. com/greenwashing-examples
[8]. Schoenmaker, D. , & Schramade, W. (2018, December 11). Principles of Sustainable Finance. SSRN. Retrieved March 15, 2025, from https://papers. ssrn. com/sol3/papers. cfm?abstract_id=3282699
[9]. Froehlicher, M. , Griek, L. K. , Nematzadeh, A. , Hall, L. , & Stovall, N. (2021, February 5). Gender equality in the workplace: going beyond women on the board. S&P Global. Retrieved March 15, 2025, from https://www. spglobal. com/esg/csa/yearbook/articles/gender-equality-workplace-going-beyond-women-on-the-board
[10]. Kirchhoff, Klaus Rainer (2024). ESG: Sustainability as a Strategic Success Factor. Wiesbaden: Springer Fachmedien Wiesbaden.
[11]. Lu Jingyi (2022). Study on the impact of ESG performance on firm value and firm risk: from the perspective of Executive compensation incentive.
[12]. Kofi, M. O. , & Mallikarjunappa, T. (2019). Corporate social responsibility investment, third-party assurance and firm performance in India: The moderating effect of financial leverage. South Asian Journal of Business Studies, 8(3), 303-324. https://doi. org/10. 1108/SAJBS-08-2018-0091
[13]. Lee, J. , Koh, K. & Shim, E. D. (2024). Managerial incentives for ESG in the financial services industry: Direct and indirect association between ESG and executive compensation. Managerial Finance, 50(1), 10-27. https://doi. org/10. 1108/MF-03-2023-0149
[14]. Hastings, K. , & Cotter, M. (2015). Revisiting executive incentive compensation: A new challenge. Trustee, 68(4), 15-18. Retrieved from https://www. proquest. com/trade-journals/revisiting-executive-incentive-compensation-new/docview/1677203883/se-2
[15]. Hajivassiliou, V. A. (1988). [Review of Analysis of Panel Data. , by C. Hsiao]. Journal of Economic Literature, 26(4), 1761–1763. http://www. jstor. org/stable/2726876
[16]. Hausman, J. A. (1978). Specification Tests in Econometrics. Econometrica, 46(6), 1251–1271. https://doi. org/10. 2307/1913827
[17]. Arellano, M. , & Bond, S. (1991). Some Tests of Specification for Panel Data: Monte Carlo Evidence and an Application to Employment Equations. The Review of Economic Studies, 58(2), 277–297. https://doi. org/10. 2307/2297968
[18]. Gray Rob, Kouhy Reza and Lavers, Simon (1995). Accounting, auditing, & accountability, 8(2), 47-77.
[19]. Wang, Linlin, Lian, Y. & Dong, J. . (2022). Research on the impact mechanism of ESG performance on corporate value. Securities Market Herald, 5, 23-34.
[20]. O’Brien, R. M. (2007). A caution regarding rules of thumb for variance inflation factors. Quality & Quantity, 41(5), 673–690. https://doi. org/10. 1007/S11135-006-9018-6
[21]. Robert G. Eccles, Ioannis Ioannou, George Serafeim (2014). The Impact of Corporate Sustainability on Organizational Processes and Performance. Management Science, 60(11):2835-2857. https://doi. org/10. 1287/mnsc. 2014. 1984
[22]. Bebchuk, Lucian, and Jesse Fried (2004). Pay without Performance: The Unfulfilled Promise of Executive Compensation. Harvard University Press, 2004. JSTOR, https://doi. org/10. 2307/j. ctv2jfvcp7. Accessed 14 Mar. 2025.
[23]. Margolis, J. D. , Elfenbein, A. H. , & Walsh, J. P. (2009). Does It Pay to Be Good…and Does It Matter? A Meta-Analysis of the Relationship between Corporate Social and Financial Performance. SSRN Electronic Journal, 1-68. https://doi. org/10. 2139/ssrn. 1866371