


1. Introduction
The biomedical and pharmaceutical industry has garnered widespread attention, with a general consensus that its innovative initiatives can bring significant benefits to human society and enhance people's quality of life. There is a collective hope that the biopharmaceutical sector will take concrete actions in this regard. China's "14th Five-Year Plan" National Health Plan mentions the need to promote the innovation and development of the pharmaceutical industry, encourage the research and development, innovation and use of new drugs, and accelerate the research and development and industrialization of drugs for the treatment of major diseases urgently needed in clinic [1].
Thus, it becomes evident that sustained investment in research and development (R&D) within the biomedical and pharmaceutical industry is not merely beneficial, but an operational imperative. In this process, R&D investment inherently generates the sunk cost effect, consequently exerting downward pressure on corporate profit margins. In firm management, the sunk cost effect manifests in the range of impacts that a firm's R&D investments exert on its revenue [2]. J.A. Mañez and J.H. Love contend that persistent R&D investment is highly desirable for firms, as it is associated with greater productivity growth, higher profitability, and increased innovation levels [3]. However, the relationship between R&D investment and firm profitability exhibits a more complex, nonlinear dynamic than a simple linear association. Empirical evidence now points to an inverted-U relationship: at low intensities, additional R&D outlays depress profits; at moderate levels, they begin to enhance profitability; but when pushed to excessive levels, they ultimately erode corporate profits [4].
Existing scholarship has predominantly focused on interpreting the sunk cost effect manifested in behavioral patterns of individual or collective human agents. However, the focus on its organizational-level impacts has received relatively less attention. This study aims to bridge this gap by investigating the intrinsic mechanisms linking R&D investment dynamics to firm profitability. Specifically, it dissects how the scale and rhythm of R&D outlays shape corporate earnings, offering actionable insights for strategic R&D decision-making.
2. Literature review
2.1. Sunk cost effect and prospect theory
The sunk cost effect (SCE) is when people keep putting time, money, or effort into a project that isn't working out because they have already invested resources that they can't get back [5]. David Ronayne, Daniel Sgroi, and Anthony Tuckwell support Arkes and Blumer’s view that the sunk cost effect occurs when prior resource investments (time, money, effort) drive individuals to continue an endeavor. Despite varied definitions, all agree that past sunk actions restrict current decision-making, though these actions do not affect the desirability of present options [6].
According to Kahneman and Tversky’s prospect theory, individuals weigh losses more heavily than gains of the same magnitude, a concept known as loss aversion [4]. This asymmetry can trap decision makers in a cycle of escalating commitment: having sunk irrecoverable resources—time, capital, effort—they continue investing in the hope of eventually recouping those costs, even when objective prospects are bleak. The result is a proliferation of loss-making projects that persist long after rational abandonment would have been warranted. What’s more, prospect theory describes how individuals assess potential outcomes relative to a reference point from a behavioral economics perspective. The assessment is usually influenced by loss aversion and reduced sensitivity [7]. Consequently, decision-makers of relevant firms will face these problems, thereby affecting the development of the enterprises.
2.2. R&D activities and investments
Whether firms’ persistence in R&D is due to the existence of sunk costs or to a process of learning is highly relevant both from the economic and the political perspective, as it raises completely different implications. If sunk costs are the culprit, they erect exit barriers: capital and talent remain locked in projects whose net present value has turned negative, misallocating scarce resources. By contrast, if persistence arises from learning processes that enhances innovation efficiency, policies encouraging sustained R&D engagement become essential. Moreover, given that persistent innovation boosts returns, identifying barriers to continuous R&D is crucial. Thus, quantifying how much R&D persistence links to sunk costs versus learning effects remains extremely interesting [3].
2.3. ROE
In mature markets, Return on Equity (ROE) significantly influences investor decisions and remains a critical regulatory control variable for securities oversight. The performance fluctuations of Chinese A-share listed companies correlate strongly with ROE levels, where distinct ROE values correspond to divergent performance stability and growth trajectories. Theoretically, ROE for these companies conveys both value-relevant profitability insights and predictive patterns regarding future performance dynamics and their informational significance [8].
2.4. Debt-to-Asset Ratio
In corporate management practice, the Total Liabilities divided by Total Assets (Debt-to-Asset Ratio) is a highly scrutinized metric. It demonstrates both the coverage capacity of assets over liabilities and serves as a key reference for evaluating corporate debt risk. Furthermore, this ratio is extensively employed as a vital indicator of corporate indebtedness, with numerous studies adopting it to measure corporate debt financing levels [9].
2.5. Total Asset Turnover
Total Asset Turnover serves as a robust indicator of asset utilization efficiency when a firm's total assets remain relatively constant. Total Asset Turnover can determine the revenue-generating capacity of assets. Higher Total Asset Turnover indicates faster turnover of enterprise total assets, demonstrating stronger sales capability [10]. Consequently, to some firms, higher Total Asset Turnover demonstrate superior sales execution capabilities within the organization.
3. Methodology
3.1. Data collection
This study retrieved financial data for all A-share listed firms in the pharmaceutical and biological industry, covering the four fiscal years 2021–2024 [11].
In this study, sunk costs is proxied by R&D intensity, computed as R&D investment divided by operating revenue. In corporate practice, the sunk-cost effect is revealed through the extent to which prior R&D outlays continue to shape current revenue generation [2]. Profitability is measured by the return on common stockholders’ equity (ROE), defined as net profit divided by average shareholders’ equity. ROE is widely regarded as a core indicator of a firm’s earnings power [8]. When evaluating a company's debt risk, traditional analysis methods consider Debt-to-Asset Ratio as an important indicator for measuring the company's debt risk [9]. In this study, financial risk is operationalized via the Debt-to-Asset Ratio (Total Liabilities/Total Assets). Under stable total asset conditions, Total Asset Turnover (Revenue/Average Total Assets) serves as a robust proxy for asset productivity [10].
3.2. Data processing
To mitigate the influence of extreme values and obvious data errors, this study selected samples with R&D intensity not exceeding 100%, Debt-to-Asset Ratio not exceeding 80%, Total Asset Turnover not exceeding 1.5, and absolute ROE not exceeding 30%. These filters ensure that outlying firms do not distort the identification of general empirical patterns.
4. Results and discussion
4.1. R&D intensity and financial risk
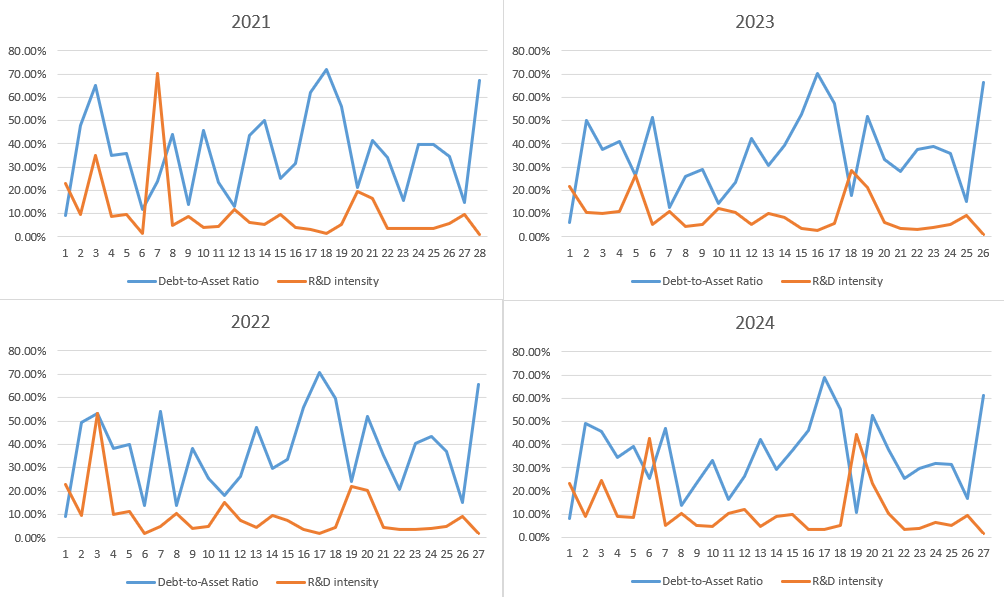
Figure 1 illustrates a pronounced inverse relationship between the Debt-to-Asset Ratio and R&D intensity across 2021–2024. The negative association is weakest in 2021, becomes more discernible in 2022 and 2023, and is most evident in 2024. Put differently, as a pharmaceutical or biological firm devotes a smaller proportion of its revenue to R&D, its leverage tends to rise; conversely, firms with higher R&D intensity exhibit lower leverage.
4.2. R&D intensity and asset utilization
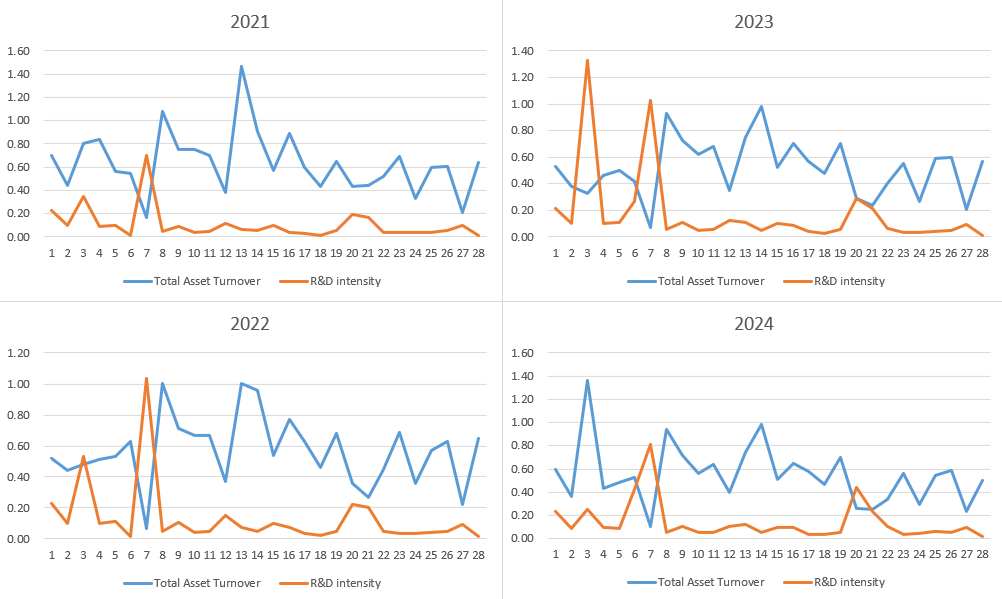
Figure 2 suggests a negative correlation between Total Asset Turnover and R&D intensity. Specifically, a higher proportion of R&D investment to operating revenue is associated with a lower asset turnover ratio. This may be because companies with high R&D intensity are often in the growth stage, where their operating revenue has not yet fully expanded, or their total assets are relatively large, leading to lower turnover efficiency. Conversely, companies with high asset turnover ratios may belong to mature enterprises that prioritize operational efficiency over substantial R&D intensity.
4.3. R&D intensity and firms profitability
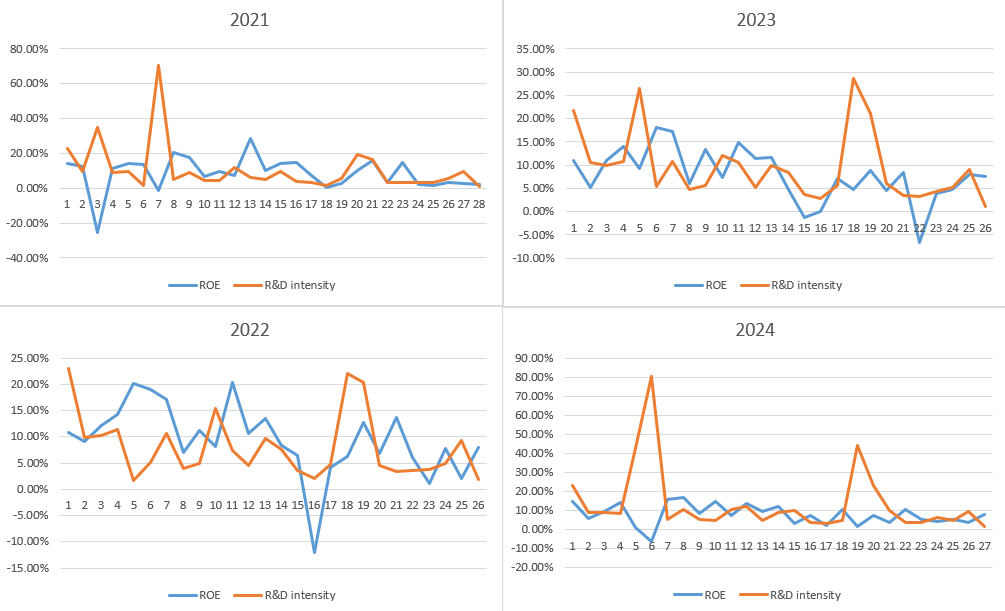
It can be seen in Figure 3 that the ROE of most enterprises with high R&D intensity will decrease or even fall to negative, resulting in a certain amount of losses. Therefore, it can be inferred that the higher the R&D intensity beyond a certain range, the lower the ROE. This observation dovetails with prior findings that R&D initially depresses profits, then enhances them at moderate levels, but ultimately erodes profitability when pushed to excess. It can be roughly speculated that there is a non-linear relationship between R&D intensity and ROE in an inverted U-shape [4].
In general, the findings reveal a consistent developmental pattern for biomedical and pharmaceutical enterprises. When R&D intensity is low, a company's profitability is primarily influenced by its Debt-to-Asset Ratio. As R&D intensity increases, factors such as enterprise scale and business type become critical determinants. For instance, total asset turnover rate largely depends on company size, while different types of enterprises adopt distinct R&D strategies: Innovative biomedical and pharmaceutical firms tend to pursue high R&D intensity, which often reduces ROE (even turning it negative), requiring them to withstand corresponding losses. Generic biomedical and pharmaceutical firms favor low R&D intensity, relying on mature products to maintain stable net profits and higher ROE.
Regardless of strategy, once R&D intensity surpasses a critical threshold, corporate profitability inevitably hits a trough, with ROE declining persistently to near-zero levels. This reflects the inherent trade-off between innovation-driven growth and short-term financial performance in the biopharmaceutical sector.
5. Conclusion
This research partially addresses the gap in studying how sunk costs affect profits in biomedical and pharmaceutical enterprises and provides enterprise-level reference points for investigating the sunk cost effect. It has showed that R&D intensity and Debt-to-Asset Ratio show a reverse trend of change, high R&D intensity and low Total Asset Turnover coexist, there is a nonlinear relationship between R&D intensity and ROE, which is roughly inverted U-shaped. Through the data we can probably get that today's biomedical and pharmaceutical enterprises can be generally divided into two categories: innovative biomedical and pharmaceutical enterprises and generic biomedical and pharmaceutical enterprises, innovative biomedical and pharmaceutical enterprises tend to adopt high-R&D intensity strategy, bear ROE decline or even losses in exchange for the construction of technical barriers, its sunk cost risk is high, but the potential return is huge; Generic biomedical and pharmaceutical enterprises maintain stable cash flow through low R&D intensity, but their profits are not high.
However, the data selection process in this study solely excluded extreme outliers for analysis. The methodology for acquiring data lacks complete scientific rigor. Subsequent research should adopt more appropriate data collection methods to obtain more reasonable datasets for deeper analysis, thereby yielding more detailed and specific findings. Regarding the conclusion that "R&D intensity and ROE exhibit a nonlinear (roughly inverted U-shaped) relationship," this study did not determine the specific inflection point interval of the U-curve. Future studies should bridge these gaps.
References
[1]. Industrial and Information Technology Department. (2022). Interpretation of the "14th Five-Year" plan for the development of the pharmaceutical industry. https: //www.gov.cn/zhengce/2022-02/01/content_5671569.htm
[2]. Sutton, J. (1991). Sunk Costs and Market Structure. MIT Press, London.
[3]. Mañez, J. A., & Love, J. H. (2020). Quantifying sunk costs and learning effects in R&D persistence. Research Policy, 49(7), 104004.
[4]. Xiang, W. (2022). Research on the effect of R&D investment and non-R&D investment on profit.
[5]. Chen, Z., Güney, Ş., & John, R. S. (2024). Sunk cost effects for thee but not for me: Decisions and predictions involving others. Acta Psychologica, 251, 104557.
[6]. Ronayne, D., Sgroi, D., & Tuckwell, A. (2021). Evaluating the sunk cost effect. Journal of Economic Behavior & Organization, 186, 318–327.
[7]. Tversky, A., & Kahneman, D. (1986). The framing of decisions and the evaluation of prospects. In Studies in Logic and the Foundations of Mathematics (Vol. 114, pp. 503-520). Elsevier.
[8]. Yifeng Wan, Xue Han(2008). Research on ROE Predictive Ability and Information Value: Review and Evaluation. Accounting Monthly. 29, 78-81. doi: 10.19641/j.cnki.42-1290/f.2008.29.034.
[9]. Zhang, X., & Han, Z. (2025). Asset liability ratio and corporate debt risk: From the perspective of debt structure and asset quality. Economic and Management Research, 46(4), 134-144. Doi: 10.13502/j.cnki. Issn1000-7636.2025.04.008
[10]. Huang, H. (2021). An empirical study on main financial indicators and stock price fluctuations of listed companies. Hebei Enterprise, (7), 102-104. DOI: 10.19885/j.cnki.hbqy.2021.07.030.
[11]. Sina Finance. (2024). Market center about the pharmaceutical and biological industry. https: //vip.stock.finance.sina.com.cn/mkt/#sw_yysw
Cite this article
Li,H. (2025). The Impact of Sunk Cost Effects from Research and Development Investment on Firm Profits in Biomedical and Pharmaceutical Enterprises. Advances in Economics, Management and Political Sciences,210,51-56.
Data availability
The datasets used and/or analyzed during the current study will be available from the authors upon reasonable request.
Disclaimer/Publisher's Note
The statements, opinions and data contained in all publications are solely those of the individual author(s) and contributor(s) and not of EWA Publishing and/or the editor(s). EWA Publishing and/or the editor(s) disclaim responsibility for any injury to people or property resulting from any ideas, methods, instructions or products referred to in the content.
About volume
Volume title: Proceedings of ICFTBA 2025 Symposium: Data-Driven Decision Making in Business and Economics
© 2024 by the author(s). Licensee EWA Publishing, Oxford, UK. This article is an open access article distributed under the terms and
conditions of the Creative Commons Attribution (CC BY) license. Authors who
publish this series agree to the following terms:
1. Authors retain copyright and grant the series right of first publication with the work simultaneously licensed under a Creative Commons
Attribution License that allows others to share the work with an acknowledgment of the work's authorship and initial publication in this
series.
2. Authors are able to enter into separate, additional contractual arrangements for the non-exclusive distribution of the series's published
version of the work (e.g., post it to an institutional repository or publish it in a book), with an acknowledgment of its initial
publication in this series.
3. Authors are permitted and encouraged to post their work online (e.g., in institutional repositories or on their website) prior to and
during the submission process, as it can lead to productive exchanges, as well as earlier and greater citation of published work (See
Open access policy for details).
References
[1]. Industrial and Information Technology Department. (2022). Interpretation of the "14th Five-Year" plan for the development of the pharmaceutical industry. https: //www.gov.cn/zhengce/2022-02/01/content_5671569.htm
[2]. Sutton, J. (1991). Sunk Costs and Market Structure. MIT Press, London.
[3]. Mañez, J. A., & Love, J. H. (2020). Quantifying sunk costs and learning effects in R&D persistence. Research Policy, 49(7), 104004.
[4]. Xiang, W. (2022). Research on the effect of R&D investment and non-R&D investment on profit.
[5]. Chen, Z., Güney, Ş., & John, R. S. (2024). Sunk cost effects for thee but not for me: Decisions and predictions involving others. Acta Psychologica, 251, 104557.
[6]. Ronayne, D., Sgroi, D., & Tuckwell, A. (2021). Evaluating the sunk cost effect. Journal of Economic Behavior & Organization, 186, 318–327.
[7]. Tversky, A., & Kahneman, D. (1986). The framing of decisions and the evaluation of prospects. In Studies in Logic and the Foundations of Mathematics (Vol. 114, pp. 503-520). Elsevier.
[8]. Yifeng Wan, Xue Han(2008). Research on ROE Predictive Ability and Information Value: Review and Evaluation. Accounting Monthly. 29, 78-81. doi: 10.19641/j.cnki.42-1290/f.2008.29.034.
[9]. Zhang, X., & Han, Z. (2025). Asset liability ratio and corporate debt risk: From the perspective of debt structure and asset quality. Economic and Management Research, 46(4), 134-144. Doi: 10.13502/j.cnki. Issn1000-7636.2025.04.008
[10]. Huang, H. (2021). An empirical study on main financial indicators and stock price fluctuations of listed companies. Hebei Enterprise, (7), 102-104. DOI: 10.19885/j.cnki.hbqy.2021.07.030.
[11]. Sina Finance. (2024). Market center about the pharmaceutical and biological industry. https: //vip.stock.finance.sina.com.cn/mkt/#sw_yysw