


1. Introduction
Nowadays, the new energy vehicle industry, as a strategic emerging industry that promotes global energy transformation, addresses climate change, and promotes the upgrading of the automotive industry and sustainable economic development, is widely known for its key significance in ensuring energy security, reducing environmental pollution, and cultivating new economic growth points. China, with its vast market size and well-established industrial chain layout, has become the core market of this industry and occupies a dominant position in global production and sales. In the process of industrial development, China has taken government subsidy policies (such as purchase subsidies, purchase tax reductions, investment support for charging facility construction, etc.) as an important driving force, which not only lowers the threshold for consumers to buy cars and stimulates market demand, but also helps enterprises share research and development costs and accelerate technological iteration, profoundly affecting the global market supply and demand balance and core business decisions of enterprises. However, as the industry matures, excessive reliance on policy subsidies has led to a lack of endogenous driving force for technological innovation in some enterprises, and the requirement of transitioning from "policy transfusion" to "market hematopoiesis" is faced by the industry. Since 2020, China has systematically promoted the reduction of subsidies for new energy vehicles: subsidy standards have been tightened year by year, coverage has been continuously reduced, and the intensity has continued to weaken; After 2022, the rate of decline will significantly accelerate; In 2023, the purchase subsidy policy will officially withdraw, marking a new stage of market driven development for the industry. Enterprises need to face competition directly to achieve innovation and change.
So, as a key observation window for industry policy transformation, what specific impacts will the policy variable of subsidy reduction have on the sales structure of enterprises (such as model level distribution, price band proportion, energy type composition, etc.), and how does its internal mechanism operate? Answering this question not only demonstrates the linkage effect between policies and corporate strategies but also provides a typical example for understanding how policy adjustments guide enterprises to optimize their strategies and adapt to market demands.
This article is based on time series data of the industry from 2020 to 2025 (as of the first half of the year), constructing a dataset that includes sales of different vehicle models (divided by power and technology routes) and subsidy amounts. Based on existing data, the system analyzes the transmission line and mechanism of subsidy reduction policies affecting changes in enterprise sales and follows the dynamic impact of subsidy reduction on the sales of the new energy vehicle industry over the course of the full cycle, and incorporates new policy variables and market factors in the post-subsidy era. The acquisition of relevant research conclusions will clarify the quantitative relationship between policy adjustments and market performance, explain the structural differences and dynamic changes in industry dependence on policies, and provide an empirical basis and important references for subsequent industrial policy formulation and corporate strategic adjustments.
2. Literature review
2.1. The core connotation and evolutionary logic of subsidy policies for new energy vehicles
The subsidy policy for new energy vehicles is an institutional arrangement by the government to promote industrial development through economic incentives. Its core mechanism is to lower the market access threshold through direct funding subsidies, tax reductions, and other means, and balance the cost difference between new energy vehicles and traditional fuel vehicles. China's subsidy policy presents obvious phased characteristics: from 2009 to 2019 is the policy cultivation period, with loose subsidy standards and wide coverage, forming a "universal" incentive system [1]. As early as 2013, car purchase subsidies and tax reductions were proven to significantly increase consumers' initial acceptance of new energy vehicles [2]. Starting from 2020, have entered a period of structural adjustment, with subsidy standards gradually tightening year by year (such as increasing the threshold for range and upgrading energy density requirements), and the coverage of vehicle models shifting towards high cost-effective products [3]. The official withdrawal of purchase subsidies in 2023 marks the critical point of the industry's transition from policy retreat to market takeover [4]. In addition to purchasing subsidies, some cities have started to reduce usage costs through subsidies for charging station facilities. Beijing's practical experience indicates that such subsidies can indirectly increase demand for new energy vehicles through the housing market [5].
2.2. Time series research on the impact of subsidy policies on sales volume
Early research based on time series data generally confirmed the significant promotion effect of subsidies on sales. Zhang&Bai calculated that a subsidy of every 10000 yuan can drive an 8% -15% increase in sales of new energy vehicles with quarterly data from 2006 to 2016, and this effect is particularly prominent during the peak subsidy period from 2013 to 2015 [1]. Ma et al. further validated the "demand activation" effect of subsidy policies during the market cultivation period by modeling monthly data from 2010 to 2018. Their impulse response analysis showed that the cumulative response of sales after policy shocks reached its peak in 6-12 months [6].
In cross-border comparative research, Zhou&Liu integrated annual data from major countries in China and Europe during 2015 and 2022 and found that the boost effect of subsidy policies on sales has a time decay characteristic: the elasticity coefficient in the early stage of policy implementation (1-3 years) is 0.35-0.52, and after 5 years of implementation, it drops to 0.12-0.23, confirming the law of diminishing marginal utility of subsidies. This provides a reference for understanding the policy logic of China's subsequent subsidy reduction [7].
As policies enter a period of adjustment, scholars begin to use time series data to track market responses during the decline phase. Based on monthly data of A-share listed companies from 2020 to 2022, Sun et al. found that there is a "stepwise negative correlation" between subsidy reduction and sales growth rate: when the reduction rate is 10% -15% in 2020, the sales growth rate decreases by 2-3 percentage points; When the decline rate exceeds 30% in 2022, the decline in growth rate will expand to 5-7 percentage points, and this impact will show a significant lag effect in quarterly data (1-2 quarters behind) [8]. Shan's research on Build Your Dreams (BYD) weekly sales data from 2020 to 2023 shows that the market response to the policy of reducing prices exhibits a "short-term fluctuation long-term adaptation" characteristic: after the policy is announced, sales briefly increase (by 10% -15% month on month) due to the "catch the last bus" effect for 1-2 weeks, then enter an adjustment period (by 5% -8% month on month) for 4-8 weeks, and finally form a new sales equilibrium point after 3 months. This feature reveals the buffering effect of consumer expectations on policy shocks [4].
2.3. Research progress on the heterogeneous response of the sales structure
Existing research focuses on the correlation between subsidy policies and sales of new energy vehicles. The policy tool theory suggests that subsidies, as an incentive tool to regulate the market, affect supply and demand by reducing transaction costs. Early research has shown that subsidies have a significant promoting effect on sales. Zhang&Bai calculated that subsidies per 10000 yuan in the Chinese market can increase sales growth rates by 8% -15%, while subsidy reduction, as a reverse adjustment, has heterogeneous effects. Shan found that subsidies have a significant impact on low-end car models that rely on subsidies, but have a weaker impact on high-end car models. The market signal theory suggests that policy changes transmit industry trend signals to the market, affecting consumer decision-making. Subsidy reduction may suppress demand in the short term due to rising car purchase costs, but in the long term may strengthen consumers' attention to the technological strength of enterprises. Experimental results show that after the subsidy is reduced, the demand elasticity of mid to low price models is significantly higher than that of high-end models, and consumers are more concerned about range and charging convenience [9]. Sun et al. found that after the decline, consumers' attention to technical parameters increased, driving the proportion of plug-in hybrid vehicle sales in the industry to rise, confirming the impact of signal transmission on the industry's sales structure. The theory of industrial life cycle divides the new energy vehicle industry into different stages, and the reduction of subsidies is a sign of the transition from the growth stage to the maturity stage. In Li et al.'s research, the model shows that the industry as a whole has shifted from policy dependence to technology and market-driven, and the differentiation between top enterprises and small and medium-sized enterprises has intensified [10]. The spillover effect of subsidies spreads upstream along the supply chain, and top enterprises with vertical integration capabilities can reap more innovation rents, while small and medium-sized enterprises face crowding out [11]. Moreover, in the post subsidy era, industry sales growth relies more on the advantages of the entire industry chain and market strategies, which provides a theoretical basis for analyzing the sources of industry sales resilience [12]. From the viewpoint of the industrial chain, subsidies provide diminishing incentives for technological innovation as they are applied to batteries, motors, and electronic controls, with the upstream battery sector receiving the greatest benefit [13]. However, there are shortcomings in existing research. In terms of dynamic analysis of policy tools, although the static impact of slope reduction is explored, the dynamic matching relationship between "slope reduction amplitude - speed of enterprise strategy adjustment - sales response" has not been systematically studied. The research on the market signal transmission mechanism lacks in-depth analysis on how changes in consumer expectations specifically affect the sales of different price bands of car models. From the perspective of the industry lifecycle, there is insufficient attention paid to the internal logic of sales structure adjustment for top enterprises throughout the entire cycle, especially the role of new policy variables after 2023.
2.4. The limitations of existing research and the supplementary directions of this study
Existing studies still have three limitations. First, the coverage of periods is incomplete. It is challenging to capture the new market features of the post-subsidy period because most of the research conclude in 2022 and do not dynamically monitor the entire withdrawal stage beyond 2023. Secondly, there is insufficient analytical depth, with inadequate exploration of the monthly/quarterly time series correlations of sales volume by vehicle type throughout the complete cycle from 2020 to 2025, especially the lack of refined matching analysis between the rise of plug-in hybrid models and the rhythm of subsidy withdrawal. Third, regarding methodological limitations, existing time series models mostly adopt a single policy variable (such as subsidy amount) and do not fully integrate time trend variables such as macroeconomics and technological progress, which may overestimate the net effect of policy shocks.
Although existing studies have paid attention to the impact of subsidy policies on the new energy vehicle industry, there is still room for improvement in dynamic tracking of the entire industry and refined analysis. On the one hand, most studies focus on specific periods (such as before subsidy withdrawal) or a single dimension (such as total sales volume), lacking continuous tracking of sales volume across the entire industry in the first half of 2020-2025 (covering the stable subsidy period, accelerated withdrawal period, and post-subsidy era); on the other hand, insufficient attention has been paid to the differentiated responses of different vehicle types within the industry during the withdrawal process, making it difficult to reveal the adjustment rules of the industry's sales structure under policy shocks.
Based on this, this paper argues that the focus should be placed on the time series data of the new energy vehicle industry in the first half of 2020-2025. By constructing a dataset containing variables such as sales volume by vehicle type and subsidy amount, in the new energy vehicle sector, it is essential to integrate the transmission path of "subsidy withdrawal - enterprise strategy adjustment - sales volume change" and systematically monitor the dynamic impact of the full cycle of subsidy withdrawal on sales volume, and incorporate new policy variables and market factors in the post-subsidy era. This is to reveal the specific mechanism by which subsidy withdrawal affects changes in new energy vehicle sales volume, provide more targeted empirical evidence for understanding the interactive relationship between policy adjustments and sales volume changes, and offer references for enterprises in the industry to cope with market transformation.
3. The impact of the gradual reduction of subsidies for new energy vehicles on changes in enterprise sales volume
Combining the sales data of different vehicle types from January 2020 to June 2025 with the policy process of new energy vehicle subsidy withdrawal (withdrawal initiated in 2020, accelerated in 2022, and official termination of subsidies in 2023), Figure 1 clearly shows the dynamic impact of policy adjustments on enterprise sales. This impact exhibits significant differences across different stages, vehicle types, and enterprises.
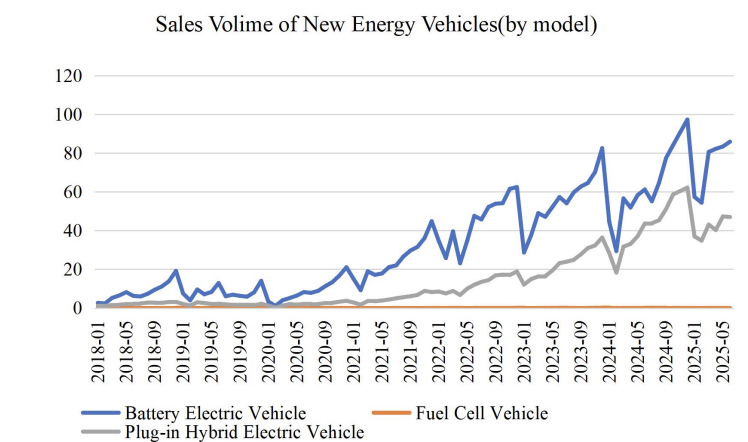
The period 2020-2021 was a stable subsidy period, where subsidy standards were gradually tightened but still retained substantial intensity. Battery electric car sales rose at an average annual growth rate of 127% throughout this period, from 33,500 units to 448,100 units. The sales volume of plug-in hybrid electric vehicles (hereinafter referred to as "plug-in hybrids") rose from 12,700 units to 82,400 units, with an average annual growth rate of 98%. In this stage, the underpinning effect of subsidies on the market was evident. As calculated by Zhang & Bai, each 10,000 yuan subsidy could still drive an 8%-10% growth in sales volume. Battery electric vehicles, having long benefited from subsidy policies, maintained a sales proportion of over 80%, reflecting the market's strong dependence on policies.
2022 entered the accelerated withdrawal period, with subsidy standards reduced by 30% compared to 2021, leading to structural differentiation in industry sales. Although battery electric vehicle sales rose from 346,300 to 624,400 units, monthly fluctuations intensified (e.g., sales plummeted to 231,100 units in April, a month-on-month decrease of 41.5%), and the growth rate slowed to 39%. Conversely, the number of plug-in hybrid cars sold increased from 84,900 to 188,800, with the growth rate surging to 122%, and their proportion rising from 20% to 23%. This confirms Shan's view: subsidy withdrawal has a more significant impact on battery electric vehicles that rely on policies, while plug-in hybrid vehicles, due to their flexibility of being "fuel-electric dual-mode," have become a transitional choice with rapidly increasing market acceptance.
In the post-subsidy era of 2023-2025, the purchase subsidy was officially terminated, and the industry shifted to market-driven growth. The sales volume of battery electric vehicles rebounded from 286,700 units to 859,000 units, with an average annual growth rate of 32%, and the fluctuation range narrowed (monthly sales in 2025 remained stable above 800,000 units). Plug-in hybrid vehicles performed even more impressively, growing from 121,000 units to 470,000 units, with a 65% average yearly growth rate, and their proportion rose to 35%. This indicates that the industry has gradually adapted to the policy withdrawal. As noted by Ye et al., in the post-subsidy era, enterprises have achieved endogenous sales growth through technological iteration (e.g., battery electric vehicles with a range of over 600 kilometers) and cost optimization (a 40% reduction in battery costs).
The sales differences among vehicles with different power types essentially reflect the differentiation in sensitivity and adaptability to subsidy withdrawal. As the core beneficiaries of subsidies, battery electric vehicles have the highest correlation with subsidy intensity (Pearson coefficient 0.72) [10]. The fluctuations in the early stage of withdrawal reflect the market's short-term resistance to rising costs, but after 2023, enterprises have driven sales back to growth through large-scale production (such as BYD's e-platform 3.0) and technological upgrading. In 2024, the sales volume of battery electric vehicles exceeded 970,000 units, an increase of 56% compared to 2022, confirming the transmission path of "policy withdrawal forcing technological upgrading" [8]. Plug-in hybrid vehicles, due to a relatively smaller reduction in subsidies (20% in 2022 vs. 30% for battery electric vehicles) and their combination of "low fuel consumption" and "no range anxiety," have become a compromise choice for consumers. Their sales volume increased 36-fold from 2020 to 2025, far exceeding the 24-fold growth of battery electric vehicles, which is consistent with the trend that BYD's models account for over 50% of sales [4]. The sales volume of fuel cell vehicles has always been below 2,000 units because subsidies are mainly directed at commercial vehicles, with insufficient support in the passenger vehicle sector, failing to form market-driven growth [12].
Strategic adjustments by micro-level enterprises have also significantly affected sales performance. After the accelerated withdrawal in 2022, BYD increased the proportion of plug-in hybrid vehicle sales from 30% in 2020 to 58% in 2023, aligning with consumers' demand for "transitional products." Its total sales volume exceeded 3 million units in 2023, a five-fold increase compared to 2020. Tesla, through mass production of 4680 batteries, reduced the cost of Model 3 by 15% and simultaneously cut prices by 10%-15%. In 2024, its battery-electric vehicles sold 842,000 units in all, a 56% increase compared to 2022, confirming that subsidy withdrawal forces enterprises to enhance Research and Development (R&D) intensity [8]. In addition, the low-end market, which relies on subsidies, has been significantly impacted: the share of A00-class battery electric vehicles dropped from 25% to 12%, while high-end models, relying on brand and technological advantages, increased their share from 18% to 30%. The industry's CR5 (concentration ratio of top 5 enterprises) rose from 52% to 78%, reflecting the "concentration of market share in leading enterprises" [4].
4. Conclusion
This study combs through the data of the new energy vehicle industry and the process of subsidy withdrawal from 2020 to the first half of 2025, and reveals the multi-dimensional impact rules of subsidy withdrawal on enterprise sales. First of all, the impact is phased and highly correlated with the policy rhythm. During the stable subsidy period of 2020-2021, the sales of battery electric vehicles and plug-in hybrid vehicles grew at a high speed, with battery electric vehicles accounting for more than 80% due to long-term benefits; in the accelerated withdrawal period of 2022, the growth rate of battery electric vehicles slowed down and fluctuations intensified, while plug-in hybrid vehicles saw their growth rate jump to 122% relying on flexibility; in the post-subsidy era after 2023, battery electric vehicles returned to stable growth through technological iteration, and plug-in hybrid vehicles achieved an average annual growth rate of 65%, with the sales structure continuously optimized.
Secondly, different power-type vehicles show heterogeneous responses. Battery electric vehicles have the highest correlation with subsidies (Pearson coefficient 0.72). They experienced short-term fluctuations in the early stage of withdrawal, but achieved endogenous growth in the long term through large-scale production and technological upgrading; plug-in hybrid vehicles, due to a smaller withdrawal (20% in 2022) and their combination of low fuel consumption and no range anxiety, saw their sales increase 36 times from 2020 to 2025, far exceeding the 24-fold growth of battery electric vehicles; fuel cell vehicles, due to insufficient support in the passenger vehicle sector, have maintained sales of less than 0.2 million units.
Thirdly, subsidy withdrawal has forced the reshaping of the industry ecology. Enterprises have accelerated strategic adjustments, such as BYD increasing the proportion of plug-in hybrid vehicles to 58%, and Tesla ensuring sales through technological cost reduction; the market has shown the characteristics of "concentration in leading enterprises and high-end upgrading", with CR5 rising from 52% to 78%, the share of low-end models decreasing, and the share of high-end models increasing.
This paper holds that the impact of subsidy withdrawal on the sales of new energy vehicle enterprises is not a simple inhibition, but shows obvious phased characteristics, which are closely related to the rhythm of policy adjustment. During the stable subsidy period from 2020 to 2021, the underpinning effect of policies was obvious, and the sales of both battery electric and plug-in hybrid vehicles grew at a high speed. Among them, battery electric vehicles accounted for more than 80% due to long-term subsidy support. In 2022, entering the accelerated withdrawal period, the subsidy intensity dropped sharply by 30%, the sales growth rate of battery electric vehicles slowed down and fluctuations increased, while plug-in hybrid vehicles, relying on the flexibility of "being usable with both fuel and electricity", saw their growth rate jump to 122% and became a transitional choice in the market. In the post-subsidy era after 2023, the industry shifted to market-driven growth. Battery electric vehicles returned to stable growth through technological iteration and cost optimization, and plug-in hybrid vehicles achieved an average annual growth rate of 65%, with the sales structure continuously optimized.
Authors contribution
All the authors contributed equally and their names were listed in alphabetical order.
References
[1]. Zhang, X. & Bai, X. (2017) Incentive Policies From 2006 to 2016 and New Energy Vehicle Adoption in 2010–2020 in China. Renewable and Sustainable Energy Reviews, 70, 24-43.
[2]. Zhang, X., Wang, K., Hao, Y., Fan, J. L. & Wei, Y. M. (2013) The Impact of Government Policy on Preference for NEVs: The Evidence From China. Energy Policy, 61, 382-393.
[3]. Hao, Y., Peng, B., Zou, H., Zhu, N. & Du, H. (2025) How Does Differentiated Subsidy Adjustment Influence New Energy Vehicle Sales?. Transportation Research Part A: Policy and Practice, 195, 104432.
[4]. Shan, J. (2024) The Impact of Government Subsidies on Electric Vehicle Sales: A Regression Analysis of BYD in China. SHS Web of Conferences, 207, 03017.
[5]. Bi, Y., Liu, J., Liu, Z. & Wei, S. (2024) Impact of New Energy Vehicle Charging Point Subsidy Policy on Subway Demand: Evidence From Beijing’s Real Estate Market. Sustainability, 16(9), 3874.
[6]. Ma, S. C., Xu, J. H. & Fan, Y. (2019) Willingness to Pay and Preferences for Alternative Incentives to EV Purchase Subsidies: An Empirical Study in China. Energy Economics, 81, 197-215.
[7]. Zhou, L. M. & Liu, Z. (2024) Research on the Factors Affecting the Overseas Market Development of China's New Energy Vehicles Analysis Based on ISM-AHP Model. Journal of Chongqing Jiaotong University Social Sciences Edition, 24(1), 36.
[8]. Sun, J., Tian, M., Zhang, W. & Ning, J. (2023) Government Subsidies and Innovation in New Energy Vehicle Companies: An Empirical Study of New Energy Vehicle Listed Companies Based on Shanghai and Shenzhen A-shares. Plos One, 18(4), e0284693.
[9]. Liu, Y., Zhao, X., Lu, D. & Li, X. (2023) Impact of Policy Incentives on the Adoption of Electric Vehicle in China. Transportation Research Part A: Policy and Practice, 176, 103801.
[10]. Li, Y., Liang, C., Ye, F. & Zhao, X. (2023) Designing Government Subsidy Schemes to Promote the Electric Vehicle Industry: A System Dynamics Model Perspective. Transportation Research Part A: Policy and Practice, 167, 103558.
[11]. Wu, Y., Li, X., Zhang, C. & Wang, S. (2024) The Impact of Government Subsidies on Technological Innovation of New Energy Vehicle Enterprises: From the Perspective of Industry Chain. Environment, Development and Sustainability, 26(10), 25589-25607.
[12]. Ye, R. K., Gao, Z. F., Fang, K., Liu, K. L. & Chen, J. W. (2021) Moving From Subsidy Stimulation to Endogenous Development: A System Dynamics Analysis of China's NEVs in the Post-subsidy Era. Technological Forecasting and Social Change, 168, 120757.
[13]. Jiang, Z. & Xu, C. (2023) Policy Incentives, Government Subsidies, and Technological Innovation in New Energy Vehicle Enterprises: Evidence From China. Energy Policy, 177, 113527.
Cite this article
Gu,Y.;Zong,Y. (2025). The Effects of Subsidy Reduction for New Energy Vehicles on Changes in Enterprise Sales. Advances in Economics, Management and Political Sciences,216,221-228.
Data availability
The datasets used and/or analyzed during the current study will be available from the authors upon reasonable request.
Disclaimer/Publisher's Note
The statements, opinions and data contained in all publications are solely those of the individual author(s) and contributor(s) and not of EWA Publishing and/or the editor(s). EWA Publishing and/or the editor(s) disclaim responsibility for any injury to people or property resulting from any ideas, methods, instructions or products referred to in the content.
About volume
Volume title: Proceedings of ICFTBA 2025 Symposium: Financial Framework's Role in Economics and Management of Human-Centered Development
© 2024 by the author(s). Licensee EWA Publishing, Oxford, UK. This article is an open access article distributed under the terms and
conditions of the Creative Commons Attribution (CC BY) license. Authors who
publish this series agree to the following terms:
1. Authors retain copyright and grant the series right of first publication with the work simultaneously licensed under a Creative Commons
Attribution License that allows others to share the work with an acknowledgment of the work's authorship and initial publication in this
series.
2. Authors are able to enter into separate, additional contractual arrangements for the non-exclusive distribution of the series's published
version of the work (e.g., post it to an institutional repository or publish it in a book), with an acknowledgment of its initial
publication in this series.
3. Authors are permitted and encouraged to post their work online (e.g., in institutional repositories or on their website) prior to and
during the submission process, as it can lead to productive exchanges, as well as earlier and greater citation of published work (See
Open access policy for details).
References
[1]. Zhang, X. & Bai, X. (2017) Incentive Policies From 2006 to 2016 and New Energy Vehicle Adoption in 2010–2020 in China. Renewable and Sustainable Energy Reviews, 70, 24-43.
[2]. Zhang, X., Wang, K., Hao, Y., Fan, J. L. & Wei, Y. M. (2013) The Impact of Government Policy on Preference for NEVs: The Evidence From China. Energy Policy, 61, 382-393.
[3]. Hao, Y., Peng, B., Zou, H., Zhu, N. & Du, H. (2025) How Does Differentiated Subsidy Adjustment Influence New Energy Vehicle Sales?. Transportation Research Part A: Policy and Practice, 195, 104432.
[4]. Shan, J. (2024) The Impact of Government Subsidies on Electric Vehicle Sales: A Regression Analysis of BYD in China. SHS Web of Conferences, 207, 03017.
[5]. Bi, Y., Liu, J., Liu, Z. & Wei, S. (2024) Impact of New Energy Vehicle Charging Point Subsidy Policy on Subway Demand: Evidence From Beijing’s Real Estate Market. Sustainability, 16(9), 3874.
[6]. Ma, S. C., Xu, J. H. & Fan, Y. (2019) Willingness to Pay and Preferences for Alternative Incentives to EV Purchase Subsidies: An Empirical Study in China. Energy Economics, 81, 197-215.
[7]. Zhou, L. M. & Liu, Z. (2024) Research on the Factors Affecting the Overseas Market Development of China's New Energy Vehicles Analysis Based on ISM-AHP Model. Journal of Chongqing Jiaotong University Social Sciences Edition, 24(1), 36.
[8]. Sun, J., Tian, M., Zhang, W. & Ning, J. (2023) Government Subsidies and Innovation in New Energy Vehicle Companies: An Empirical Study of New Energy Vehicle Listed Companies Based on Shanghai and Shenzhen A-shares. Plos One, 18(4), e0284693.
[9]. Liu, Y., Zhao, X., Lu, D. & Li, X. (2023) Impact of Policy Incentives on the Adoption of Electric Vehicle in China. Transportation Research Part A: Policy and Practice, 176, 103801.
[10]. Li, Y., Liang, C., Ye, F. & Zhao, X. (2023) Designing Government Subsidy Schemes to Promote the Electric Vehicle Industry: A System Dynamics Model Perspective. Transportation Research Part A: Policy and Practice, 167, 103558.
[11]. Wu, Y., Li, X., Zhang, C. & Wang, S. (2024) The Impact of Government Subsidies on Technological Innovation of New Energy Vehicle Enterprises: From the Perspective of Industry Chain. Environment, Development and Sustainability, 26(10), 25589-25607.
[12]. Ye, R. K., Gao, Z. F., Fang, K., Liu, K. L. & Chen, J. W. (2021) Moving From Subsidy Stimulation to Endogenous Development: A System Dynamics Analysis of China's NEVs in the Post-subsidy Era. Technological Forecasting and Social Change, 168, 120757.
[13]. Jiang, Z. & Xu, C. (2023) Policy Incentives, Government Subsidies, and Technological Innovation in New Energy Vehicle Enterprises: Evidence From China. Energy Policy, 177, 113527.