


1. Introduction
Equity-index-linked structured products, as innovative financial derivatives, have experienced rapid development in global financial markets since the 1990s. These products combine fixed-income securities with financial derivatives (such as options), providing investors with diversified risk-return profile choices. In China, with the advancement of interest rate liberalization and the diversification of investor wealth management needs, structured wealth management products have gradually gained attention.
In recent years, China's interest rate reform has deepened, and financial markets have flourished. Investors' wealth management demands have become increasingly diversified. As major commercial banks face narrowing interest spreads, they have turned to wealth management products, launching various equity-index-linked products. Scholar Sun Guiping's research found that structured product pricing exhibits particularity—the core lies in flexible structural design, typically combining fixed-income and option components [1]. The fixed-income portion ensures principal protection, while the option component provides potential returns linked to underlying asset performance. This structure satisfies both conservative investors' capital preservation needs and aggressive investors' pursuit of excess returns. However, pricing such products proves complex, especially when the underlying asset is a stock index (e.g., CSI 300 Index), where price volatility and path dependency challenge traditional pricing models.
Literature review reveals relatively limited research on CSI 300 Index-linked structured products in China. Li Linling's study found that theoretical research on such products remains weak in China [2]. Ma Ying pointed out that these products are still in their early development stage in China's market [3]. This mismatch between theoretical research and practical development motivates this paper deeper pricing investigation.
In the evolution of structured product pricing research, Kang Chaofeng and Zheng Zhenlong pioneered the discussion of foreign currency structured deposit pricing using the BDT model [4]. As academic research progressed, Ren Min and Chen Jinlong conducted pricing analysis on currency-linked products based on risk-neutral pricing principles [5]. Cui Hairong et al. attempted to introduce Copula functions into multi-asset-linked product pricing but inadequately addressed tail dependence [6]. Recently, with China's financial market development, Monte Carlo simulation has gained prominence for its flexibility. Hong Tiesong detailed Monte Carlo applications in financial derivative pricing and implemented lookback option pricing via Excel VBA [7]. Fang Yan et al. significantly improved multi-asset-linked product pricing accuracy by combining hybrid Copula functions with Monte Carlo simulation [8]. These studies provide crucial methodological support for this research.
This study employs discounted cash flow methods for fixed-income valuation and combines Monte Carlo simulation with GARCH modeling for option pricing analysis. Monte Carlo simulation effectively addresses path dependency, while the GARCH model better captures time-varying volatility characteristics [9,10]. Through structural decomposition and return characteristic analysis of wealth management products, valuation is conducted using Monte Carlo simulation alongside comprehensive evaluation based on return patterns. This approach aims to provide theoretical support for equity-index-linked structured products in China's market, serving as a reference for product design while offering theoretical guidance for investor decision-making.
The significance of this research manifests in two aspects: theoretically, it enriches Chinese literature on equity-index-linked structured product pricing; practically, through detailed pricing process dissection, it attempts to enhance the realization process of pricing theory.
2. Case study of China Merchants Bank's "Focus Link Series"
2.1. Product overview
This research selects China Merchants Bank's "Focus Link Series" wealth management products as the case study, primarily based on the following considerations: First, the underlying asset CSI 300 Index is representative, covering 300 large-cap, liquid stocks from Shanghai and Shenzhen markets. Second, China Merchants Bank leads industry innovation in wealth management products, making its designs exemplary. Therefore, this study analyzes the pricing of the bank's Focus Link (Annual Open) Series equity-index-linked RMB wealth management products issued during the same period in 2020. Product specifications are shown in Table 1.
|
Product Name |
China Merchants Bank Focus Link Series Annual Open No.1 Wealth Management Plan |
|
Underlying Asset |
CSI 300 Index (000300.SH) |
|
Subscription Terms |
Minimum 10,000 units, with additional increments of 1,000 units |
|
Product Tenor |
June 5, 2020 to June 5, 2030 |
|
Fee Structure |
Fixed management fee: 0.20% p.a. Sales service fee: 0.30% p.a. Custodian fee: 0.03% p.a. Performance fee: 20% of excess returns above 5% benchmark |
|
Benchmark Return Conditions |
1. If CSI 300 Index ≤ 120% of initial price during observation period AND terminal price ≥ initial price: Return = 1.0% + 65% × (terminal price - initial price)/initial price2. If CSI 300 Index > 120% of initial price during observation period:Return = 4.2%3. If CSI 300 Index ≤ 120% of initial price during observation period AND terminal price < initial price: Return = 1.0% |
In 2018, the People's Bank of China jointly issued the "Guidelines on Regulating Asset Management Business of Financial Institutions" with CBIRC, CSRC, and SAFE, establishing clear regulatory requirements. According to these guidelines, financial institutions must implement net-value management for asset management products without guaranteeing principal or returns. The "Focus Link" series studied herein represents typical net-value equity-index-linked products with floating returns tied to CSI 300 Index performance, providing no capital or return guarantees.
Actual returns depend not only on the underlying index performance but also on multiple factors including interest rate changes, exchange rate fluctuations, and market liquidity. Following regulatory requirements, China Merchants Bank assigned this product a "Moderate-Low Risk" rating, suitable for conservative investors.
2.2. Return structure analysis
The product's return characteristics can be precisely described by a three-stage piecewise function, essentially combining an up-and-out barrier option with fixed-income notes. The relationship between product returns and the ratio of underlying index terminal price (ST) to initial price (S0) is illustrated in Figure 1:
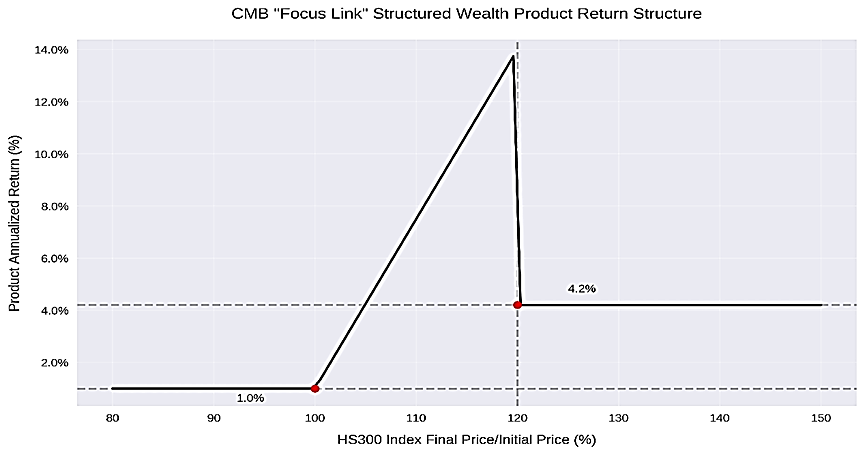
First, when
Second, when the ratio falls within [100%, 120%), the return follows
Third, when the ratio reaches or exceeds 120% barrier level, an automatic knock-out event occurs, locking returns at 4.2%, consistent with path-dependent features of up-and-out options.
The mathematical expression of product returns is:
Where
3. Empirical pricing analysis
3.1. Fixed-income component valuation
The fixed-income portion of equity-index-linked structured products features relatively straightforward pricing mechanics. As these products predominantly allocate funds to fixed-income assets (with a minimum 90% allocation ratio for this product), their valuation follows bond pricing principles through discounted cash flow (DCF) analysis. The fundamental pricing formula is:
Where
For CSI 300 Index-linked principal-protected products, designers prioritize security and yield certainty in the fixed-income portion, typically opting for zero-coupon bonds or equivalent bank term deposits. To ensure pricing precision and computational simplicity, this study adopts continuous compounding:
Given that the future cash flows of the fixed-income portion of the product can be explicitly anticipated, the discount rate r becomes the most critical and sole parameter. In practical applications, the fixed-income portion of structured wealth management products is typically invested in high-credit-grade bonds such as government bonds and policy financial bonds. Therefore, the pricing of such bonds must consider factors including the market yield curve and credit spreads. Particularly for bank wealth management products, the selection of the discount rate often references same-tenor Shibor rates or government bond yields.
As the China Merchants Bank equity-index-linked structured wealth management product "Focus Link Series" has a tenor of 10 years, this study adopts the 10-year government bond yield of 2.85% published by the central bank on the product plan's establishment date (June 5, 2020) as the baseline reference. However, when determining the discount rate r for the fixed-income portion of this 10-year structured product, it is necessary to comprehensively consider credit risk premiums and product characteristics, incorporating two key adjustments: first, credit spread compensation—although bank wealth management products carry lower credit risk than corporate bonds, they exhibit higher risk than government bonds, typically requiring an added spread; second, liquidity premium—the restricted liquidity feature demands additional compensation. Furthermore, product fees (a comprehensive annual fee rate of 0.53%) erode actual returns, necessitating an increased discount rate for internalization. Consequently, the reasonable range for r is 3.5%–4.0%. It is noteworthy that this product employs an annual open mechanism, where the interest rate for each investment cycle must be dynamically adjusted based on the current Shibor rate. However, the long-term discount rate must maintain stability to ensure continuity in the present value calculation of the fixed-income portion. Thus, the midpoint value of 3.75% is adopted as the discount benchmark, balancing precision and operational practicality. Therefore, the value of the fixed-income portion of the product (calculated using the minimum subscription amount of 10,000) can be expressed as:
3.2. Option component pricing
3.2.1. GARCH modeling
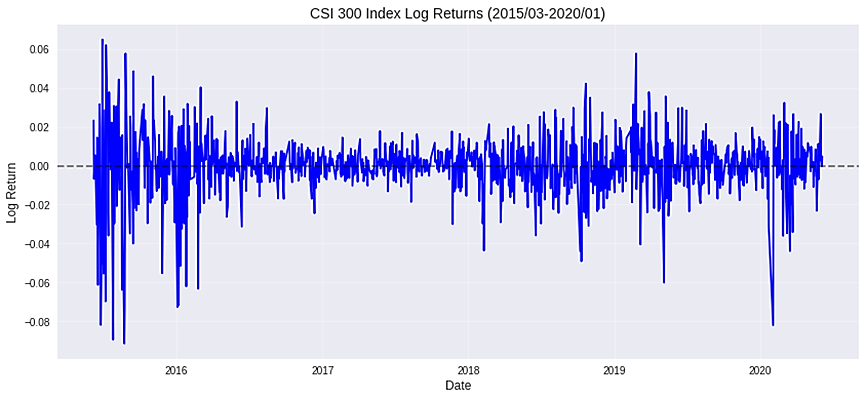
The absence of CSI 300 Index options in China necessitates historical volatility estimation. Daily closing prices (June 5, 2015–June 5, 2020, Wind data) are used.
Figure 2 presents the daily log-return series of the CSI 300 Index, from which it can be observed that the sample index exhibits relatively pronounced temporal heteroskedasticity.
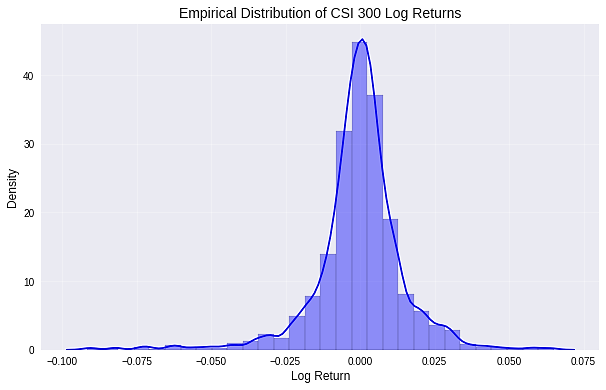
Using Python to simulate and plot the data against a normal distribution yields results shown in Figure 3. According to the Jarque-Bera test results along with skewness and kurtosis metrics, the empirical distribution of the CSI 300 Index log-returns displays significant non-normal characteristics. Specifically, negative skewness and excessive kurtosis indicate that the return distribution has thicker tails and a sharper peak compared to a normal distribution. This finding aligns with the commonly observed leptokurtic and heavy-tailed features in financial time series, confirming the presence of noticeable volatility clustering effects and asymmetric distribution patterns in CSI 300 Index returns. Consequently, more flexible distributional assumptions are required for model correction.
Subsequently, stationarity testing (ADF test) is performed on this log-return series. The test results are displayed in Table 2. The results indicate that the t-statistic of the series is smaller than the 1% critical value, meaning the null hypothesis is rejected significantly. This confirms the absence of a unit root in the series, thereby verifying that the series passes the stationarity test and is stationary.
|
t-Statistic |
Prob |
|
|
ADF test statistic |
-25.6948 |
0.0000 |
|
Test Critical Values: 1% |
-3.4357 |
|
|
5% |
-2.8639 |
|
|
10% |
-2.5680 |
Further autoregressive analysis is conducted based on the log-return series. Through stepwise regression, it is found that only the coefficient of the AR(6) term is statistically significant, while other lagged terms fail to pass significance tests. Therefore, the AR(6) model is ultimately selected as the mean equation. This result indicates the presence of significant weekly (6 trading days) autocorrelation characteristics in CSI 300 Index returns.
Numerous empirical studies have found that CSI 300 Index log-returns typically exhibit higher-order ARCH effects. Thus, this paper applies the ARCH-LM test, conducting ARCH testing for 12 lags [11]. Based on these test results, a GARCH model can be established to characterize volatility clustering features. Considering the widespread application and good fitting performance of the GARCH(1,1) model in financial time series analysis, this paper finally selects the GARCH(1,1) model for estimation. Results are shown in Table 3:
|
Variable |
Coefficient |
Prob |
|
C |
0.0000 |
1.0000 |
|
AR(4) |
0.0000 |
1.0000 |
|
C |
0.0111 |
0.1054 |
|
RESID(-1)^2 |
0.0755 |
0.0121 |
|
GARCH(-1) |
0.9203 |
0.0000 |
Based on the model estimation results, key parameters of the volatility equation are obtained. The model calculates a daily volatility
3.2.2. Monte carlo simulation
For the pricing of European call and put options, the Black-Scholes (B-S) option pricing model demonstrates strong practical utility [12]. However, for structured wealth management products containing embedded exotic options with complex and unpredictable features, the B-S formula proves inadequate. Monte Carlo simulation pricing can address complex structural issues such as path dependency and multi-asset correlation, making it suitable for high-dimensional stochastic processes [13]. This method relies not only on the price path of the underlying asset but also on its terminal price, thereby overcoming the limitations of the B-S option pricing model. Given the practical context of this case study, the Monte Carlo simulation method is selected for pricing research, implemented using Python software.
When calculating option prices via Monte Carlo simulation, the following assumptions apply: risk-neutral conditions, complete markets, and absence of transaction costs and taxes. Additionally, the linked equity index follows geometric Brownian motion:
where
The Monte Carlo simulation method prices the option by simulating the price path of the underlying asset
First: Simulate price paths (price vectors)
Second: Calculate the maturity return
Third: Repeat the above steps N times;
Fourth: After obtaining expected returns under N paths, calculate the expected return of the wealth management product at maturity using formula (7):
Last: Discount the expected return at maturity to obtain the present value of the option portion of the wealth management product.
Since this series of products is linked to the CSI 300 Index, its price index also follows geometric Brownian motion. According to China Merchants Bank’s product announcement, the initial price (i.e., the closing price of the CSI 300 Index on June 5, 2020, the product’s inception date) is 4001.25. There are 252 valid trading days within one year. Assuming each trading day is an observation day, a sequence of independent random numbers following a standard normal distribution can be generated and substituted into the stochastic process formula for stock price movements. Simulating this process 10,000 times yields 10,000 simulated price paths (see Figure 4).
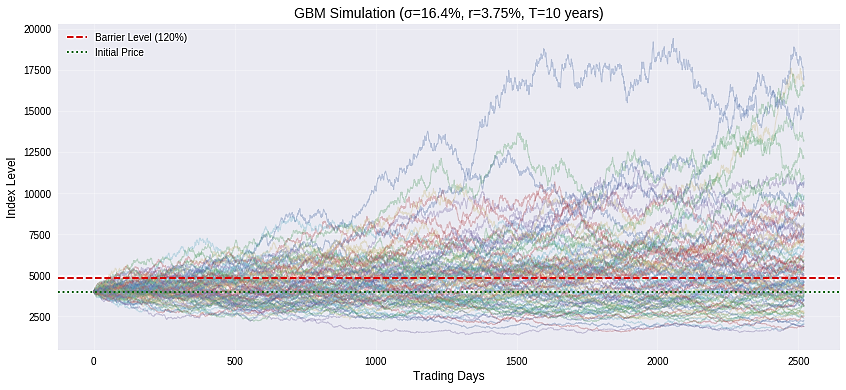
The minimum subscription amount for this product is 10,000 CNY. Thus, this study assumes an initial principal of 10,000 CNY. Based on the product’s return structure, the product can be decomposed into a fixed-income security with a 1% yield and an option component. The option pricing analysis can be divided into a barrier option and a binary option. The barrier option portion manifests as an up-and-out barrier option, triggered when the CSI 300 Index price reaches 120% of the initial level during the observation period. When the underlying asset price path does not breach this barrier level, investors receive 65% participation multiplied by the index excess return. This aligns with the nonlinear payoff characteristics of a standard European call option but exhibits path dependency. The binary option portion provides a fixed return of 4.2% if the CSI 300 Index fixing price touches or exceeds the 120% barrier level during the observation period; otherwise, the option expires worthless. This is equivalent to the option automatically converting into a fixed-income instrument upon barrier triggering. The 4.2% yield significantly exceeds the risk-free rate (2.85%), indicating that the product embeds a risk compensation mechanism. The product’s maturity return function is expressed as:
Using the Monte Carlo simulation method to simulate the price paths of the CSI 300 Index, the daily closing price under each simulated path is calculated. With 10,000 simulated paths, there are 10,000 maturity return values R. Among these 10,000 R values, they consist of three categories: R1corresponding to the barrier option, R2 to the binary option, and R3 to the minimum guaranteed return. The present value of each option is calculated using the following formula:
The calculation results are shown in Table 4.
|
Barrier Option |
Binary Option |
Minimum Return |
Total |
|
6.46 |
238.61 |
10.67 |
255.74 |
3.3. Pricing results
As described earlier, the initial value of the fixed-income portion is 6872.89 CNY, and the initial value of the option portion is 255.74 CNY, resulting in a total theoretical value of 7128.63 CNY. This wealth management product is issued at a premium, with a premium rate of approximately 28.7%. The composition of the product value is detailed in Table 5.
|
Product price |
Theoretical value |
Fixed income securities |
Option Value |
|
10000 |
7128.63 |
6872.89 |
255.74 |
Research results indicate a significant 28.7% issuance premium for this 10-year product, profoundly reflecting the pricing characteristics of long-term structured products in China’s financial market. The premium phenomenon arises from multiple factors: firstly, banks incur various costs during product design and issuance; secondly, the uncertainty associated with the long tenor increases investors’ demand for liquidity premiums; more importantly, the path-dependent barrier options and binary options embedded in the product design entail complex option structures with substantial trading difficulties and corresponding risks, necessitating alternative hedging methods. Additionally, the assumption that the stock index follows geometric Brownian motion, while actual stock returns often exhibit fat-tailed distributions, may lead to undervaluation of barrier knockout options.
3.4. Return analysis
Based on the 10,000 Monte Carlo simulated paths from the pricing analysis and the product’s return structure, the simulated return distribution is shown in Figure 5.
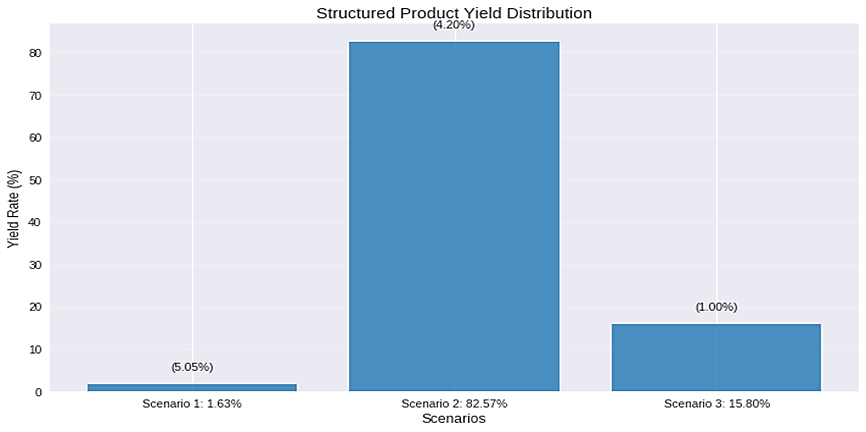
Scenario 1: The barrier level of 120% is not breached during the product’s tenure, and the terminal asset price exceeds the initial price. Among all Monte Carlo simulated paths satisfying this condition, the average increase
From an investor’s perspective, although this structured product offers a potential high return of up to 14% in addition to a fixed 1% return, the stringent terms of the embedded barrier and binary options make the probability of achieving high returns in Scenario 1 significantly lower than in Scenarios 2 and 3. Investors are most likely to receive the fixed 4.2% return. While not ideal, this return still exceeds the risk-free rate of the 10-year government bond. The probability of receiving a 1% return is low; this scenario represents a loss and constitutes an unfavorable investment outcome. Therefore, the return range setting primarily appeals to conservative investors, consistent with the product’s risk rating in the prospectus. Consequently, investors should rationally evaluate the return range when purchasing such products. They should not be misled by the maximum potential return but should pay attention to market movements of the underlying asset and their own risk tolerance.
3.5. Product risk management
In structured wealth management products, Greek letters can quantify the sensitivity of product prices to market risks, assisting investors and issuers in risk management. For path-dependent products, this study uses the finite difference method with central differences and common random numbers to calculate Delta and Gamma:
The Delta value is -0.0071 CNY/index point, indicating that for every 1-point increase in the underlying asset price, the product value decreases by approximately 0.0071 CNY, and vice versa. The negative Delta implies a slight inverse exposure under current market conditions—when the underlying asset rises, the product value declines slightly. This phenomenon may stem from barrier clauses or minimum return guarantees in the product structure, preventing the product price from fully tracking the underlying asset’s upward movement. Investors seeking to reduce the impact of underlying asset price volatility may consider Delta hedging by buying the underlying asset or stock index futures to partially offset the negative Delta risk.
The Gamma value is 0.000574 CNY/index point², suggesting that the rate of change in Delta is relatively slow. Nevertheless, positive Gamma implies positive convexity in the product value relative to underlying price movements. When the underlying asset experiences substantial upward or downward movements, changes in Delta may amplify gains or losses. For example, if the underlying asset price fluctuates violently in the short term, Delta could shift from negative to positive or become more negative, compromising hedging stability. Therefore, for high-Gamma products, investors or market makers must dynamically adjust hedge positions to avoid additional risks caused by Delta jumps.
Combining Delta and Gamma analysis, the structured product’s value is less affected by underlying asset price movements (low absolute Delta). However, substantial market volatility may increase hedging costs due to Gamma effects. Additionally, since the product may contain barrier options or minimum return guarantees, Delta and Gamma may exhibit nonlinear jumps near barrier levels or observation dates. Special attention should be paid to risk management as maturity approaches or during critical price ranges.
4. Conclusion
This study reveals the pricing characteristics and risk management mechanisms of long-term structured products in China's financial market through empirical analysis of China Merchants Bank's "Focus Link" series equity-index-linked structured wealth management products. The research findings indicate a significant 28.7% issuance premium for this 10-year product, profoundly reflecting the market pricing logic under the combined effect of complex option structures and long-term features.
From a risk management perspective, Greek value analysis demonstrates the product's distinctive sensitivity to market fluctuations. The Delta value of -0.0071 CNY/index point indicates a slight inverse exposure, contrasting sharply with traditional option products' risk characteristics. The Gamma value of 0.000574 CNY/index point² warns of potential hedge strategy failures when the underlying asset approaches barrier levels. These findings provide critical implications for market practice: For issuers, there should be optimization of pricing mechanisms for long-term products and establishment of dynamic Greek value monitoring systems, with particular attention to nonlinear risk mutations near barrier levels. For investors, there needs to be rational recognition of structured products' return distribution characteristics and understanding of the complex risk compensation implied behind high premiums, avoiding misguidance by theoretically maximum yields.
Based on research outcomes, this paper proposes three policy recommendations: Firstly, regulatory authorities should strengthen standardized disclosure requirements for structured wealth management products. Secondly, commercial banks should balance complexity and transparency in product innovation, potentially introducing dynamic barrier adjustment mechanisms through periodic barrier resets to reduce path dependency risks in long-term products. Thirdly, investor education should emphasize understanding option structural terms, guiding focus toward the "most probable return" rather than the "theoretical maximum return". This research not only verifies the applicability of Monte Carlo and GARCH models in pricing complex financial products but also provides empirical evidence for the standardized development of China's structured wealth management product market. Future research could further explore barrier option pricing efficiency across different market cycles and risk contagion mechanisms in multi-asset-linked products.
References
[1]. Sun, G. P. (2015). Pricing and risk analysis of structured products: A case study of principal-protected equity-index-linked products. Journal of Technical Economics & Management Research, (10), 67-72.
[2]. Li, L. L. (2010). Research on equity-linked structured products in China, Southwestern University of Finance and Economics.
[3]. Ma, Y. (2012). Pricing analysis of equity-linked structured wealth management products: Based on Monte Carlo simulation. Market Economy and Price, (3), 54-56+64.
[4]. Kang, C. F., & Zheng, Z. L. (2005). Pricing of foreign currency structured deposits. Studies of International Finance, (5), 45-49.
[5]. Ren, M., & Chen, J. L. (2008). Pricing research on principal-protected equity-linked structured foreign exchange products. Studies of International Finance, (12), 64-70.
[6]. Cui, H. R., He, J. M., & Hu, X. P. (2010). Optimal design and pricing of structured financial products. Chinese Journal of Management Science, (4), 8-13.
[7]. Hong, T. S. (2015). Application of Monte Carlo methods in financial derivatives pricing. Finance & Economy (Second Half).
[8]. Fang, Y., Zhang, Y. X., Liu, J. Z., & Zhang, J. (2018). Pricing research on multi-asset-linked structured wealth management products. Journal of Fudan University (Natural Science), 57(5), 554-564.
[9]. Bollerslev, T. (1986). Generalized autoregressive conditional heteroskedasticity. Journal of Econometrics, 31(3), 307-327.
[10]. Wang, Y., Zhao, D., Zhang, J. Z., & Fu, Y. (2020). Pricing analysis of Ping An Bank's structured wealth management products. Journal of Shanghai Normal University (Natural Sciences), 49(5), 533-540.
[11]. Wu, T. (2024). Market risk forecasting of CSI 300 Index: Based on GARCH model. Productivity Research, (6), 128-132.
[12]. Black, F., & Scholes, M. (1973). The pricing of options and corporate liabilities. Journal of Political Economy, 81(3), 637-654.
[13]. Matsakos, T., & Nield, S. (2024). Quantum Monte Carlo simulations for financial risk analytics: scenario generation for equity, rate, and credit risk factors. Quantum, 8, 1306.
Cite this article
Guan,Z. (2025). Pricing Research on China Merchants Bank's "Focus Link Series" Equity-Index-Linked Structured Wealth Management Product. Advances in Economics, Management and Political Sciences,220,27-38.
Data availability
The datasets used and/or analyzed during the current study will be available from the authors upon reasonable request.
Disclaimer/Publisher's Note
The statements, opinions and data contained in all publications are solely those of the individual author(s) and contributor(s) and not of EWA Publishing and/or the editor(s). EWA Publishing and/or the editor(s) disclaim responsibility for any injury to people or property resulting from any ideas, methods, instructions or products referred to in the content.
About volume
Volume title: Proceedings of ICFTBA 2025 Symposium: Data-Driven Decision Making in Business and Economics
© 2024 by the author(s). Licensee EWA Publishing, Oxford, UK. This article is an open access article distributed under the terms and
conditions of the Creative Commons Attribution (CC BY) license. Authors who
publish this series agree to the following terms:
1. Authors retain copyright and grant the series right of first publication with the work simultaneously licensed under a Creative Commons
Attribution License that allows others to share the work with an acknowledgment of the work's authorship and initial publication in this
series.
2. Authors are able to enter into separate, additional contractual arrangements for the non-exclusive distribution of the series's published
version of the work (e.g., post it to an institutional repository or publish it in a book), with an acknowledgment of its initial
publication in this series.
3. Authors are permitted and encouraged to post their work online (e.g., in institutional repositories or on their website) prior to and
during the submission process, as it can lead to productive exchanges, as well as earlier and greater citation of published work (See
Open access policy for details).
References
[1]. Sun, G. P. (2015). Pricing and risk analysis of structured products: A case study of principal-protected equity-index-linked products. Journal of Technical Economics & Management Research, (10), 67-72.
[2]. Li, L. L. (2010). Research on equity-linked structured products in China, Southwestern University of Finance and Economics.
[3]. Ma, Y. (2012). Pricing analysis of equity-linked structured wealth management products: Based on Monte Carlo simulation. Market Economy and Price, (3), 54-56+64.
[4]. Kang, C. F., & Zheng, Z. L. (2005). Pricing of foreign currency structured deposits. Studies of International Finance, (5), 45-49.
[5]. Ren, M., & Chen, J. L. (2008). Pricing research on principal-protected equity-linked structured foreign exchange products. Studies of International Finance, (12), 64-70.
[6]. Cui, H. R., He, J. M., & Hu, X. P. (2010). Optimal design and pricing of structured financial products. Chinese Journal of Management Science, (4), 8-13.
[7]. Hong, T. S. (2015). Application of Monte Carlo methods in financial derivatives pricing. Finance & Economy (Second Half).
[8]. Fang, Y., Zhang, Y. X., Liu, J. Z., & Zhang, J. (2018). Pricing research on multi-asset-linked structured wealth management products. Journal of Fudan University (Natural Science), 57(5), 554-564.
[9]. Bollerslev, T. (1986). Generalized autoregressive conditional heteroskedasticity. Journal of Econometrics, 31(3), 307-327.
[10]. Wang, Y., Zhao, D., Zhang, J. Z., & Fu, Y. (2020). Pricing analysis of Ping An Bank's structured wealth management products. Journal of Shanghai Normal University (Natural Sciences), 49(5), 533-540.
[11]. Wu, T. (2024). Market risk forecasting of CSI 300 Index: Based on GARCH model. Productivity Research, (6), 128-132.
[12]. Black, F., & Scholes, M. (1973). The pricing of options and corporate liabilities. Journal of Political Economy, 81(3), 637-654.
[13]. Matsakos, T., & Nield, S. (2024). Quantum Monte Carlo simulations for financial risk analytics: scenario generation for equity, rate, and credit risk factors. Quantum, 8, 1306.