


1. Introduction
The NBA Draft Combine is a crucial event for evaluating the physical and technical capabilities of prospective players. Nonetheless, the ability to combine outcomes to accurately predict future professional success continues to be widely debated among scouts, coaches, and researchers.
Thriving in the modern NBA demands a combination of elite physical traits such as explosiveness, agility, and endurance. These attributes are quantitatively assessed at the combine through standardized tests measuring speed, vertical leap, and strength. In recent years, the combine has broadened its scope to include more position-specific skill assessments, reflecting the league's evolution toward a faster, more versatile style of play and aiming to build comprehensive player profiles that transcend raw athletic testing.
Analysts and researchers remain divided on the predictive value of the combination. A longitudinal study conducted by sports psychologists Moxley and Towne analyzed over 300 NBA Combine invitees from 2001-2006 and revealed only weak correlations between combine metrics—such as vertical jump, agility, and other physical tests—and subsequent player success in the first three years of NBA performance. Their findings emphasized that while athleticism predicted draft order, it did not reliably forecast on-court success, with factors like college performance and youth proving far stronger indicators [1]. In contrast, a study by Teramoto et al. found that the combination’s standardized testing—particularly anthropometric measures like wingspan and standing reach—offers vital benchmarks for comparing players from different leagues and backgrounds, a methodology supported by regression analysis of draft outcomes and performance metrics like Win Shares and Value Over Replacement Player over players' early careers [2].
To contribute fresh insights amid the league's ongoing stylistic shifts, this study leverages data from the 2022 to 2024 seasons and addresses the following research questions:
(1) What is the degree of correlation between NBA Draft Combine metrics and rookie season performance indicators, including points per game (PPG), rebounds per game (RPG), assists per game (APG), field goal percentage, three-point field goal percentage, and free throw percentage?
(2) To what extent can regression models based on NBA Draft Combine metrics reliably forecast professional performance indicators?
Based on these observations, we hypothesize that the NBA Draft Combine has limited forecasting value regarding players' professional trajectories. While the combine effectively assesses athletic potential, we contend it fails to capture the complete range of skills and attributes required for NBA success. This hypothesis challenges conventional overreliance on combines results in draft decisions and suggests the need for more comprehensive evaluation systems.
2. Literature review
Existing research on the predictive validity of the NBA Draft Combine for rookie performance reveals mixed but generally limited findings, often highlighting weak correlations between physical metrics and on-court success. Teramoto et al. analyzed combined data from 2000–2015 and found weak associations between metrics like vertical leap and agility with future NBA stats, such as player efficiency rating (PER), though some validity existed for predicting draft position [2]. Gomes et al. reported that anthropometric and physical traits showed only weak correlations with game-related statistics during the regular season, with these associations weakening further in the playoffs [3]. Agility emerged as a key fitness characteristic linked to technical performance indicators like shooting and steals.
A 2021 study in the Journal of Human Sport and Exercise concluded that the NBA Pre-Draft Combine is a poor indicator of rookie performance, with physical assessments showing low to moderate correlations that explained only 24.7% of variance in on-court metrics after controlling for other factors [4]. Hartman developed predictive models using Combine metrics to forecast rookies' first-year performance index (normalized for minutes played), finding statistical significance in regression and decision tree models [5]. Key predictors included position, maximum vertical leap, standing vertical leap, and wingspan interactions, suggesting that Combine data could enhance draft decisions when integrated with scouting, though model performance indicated room for refinement.
More recent analyses reinforce these limitations while identifying niche predictive value. Wang conducted a statistical analysis of rookies from 2000 onwards, using average yearly RAPTOR Wins Above Replacement (WAR) as an impact measure [6].
Regression results showed strong positive associations for vertical jump, lane agility (faster times), and sprint speed with overall player impact, though bench press and weight ratio were ineffective predictors. For top performers (top 30% by WAR), wingspan ratio emerged as a stronger indicator. Additionally, a machine learning-based study (Formula Bot, undated but recent) found no significant correlations between Combine metrics and overall or offensive performance (e.g., LEBRON or O-LEBRON metrics), but metrics explained about 8% of variance in defensive performance (D-LEBRON). Weight ratio showed the largest positive effect size (0.18), while surprisingly, slower lane agility and sprint times correlated with higher defensive impact; positional trends suggested quicker sprints benefited point guards' offense, and longer wingspans aided defense for forwards and centers.
Zhang et al. used cluster and discriminant analysis on 699 NBA games to identify five player profiles based on height, weight, and experience, revealing that top height-weight profiles with low experience were linked to defensive stats like rebounds and blocks, while low height-weight profiles with low experience showed minimal involvement (e.g., fewer passes) [3]. Stronger teams featured players of middle height-weight with middle experience profiles, offering insights into how physical attributes—potentially measured at the Combine—influence rookie roles and team success.
These studies collectively underscore the Combine's modest role in predicting rookie outcomes, often explaining less than 25% of performance variance, and highlight the need for updated analyses on recent seasons (e.g., 2022–2024) to account for evolving game styles and player development.
3. Methodology and variables
This quantitative study employs descriptive statistics, correlation analysis, and multiple linear regression to assess the connection between NBA Draft Combine metrics and professional performance. Analyses were conducted using R programming for visuals (box plots), Pearson correlations, and linear regressions.
The dataset comprises 88 NBA rookies from the 2022–2024 drafts, with combine metrics and career statistics up to the 2024–25 season. Data were sourced from NBA.com (for combine results) and Basketball-Reference.com (for performance stats). Players span positions: Point Guard (PG), Shooting Guard (SG), Small Forward (SF), Power Forward (PF), and Center (C). Missing values (e.g., empty cells) are handled by listwise deletion in analyses. Sample size allows for robust stats, focusing on recent eras with analytics emphasis. Table 1 provides the definition for each variable.
|
Variable |
Full Term |
Definition |
Unit |
|
Weight-to-Height |
Weight-to-Height Ratio |
Player weight divided by height, indicating body density. |
% |
|
Wingspan-to-Height |
Wingspan-to-Height Ratio |
Wingspan divided by height, measuring reach advantage. |
% |
|
Lane Agility |
Lane Agility Time |
Time to complete the agility drill (change of direction). |
Seconds (s) |
|
Shuttle Run |
Shuttle Run Time |
Time for a short-distance shuttle sprint. |
Seconds (s) |
|
Sprint |
Three-Quarter Court Sprint |
Time to sprint 3/4 court length. |
Seconds (s) |
|
Standing Vert |
Standing Vertical Leap |
Jump height from standstill. |
Inches (in) |
|
Max Vert |
Maximum Vertical Leap |
Highest jump with run-up. |
Inches (in) |
|
Off Dribble Ratio |
Off-the-Dribble Shooting Ratio |
Shooting accuracy on shots off the dribble. |
% |
|
Spot Up Ratio |
Spot-Up Shooting Ratio |
Shooting accuracy on catch-and-shoot. |
% |
|
3PT Star Ratio |
3-Point Star Shooting Ratio |
3PT accuracy from various angles. |
% |
|
3PT Side Ratio |
3-Point Side Shooting Ratio |
3PT accuracy from sides. |
% |
|
FT Ratio |
Free Throw Ratio |
Free-throw shooting accuracy. |
% |
|
PPG |
Points Per Game |
Average points scored per game. |
Points |
|
RPG |
Rebounds Per Game |
Average rebounds per game. |
Times |
|
APG |
Assists Per Game |
Average assists per game. |
Times |
|
FG% |
Field Goal Percentage |
Shooting accuracy from the field. |
% |
|
3P% |
3-Point Field Goal Percentage |
Shooting accuracy from beyond the arc. |
% |
|
FT% |
Free Throw Percentage |
Shooting accuracy from the free-throw line. |
% |
|
Count |
Mean |
Std |
Min |
25% |
50% |
75% |
Max |
|
|
Weight/Height Ratio |
90 |
1.07 |
0.09 |
0.86 |
1.01 |
1.06 |
1.1 |
1.34 |
|
Wingspan/Height Ratio |
90 |
1.06 |
0.04 |
0.97 |
1.03 |
1.05 |
1.08 |
1.18 |
|
Lane Agility |
51 |
11.09 |
0.44 |
10.56 |
10.81 |
11 |
11.39 |
12.25 |
|
Shuttle Run |
41 |
3.03 |
0.16 |
2.79 |
2.91 |
3.01 |
3.13 |
3.46 |
|
Sprint |
52 |
3.23 |
0.13 |
2.87 |
3.13 |
3.22 |
3.32 |
3.5 |
|
Standing Vert |
51 |
29.72 |
3 |
23.5 |
27.5 |
29.5 |
32 |
35 |
|
Max Vert |
51 |
35.96 |
3.52 |
26.5 |
33.5 |
36 |
38.5 |
42 |
|
Off Dribble Ratio |
40 |
0.61 |
0.13 |
0.37 |
0.53 |
0.6 |
0.7 |
0.83 |
|
Spot Up Ratio |
40 |
0.58 |
0.14 |
0.32 |
0.48 |
0.6 |
0.68 |
0.88 |
|
3PT Star Ratio |
40 |
0.56 |
0.13 |
0.36 |
0.48 |
0.56 |
0.64 |
0.8 |
|
3PT Side Ratio |
40 |
0.56 |
0.11 |
0.32 |
0.49 |
0.56 |
0.63 |
0.77 |
|
FT Ratio |
40 |
0.83 |
0.15 |
0.4 |
0.7 |
0.9 |
0.9 |
1 |
|
PPG |
88 |
9.04 |
5.41 |
1.7 |
4.73 |
8.7 |
12.03 |
25.9 |
|
RPG |
88 |
4.02 |
2.83 |
0.8 |
2.1 |
3.3 |
5.1 |
12.2 |
|
APG |
88 |
2.08 |
1.47 |
0.1 |
1 |
1.6 |
2.63 |
6.3 |
|
FG% |
88 |
0.44 |
0.08 |
0.22 |
0.4 |
0.44 |
0.47 |
0.7 |
|
3P% |
86 |
0.38 |
0.17 |
0 |
0.31 |
0.34 |
0.38 |
0.82 |
|
FT% |
88 |
9.04 |
21.27 |
0.49 |
0.69 |
0.78 |
0.86 |
0.78 |
The descriptive statistics in Table 2 provide insights into NBA Draft Combine metrics and rookie performance indicators for prospects from the 2022–2024 seasons, based on sample sizes ranging from 40 to 90 observations.
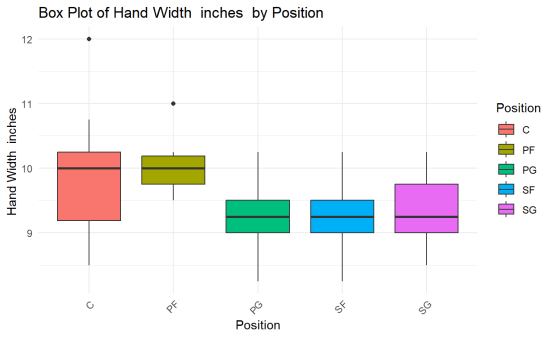
The weight-to-height ratio averages 1.07 (SD = 0.09, range: 0.86–1.34), reflecting balanced builds, while the wingspan-to-height ratio (M = 1.06, SD = 0.04) suggests modestly elongated arms (median = 1.05), a trait often advantageous for defensive reach. Athletic performance tests indicate competitive benchmarks: lane agility time (M = 11.09 s, SD = 0.44) and shuttle run (M = 3.03 s, SD = 0.16) highlight quick directional changes, with the three-quarter sprint (M = 3.23 s, SD = 0.13) underscoring speed. Vertical metrics are robust, with standing vertical and maximum vertical demonstrating explosive power.
Rookie performance metrics show substantial dispersion: PPG (M = 9.04, SD = 5.41, max = 25.9) and RPG (M = 4.02, SD = 2.83) reflect scoring and rebounding variability, while APG (M = 2.08, SD = 1.47) suggests limited playmaking among entrants. Shooting efficiencies include FG% (M = 0.44, SD = 0.08), 3P% (M = 0.38, SD = 0.17), and FT% (M = 9.04, SD = 21.27)—the latter appears anomalous, potentially a scaling error (e.g., intended as 90.4%), warranting verification.
Overall, the data underscore heterogeneity in rookie outcomes, with combine metrics displaying narrower distributions than performance indicators.
4. Empirical analysis
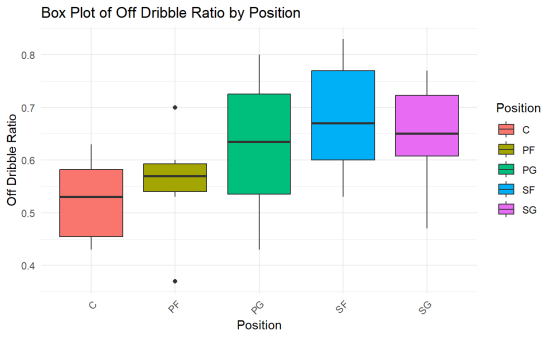
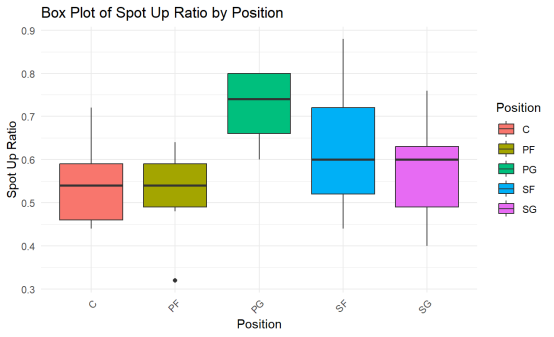
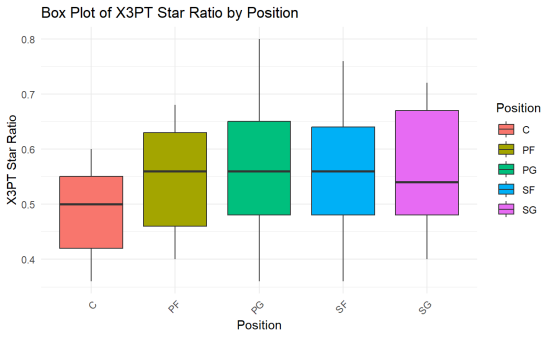
4.1. Box plots of NBA Draft Combine by position
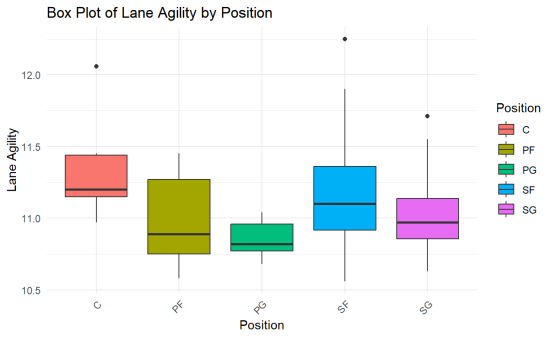
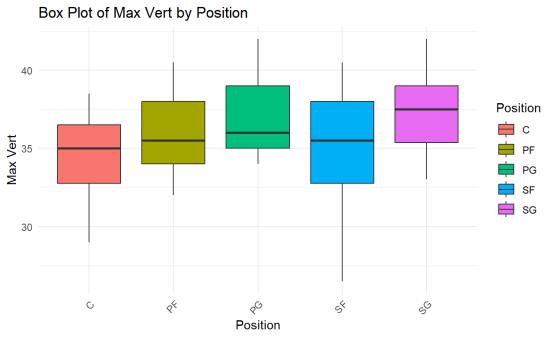
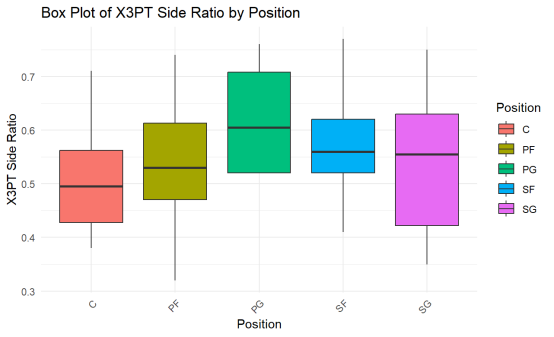
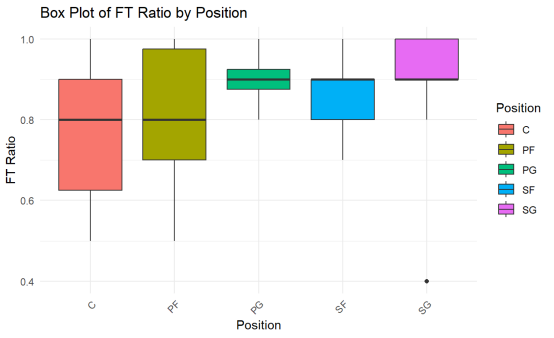
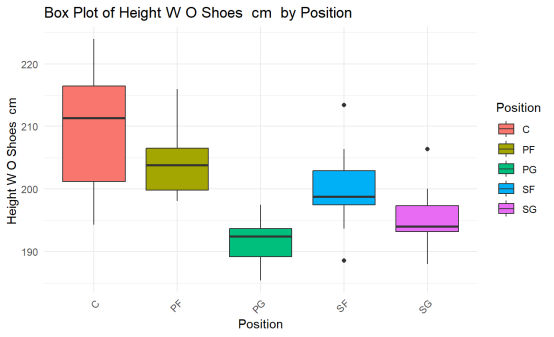
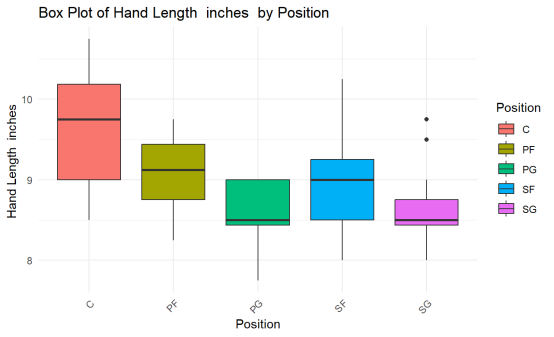
The box plots from the NBA Draft Combine reveal clear positional differences in physical attributes among rookies, highlighting how roles shape athletic profiles for point guards (PG), shooting guards (SG), small forwards (SF), power forwards (PF), and centers (C).
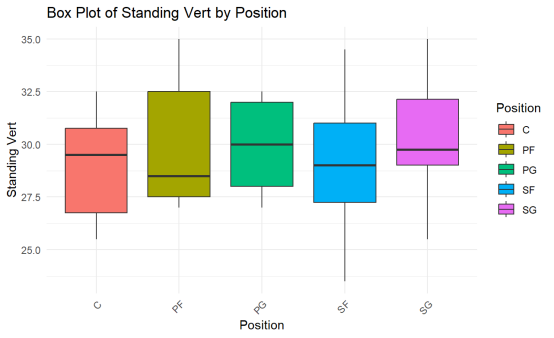
In vertical leap metrics, guards (PG and SG) show higher median standing verticals than forwards and centers, underscoring the emphasis on explosiveness for perimeter play, like quick drives and defensive leaps. Yet, maximum vertical leaps remain consistent across positions, with medians hovering between 35 and 37 inches, indicating this trait is less role-specific.
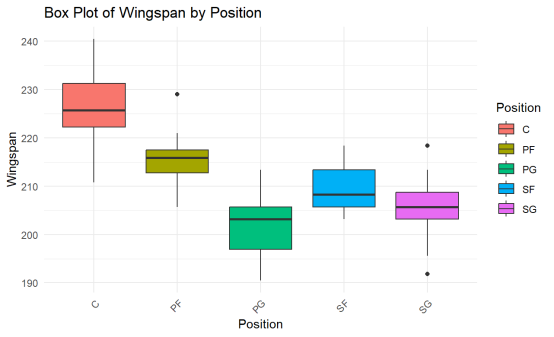
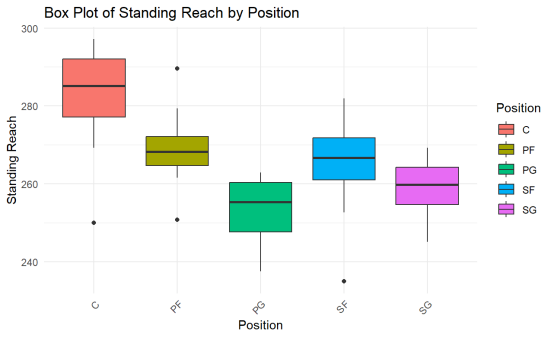
This data further underscores size-based hierarchies: centers boast the highest median standing reach—a notable outlier compared to the similar medians among other positions—crucial for rim protection and rebounding. Height medians descend as C > SF > PF > PG > SG, favoring taller builds for interior dominance over backcourt agility.
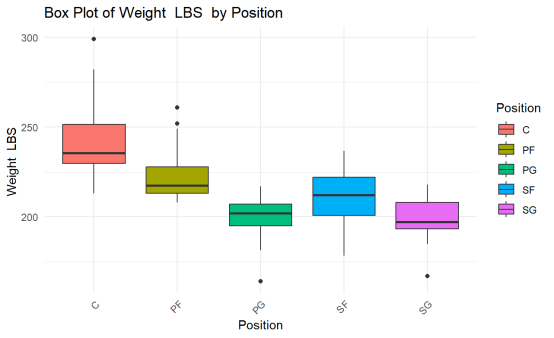
Wingspans follow suit (C > SF > PG > PF > SG), amplifying reach benefits for larger players, while weights vary with centers heaviest, then SF > PG > SG > PF, balancing mass for post work against leanness for mobility.
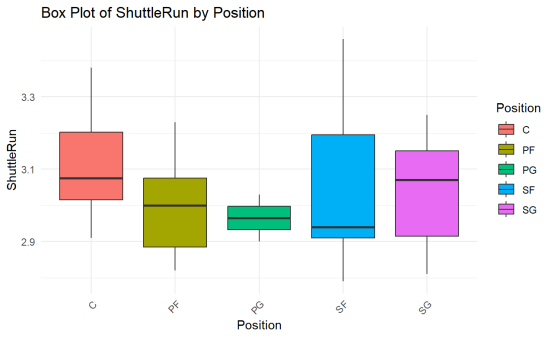
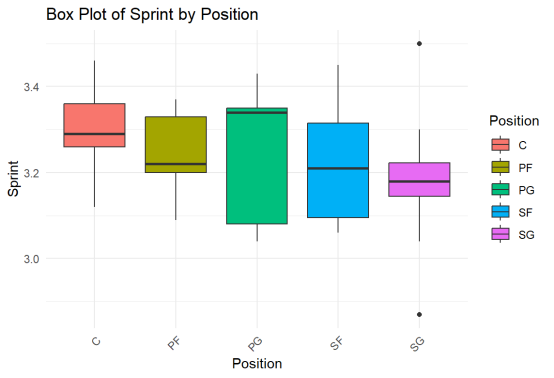
Agility and speed tests expose size-related trade-offs. Centers log the longest median lane agility times, trailed by PG and PF, with SF quickest, likely due to bigger bodies hindering rapid changes in direction. Shuttle runs order as PF > C > SF > SG > PG (with outliers from individual variations), signaling slower bursts for forwards and centers. Sprints show SG slowest and PF fastest, perhaps tied to positional needs for endurance versus speed.
In essence, these patterns capture classic archetypes—guards favoring quickness and jumps, centers prioritizing size and reach—but uniformities (like max verticals) and outliers highlight the combine's limited depth for predicting NBA success. Blending this data with game footage and analytics would offer a fuller view, as pure physical metrics tell only part of the story.
4.2. Correlation table
|
PPG |
RPG |
APG |
FG |
3P |
FT |
|
|
Weight/Height Ratio |
-0.06 |
0.38 |
-0.13 |
0.51 |
-0.09 |
-0.19 |
|
Wingspan/Height Ratio |
0.12 |
0.36 |
0.09 |
0.45 |
-0.13 |
-0.12 |
|
Lane Agility |
-0.17 |
0.12 |
-0.22 |
-0.01 |
-0.06 |
-0.34 |
|
Shuttle Run |
0.02 |
0.06 |
-0.12 |
0.32 |
0.14 |
-0.04 |
|
Sprint |
0.03 |
0.21 |
-0.11 |
0.21 |
0.19 |
-0.06 |
|
Standing Vert |
0.09 |
0.08 |
0.11 |
-0.12 |
-0.19 |
0.01 |
|
Max Vert |
0.15 |
-0.06 |
0.12 |
-0.13 |
-0.18 |
0.21 |
|
Off Dribble Ratio |
-0.15 |
-0.41 |
-0.14 |
-0.26 |
0.3 |
0.31 |
|
Spot Up Ratio |
-0.11 |
-0.33 |
0.04 |
-0.16 |
0.19 |
0.27 |
|
3PT Star Ratio |
0 |
-0.28 |
0.01 |
-0.11 |
0.24 |
0.25 |
|
3PT Side Ratio |
-0.03 |
-0.2 |
0.15 |
-0.16 |
0.07 |
0.23 |
|
FT Ratio |
-0.09 |
-0.33 |
0.02 |
-0.32 |
-0.08 |
0.2 |
Table 3 correlation table shows how NBA Draft Combine metrics relate to rookie performance stats like points per game (PPG), rebounds per game (RPG), assists per game (APG), and shooting percentages (FG%, 3P%, FT%). Most links are weak, meaning combined tests don't strongly predict how players do in games.
For example, bigger body ratios (like weight-to-height) tie moderately to better rebounding (0.436 for RPG) and field goal accuracy (0.585 for FG%), which makes sense for taller, stronger players grabbing boards or scoring inside. But vertical jumps (standing and max vert) have negative ties to rebounding (-0.503 and -0.520), suggesting high leapers might not always dominate the paint—maybe they're quicker guards instead.
Speed and agility drills, like sprints, show small negative links to scoring and assists (-0.248 for PPG, -0.241 for APG), hinting that super-fast combine times don't guarantee NBA points or passes. Shooting ratios from the combine barely connect to actual 3P% or FT%, with numbers close to zero, like 0.122 for max vert and 3P%.
Overall, these low correlations back up the idea that combining metrics spot raw talent but miss bigger factors like teamwork or smarts, explaining why they're not great at forecasting pro success.
4.3. Linear regression
Multiple linear regressions were conducted to predict each dependent variable (PPG, RPG, APG, FG%, 3P%, FT%) from the combined metrics as independent variables.
where Y is the dependent variable, β0 is the intercept, β1 to β7 are the coefficients, and E is the error term. Dependent factors for each six regressions are: PPG, RPG,
APG, FG%, 3P%, FT%.
The table below summarizes the results for all six models. Models were fit using OLS with listwise deletion of missing data.
|
PPG |
RPG |
APG |
FG% |
3P% |
FT% |
|
|
Intercept |
-16.48 |
-26.91 |
16.27 |
-0.09 |
0.67 |
2.32** |
|
Weight/Height Ratio |
-7.88 |
6.71* |
-1.63 |
0.24** |
-0.13 |
-0.32 |
|
Wingspan/Height Ratio |
2.99 |
-1.41 |
0.21 |
0.00 |
-0.06 |
-0.76 |
|
Lane Agility |
-2.47 |
0.65 |
-0.82 |
-0.02 |
-0.05 |
-0.11** |
|
Shuttle Run |
1.27 |
-2.4 |
0.22 |
0.07 |
0.09 |
0.12 |
|
Sprint |
13.23 |
5.19 |
-0.95 |
0.08 |
0.12 |
0.14 |
|
Standing Vert |
-0.06 |
0.38 |
0.11 |
0.01 |
-0.00 |
-0.01 |
|
Max Vert |
0.35 |
-0.09 |
-0.13 |
-0.00 |
-0.00 |
0.01 |
|
Adjusted R Square |
-0.07 |
0.09 |
-0.11 |
0.12 |
-0.06 |
0.22 |
|
Significance F |
0.73 |
0.17 |
0.88 |
0.11 |
0.7 |
0.02 |
Note. ***p<0.01, **p<0.05, *p<0.1
The regression outcome in Table 4 demonstrates the limited predictive utility of NBADraft Combine metrics for rookie performance, with adjusted R-squared values mostly low or negative (ranging from -0.11 to 0.22), indicating poor model fits. Only the FT% model shows overall significance (F=0.02). Weight/Height Ratio emerges as a key predictor, positively influencing RPG (β=6.71*) and FG% (β=0.24**), but negatively affecting PPG (β=-7.88) and FT% (β=-0.32*). Lane Agility negatively impacts FT% (β=-0.11**). These weak associations affirm our hypothesis, highlighting that physical metrics overlook critical intangibles like basketball IQ and decision-making.
5. Conclusion
This study reveals the constrained predictive power of NBA Draft Combine metrics for forecasting rookie performance in the 2025 season, as evidenced by weak correlations and largely non-significant regression results. Athletic metrics, such as vertical leaps, exhibit positional trends (e.g., higher leaps among forwards and centers), but they fail to comprehensively capture the multifaceted attributes—such as decision-making, basketball IQ, and in-game adaptability—that drive on-court success. These findings align with our hypothesis and corroborate prior research, including Teramoto et al. and Gomes et al., which similarly highlight the limited utility of combined metrics in predicting regular-season performance [2,3].
The implications are significant for NBA teams, suggesting a shift away from over-reliying on combine data during draft evaluations. Instead, teams should prioritize comprehensive assessments, including game film analysis, cognitive evaluations, and advanced statistical models, to better gauge a player’s potential. Future research could enhance predictive accuracy by expanding sample sizes, incorporating longitudinal performance data, or leveraging machine learning to uncover nuanced patterns in player success. By integrating these approaches, teams can make more informed draft decisions, optimizing talent selection in an increasingly competitive league.
References
[1]. Moxley, J. H., & Towne, T. J. (2015). Predicting success in the National Basketball Association: Stability & potential. Psychology of Sport and Exercise, 16, 128–136. https: //doi.org/10.1016/j.psychsport.2014.07.003
[2]. Teramoto, M., Cross, C. L., Rieger, R. H., Maak, T. G., & Willick, S. E. (2018). Predictive validity of National Basketball Association draft combine on future performance. Journal of Strength and Conditioning Research, 32(2), 396–408. https: //doi.org/10.1519/JSC.0000000000001798
[3]. Zhang, S., Lorenzo, A., Gómez, M. A., Mateus, N., Gonçalves, B., & Sampaio, J.(2018). Clustering performances in the NBA according to players’ anthropometric attributes and playing experience. Journal of Sports Sciences, 36(22), 2511-2520.https: //doi.org/10.1080/02640414.2018.1466493
[4]. Ranisavljev, I., Mandic, R., Cosic, M., Blagojevic, P., & Dopsaj, M. (2020). NBA Pre-Draft Combine is the weak predictor of rookie basketball player’s performance. Journal of Human Sport and Exercise, 16(3). https: //doi.org/10.14198/jhse.2021.163.02
[5]. Hartman, I. (2019). NBA draft analytics: Boom or bust? In Proceedings of the SAS Global Forum 2019 Conference (Paper 3947). SAS Institute. https: //support.sas.com/resources/papers/proceedings19/3947-2019.pdf
[6]. Wang, W. (2021). The predictive power of the NBA Draft Combine: A statistical analysis. Medium. https: //wilson-wang.medium.com/the-predictive-power-of-the-nba-draft-combine-a-statistical-analysis-b45d15931fe5
Cite this article
Li,H.;Cao,Q. (2025). Evaluating the Predictive Power of NBA Draft Combine Metrics on Early-Career Performance: An Empirical Analysis from the 2022–2024 Seasons. Advances in Economics, Management and Political Sciences,226,84-99.
Data availability
The datasets used and/or analyzed during the current study will be available from the authors upon reasonable request.
Disclaimer/Publisher's Note
The statements, opinions and data contained in all publications are solely those of the individual author(s) and contributor(s) and not of EWA Publishing and/or the editor(s). EWA Publishing and/or the editor(s) disclaim responsibility for any injury to people or property resulting from any ideas, methods, instructions or products referred to in the content.
About volume
Volume title: Proceedings of ICEMGD 2025 Symposium: Innovating in Management and Economic Development
© 2024 by the author(s). Licensee EWA Publishing, Oxford, UK. This article is an open access article distributed under the terms and
conditions of the Creative Commons Attribution (CC BY) license. Authors who
publish this series agree to the following terms:
1. Authors retain copyright and grant the series right of first publication with the work simultaneously licensed under a Creative Commons
Attribution License that allows others to share the work with an acknowledgment of the work's authorship and initial publication in this
series.
2. Authors are able to enter into separate, additional contractual arrangements for the non-exclusive distribution of the series's published
version of the work (e.g., post it to an institutional repository or publish it in a book), with an acknowledgment of its initial
publication in this series.
3. Authors are permitted and encouraged to post their work online (e.g., in institutional repositories or on their website) prior to and
during the submission process, as it can lead to productive exchanges, as well as earlier and greater citation of published work (See
Open access policy for details).
References
[1]. Moxley, J. H., & Towne, T. J. (2015). Predicting success in the National Basketball Association: Stability & potential. Psychology of Sport and Exercise, 16, 128–136. https: //doi.org/10.1016/j.psychsport.2014.07.003
[2]. Teramoto, M., Cross, C. L., Rieger, R. H., Maak, T. G., & Willick, S. E. (2018). Predictive validity of National Basketball Association draft combine on future performance. Journal of Strength and Conditioning Research, 32(2), 396–408. https: //doi.org/10.1519/JSC.0000000000001798
[3]. Zhang, S., Lorenzo, A., Gómez, M. A., Mateus, N., Gonçalves, B., & Sampaio, J.(2018). Clustering performances in the NBA according to players’ anthropometric attributes and playing experience. Journal of Sports Sciences, 36(22), 2511-2520.https: //doi.org/10.1080/02640414.2018.1466493
[4]. Ranisavljev, I., Mandic, R., Cosic, M., Blagojevic, P., & Dopsaj, M. (2020). NBA Pre-Draft Combine is the weak predictor of rookie basketball player’s performance. Journal of Human Sport and Exercise, 16(3). https: //doi.org/10.14198/jhse.2021.163.02
[5]. Hartman, I. (2019). NBA draft analytics: Boom or bust? In Proceedings of the SAS Global Forum 2019 Conference (Paper 3947). SAS Institute. https: //support.sas.com/resources/papers/proceedings19/3947-2019.pdf
[6]. Wang, W. (2021). The predictive power of the NBA Draft Combine: A statistical analysis. Medium. https: //wilson-wang.medium.com/the-predictive-power-of-the-nba-draft-combine-a-statistical-analysis-b45d15931fe5