


1. Introduction
Structured Note is a composite financial instrument that combines "fixed-income securities and financial derivatives". Its core logic is to provide a principal guaranteed foundation through the fixed-income part, and to seek excess returns by linking to specific underlying assets through the derivative part [1]. This type of product combines the features of "having a guaranteed minimum return" and "having a flexible potential for gains" as well as flexible selection options. However, it also has inherent risks such as poor liquidity and a high dependence on the creditworthiness of the issuer. From the present state of the market, it is estimated that the global scale of structured notes will reach 200 billion US dollars in 2024. The US dollar-denominated products, due to their status as a savings currency, have become an important investment target for cross-border investors. In the Chinese market, the proportion of guaranteed principal structured notes is approximately 38%, but they are primarily constructed of 90% of the guaranteed principal type. There has been no systematic research and reflection on the 100% guaranteed principal participation products denominated in US dollars. This study selected "474819-USD 100% Capped ProNote with Participation” as the case study. The primary rationale behind this decision is that it is a typical equity-linked note (ELN), with a simple structure (consisting only of the guaranteed principal base and the participation mechanism), and it can achieve 100% principal guarantee while pursuing the increase in the value of the underlying asset through the participation rate clause. It is an ideal example for studying guaranteed participatory structured notes. Based on this, this paper intends to systematically analyze the core factors influencing the pricing of this type of note and use the Monte Carlo simulation method to conduct pricing calculations [2]. The research results can fill the research gap in the field of 100% guaranteed return structured notes in US dollars and provide theoretical basis and practical reference for the risk management and investment decisions of similar products.
Existing research has established a preliminary framework regarding the risk characteristics and pricing models of structured notes. At the risk analysis level, Droms and Strauss pointed out that structured notes achieve downside protection and leverage gains through the combination of zero-coupon bonds and derivatives [3]. However, the complexity of the product can lead to underestimation of credit risk and liquidity risk. The failure of Lehman Brothers exposed the critical impact of the issuer's credit on the guaranteed return commitment. Sabrina further studied and found that although a high-interest rate environment enhanced the relative attractiveness of this type of product, it is necessary to be particularly vigilant about the issuer's default risk and the insufficient liquidity in the secondary market [4]. In the field of pricing models, researchers have conducted multi-dimensional explorations regarding product complexity. McCrickerd and Pakkanen proposed a Monte Carlo simulation method based on the rough volatility model, which precisely captures the implied volatility surface with a few parameters [2]. However, the non-Markov property of this model leads to the failure of the traditional P-method, and efficient numerical algorithms are required for optimization; regarding multi-asset-linked notes, the research indicates that their pricing needs to take into account complex features such as asset correlation, path dependence, and early redemption [5,6]; Kim et al. designed a fast Monte Carlo method for equity-linked securities, which improved the calculation efficiency by 16 times through piecewise constant approximation, providing important technical support for the pricing of multi-asset [7]. Overall, as the structure of structured notes becomes increasingly complex, the pricing models need to continuously incorporate real market characteristics (such as dynamic volatility and credit spreads), but this also increases the computational complexity and model risks, causing the research in this field to continuously seek a key balance between accuracy, efficiency, and interpretability. However, the pricing logic of the 100% guaranteed return structured notes in US dollars still lacks targeted analysis, leaving room for exploration in this study.
This paper takes "474819-USD 100% Capped ProNote with Participation" as the research object, focusing on the "fixed income guarantee + derivative income participation" structure. It conducts pricing research using Monte Carlo simulation: first, clearly define the key factors for pricing (such as the volatility of the underlying asset, interest rates, option terms, etc.), then simulate the asset price path to calculate the theoretical pricing, finally reveal the influencing factors and verify the rationality of the pricing, providing guidance for investors and supplementing the pricing cases of structured notes.
2. Principles and procedures of structured product pricing
2.1. Principle of pricing
The essence of pricing structured products lies in dividing the products into "fixed income guaranteed principal layer + derivative income layer” and achieving a balance between risk and return through the combination of these two parts, ensuring 100% principal protection [8]. The fixed income portion mainly invests in low-risk assets such as US Treasury bonds and high-rated US bonds. The present value is calculated using the discounted cash flow model (DCF), with the requirement that "the present value should be greater than or equal to the principal of the product". The remaining funds (i.e., the "safety margin") are used to purchase derivatives. The key parameters for pricing include the risk-free interest rate in US dollars, and the credit spread of the issuer. The derivatives section determines the profit elasticity of the product, usually using indices such as the S&P 500 as the underlying, and pricing is conducted using the Monte Carlo (Black-Scholes) model. Its value is affected by factors such as the volatility of the underlying, the participation rate, and the upper limit clause. Additionally, the maximum loss of the derivatives cannot exceed the size of the safety margin [9]. The final price needs to be deducted 0.5% - 1% of the issuance costs (underwriting fees, custody fees). The expected return for investors is "the sum of the fixed income return and the expected return from derivatives minus all costs, then divided by the principal". Even if there is a loss in derivatives, investors can still receive an annual fixed income of 1% - 2% as a guarantee.
2.2. Pricing process
Take a 3-year product priced at 1 million US dollars as an example. The pricing process consists of six steps. (1) Clarify the product terms: 100% guaranteed return, 60% participation in the 60% increase of the S&P 500 (with an upper limit of 160%), and the issuer is HSBC, etc. (2) Collect relevant market parameters, such as: the risk-free interest rate is 3.824%, the credit spread is 60 basis points, the current price of the S&P 500 is 3,969.61 points, the annualized volatility over the past three years is 15.91%, the dividend rate is 1.23% (data as of July 19, 2025), and the issuance cost is 1%. (3) Calculate the fixed income portion and allocate 3-year US dollar credit bonds with a coupon rate of 4.424%. The required investment amount is approximately 874,200 US dollars (covering both principal and interest upon maturity), with the remaining 125,800 US dollars serving as a safety cushion. (4) Calculate the value of the derivatives (Monte Carlo simulation). Purchase a call option with an exercise price of 6,351.38 points. The theoretical value is approximately 118,600 US dollars (accounting for 94.3% of the safety margin). (5) Determine the final profit. If the S&P 500 rises by 60%, the option profit would be $600,000, and the total expected profit would be approximately $1594,000, with an annualized return rate of about 19.8%. Even if the derivatives incur losses, investors can still obtain the sum of the principal ($1,000,000) and the net profit ($38,500). (6) Through sensitivity analysis, it was verified that, for instance, when the volatility rose to 25%, the expected return could increase to 22%. And by comparing it with similar products in the market (such as the annualized upper limit of similar products of DBS Bank is approximately 18%), when the S&P 500 dropped by 30%, the loss of the derivatives was approximately 118,600, but the fixed income still covered the principal. Thus, the rationality and fairness of the pricing were ensured.
2.3. Key influencing factors and risk warnings
The pricing results of structured products are influenced by three major factors. Firstly, the volatility of the underlying assets. The higher the volatility, the higher the value of the derivatives and the expected returns of investors. However, the market volatility risk will also increase. Secondly, the credit of the issuer. If the credit spread expands to 100BP, the discount rate rises to 4.824%, the fixed income investment amount increases to 857,000 US dollars, the safety margin compresses to 143,000 US dollars, the investment funds for derivatives decrease, and the expected returns may drop to around 16%. Thirdly, the market interest rate. An upward movement in the risk-free interest rate of the US dollar will increase the income of the fixed income part, but it may restrain the performance of the underlying assets (such as stock indices) and weaken the profit space of derivatives. It is particularly important to note that 100% guaranteed return relies on fixed-income assets and the creditworthiness of the issuer. If the issuer defaults or the underlying assets experience extreme fluctuations, there is still a risk of principal loss. Therefore, during the pricing process, parameters need to be dynamically adjusted to comprehensively balance returns and security.
3. Structural product pricing method
3.1. Fixed income guaranteed return layer
As the core pricing basis for the "100% guaranteed return" of the bill, the core logic of the DCF model is to calculate the present value of low-risk US dollar assets to ensure that the principal and interest at maturity can cover the bill's principal, thereby reserving a "safety margin" for derivative investment. The fixed income component of this product is zero-coupon bonds. Its pricing must closely integrate the dollar-denominated nature of the bonds, their three-year maturity, and the requirement for capital preservation. In terms of parameter selection, the risk-free interest rate is anchored to the yield of the risk-free US dollar asset that matches the maturity period - the yield of the 3-year US Treasury bond on July 23, 2025 is approximately 3.824%; the credit spread refers to the long-term credit rating of the issuer (such as HSBC), and since 100% guaranteed note have higher requirements for principal protection, the spread is usually lower than non-guaranteed products (the spread of such bonds issued by HSBC is approximately 60BP). The final discount rate is "4.424%". Taking a principal of 1 million US dollars as an example, the formula for calculating the present value of the zero-coupon bond is as follows [10].
Where PV represents the present value of the fixed-income assets, FV represents the principal to be paid at maturity (1 million US dollars), r is the discount rate (4.424%), and n is the term (3 years).
After substituting the data for calculation, the present value is approximately 87.42 US dollars. This result ensures that "the present value is greater than or equal to the present value of the product's principal", and the remaining funds, namely the "safety margin", amount to 125,800 US dollars, which is specifically used for purchasing derivatives. This is to strictly guarantee that the guaranteed return commitment will not be eroded by derivative losses. The fixed-income security of 474819 - USD 100% capped ProNote with Participation is a zero-coupon note. The option part is a call option contract with the S&P 500 Index as the underlying asset.
3.2. Pricing models and techniques for derivative products
The derivative part of the notes is a crucial component for achieving "participatory returns", with its underlying asset being a call option linked to the S&P 500 index. It adopts a non-standard return structure with a "100% participation rate and a maximum return of 160%". Since the traditional Black-Scholes model is unable to accurately handle such clauses, the Monte Carlo simulation method is adopted. This method generates a large number of price paths for the underlying assets, comprehensively reflecting different market scenarios, quantifying the value of options under complex profit rules, and at the same time ensuring that the "margin is not exceeded" (i.e., the break-even requirement is met). In the process of pricing bill options, the Monte Carlo simulation is carried out in three steps, and each step is combined with the specific parameters of the bill. The first step is to establish the basic simulation parameters. Based on the product terms and market data, the core parameters are determined. The initial price of the underlying asset S₀ is 3,969.61 points (the initial index level stated in the product issuance document); the dividend yield q is 1.23% (as of the update of the global economic data platform on July 19, 2025); the annualized volatility σ is 15.91% (based on the historical volatility of the past three years, the data source is iFinD); the risk rate r is 3.824% (consistent with the fixed income layer); the term T is 3 years (split by trading days, dt = 1/252, where 252 is the average number of trading days per year). The price path is governed by the geometric Brownian motion with dividends, as shown in Equation 2 [11].
Where
Using Formula (2), 100,000 independent 3-year index price paths were generated to ensure coverage of extreme and regular scenarios such as "bull market (upward movement exceeding 60%), bear market (downward movement exceeding 30%), and fluctuating market (up and down movement ±10%)". The simulated S&P 500 index paths are shown in Figure 1.
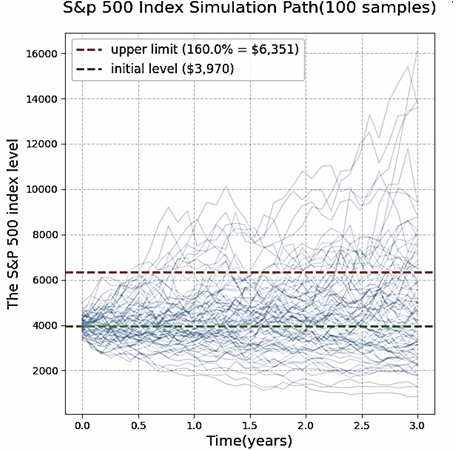
The second step involves calculating the single-path return. It strictly follows the terms in the bill, which state a "100% participation rate plus an upper limit of 160%". The upper limit of the index expiration price is 3,969.61 points multiplied by 1.6, resulting in 6,351.38 points. The maximum increase corresponding to this price is 60%, which represents the highest limit of the option's profit. The calculation rules are as follows: When the expiration index price St of a certain path is less than or equal to the initial price S0 (that is, the index declines or remains unchanged), the option income is zero, reflecting the basic principle of "guaranteed profit without loss"; when St is less than S0 and is greater than or equal to 6,351.38 points (the increase range is between 0% and 60%), the income is equal to ((St/S0) - 1) multiplied by the principal; when St exceeds 6,351.38 points (the increase exceeds 60%), the income is 60% of the principal, that is, the income limit is reached. For example, if the expiration index of a certain path is 4,763.53 points, with a rise of 20%, the profit would be 1 million US dollars multiplied by 20%, which equals 200,000 US dollars. If the index rises to 6,500 points, with an increase of 63.7%, the profit would still be calculated based on the upper limit, which is 1 million US dollars multiplied by 60%, resulting in 600,000 US dollars. At the same time, the option gains for each path are discounted at the risk-free interest rate to ensure that their present value does not exceed the safety margin of $125,800, thereby guaranteeing that the hedging constraint is not violated.
The third step is the aggregation of option values. The 100,000 paths' expiration returns are discounted to the pricing point at a risk-free interest rate of 3.824%, the present value of each path is calculated, and then the arithmetic mean of all the present values is computed to obtain the theoretical value of the option. The simulation results show that the average present value of the options is approximately $118,600, accounting for 94.3% of the safety margin, which meets the requirement of "the investment amount of options shall not exceed the safety margin". The corresponding option price per unit is $118.6 per share (that is, $118,600 divided by the contract multiplier of 1,000 US dollars per point). By increasing the number of simulation paths (such as 500,000), the calculation accuracy can be further improved. At the same time, it supports dynamic adjustment of parameters such as volatility and participation rate, providing a foundation for subsequent sensitivity analysis.
The total value of this structured product (474819 - USD 100% Capped ProNote with Participation) is $99.28, equivalent to 99.28% of the principal, with a premium of 0.72%. The product premium mainly reflects the costs of the publisher, the compensation for credit risks, and the profits. This pricing is reasonable. The relatively low premium reflects the limited option value in the current 15.91% low volatility environment, and the fee structure is in line with that of similar products in the market. Overall, this product falls into the category of "low cost, with a guaranteed return and limited earnings", making it suitable for investors with a low risk tolerance.
From the formula and calculation results of zero-coupon bonds, it can be seen that the factors influencing the partial pricing of zero-coupon bonds include the term and the risk-free interest rate. When the term and the risk-free interest rate increase, the theoretical value of zero-coupon bonds will decrease.
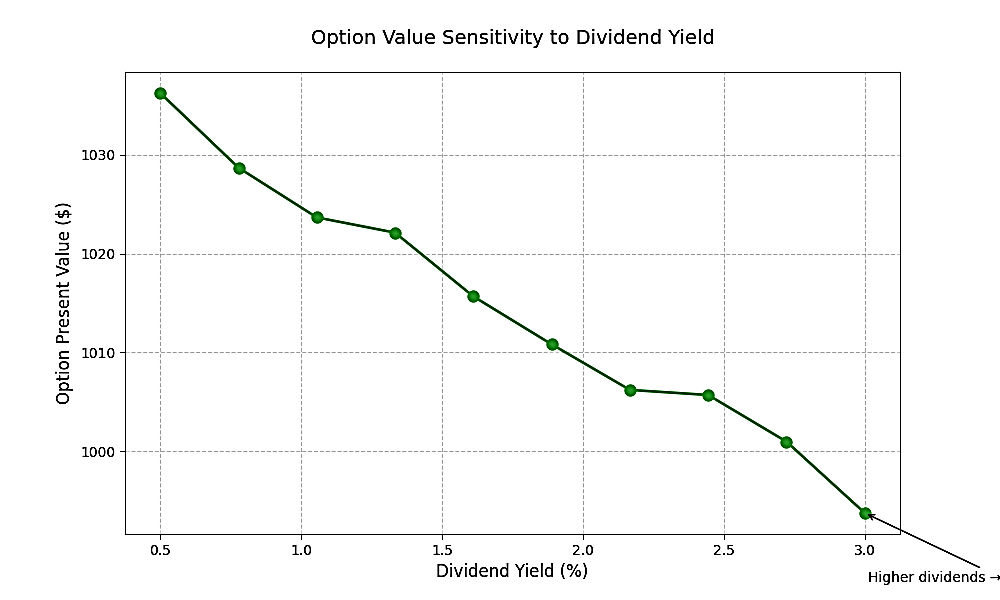
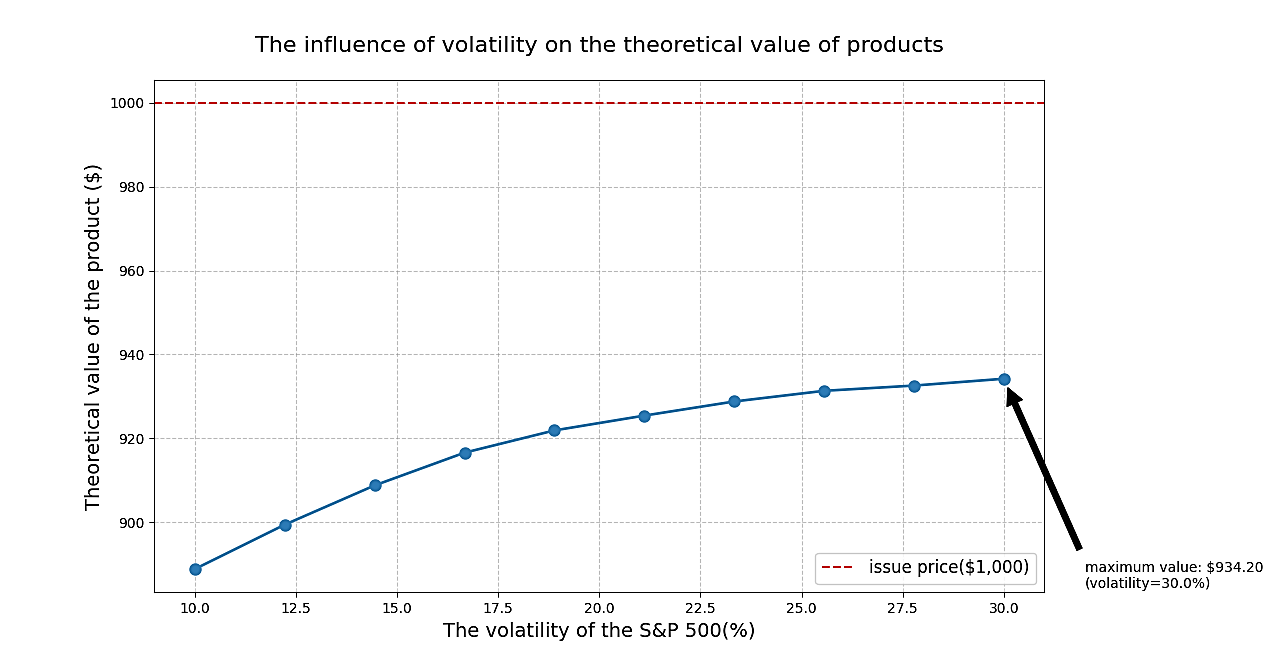
The sensitivity analysis of dividend rate and volatility is shown in Figures 2 and 3. As can be seen from Figure 2, the option value decreases as the dividend rate increases. As shown in Figure 3, the product value increases as volatility increases.
4. Integrated pricing and calibration
Through calibration, ensure that the pricing is in line with market demand and risk control. Firstly, calculate the expected return of the investors. Based on the pricing results of the fixed income layer and the derivatives layer, combined with an issuance cost of 1% (100,000 US dollars principal corresponds to 10,000 US dollars), calculate the expected return of the investors; for example, if the investment amount in the fixed income layer is 87,420 US dollars, the principal and interest coverage at maturity is 100,000 US dollars principal, the certain return is 100,000 US dollars principal, the safety margin is 12,580 US dollars, and the theoretical value of the derivatives options (expected return present value) is 118,600 US dollars; after deducting 10,000 US dollars issuance cost, the total expected return is 234,400 US dollars, corresponding to a total annualized return of 23.44% over 3 years, and an annualized expected return of approximately 7.81%, which conforms to the feature of the bill "with a guaranteed minimum return and an elastic upper limit". Secondly, multi-dimensional calibration, sensitivity test, S&P 500 volatility rises to 25%: average option return is $145,000, total expected return is $260,800, annualized return is 8.69%; risk-free interest rate sensitivity test, three-year US Treasury bond yield rises to 5% (discount rate 5.6%), i.e., fixed income layer investment amount is $844,800, safety margin expands to $155,200, total expected return increases with the increase of fixed income (needs to balance the risk of high interest rates suppressing the underlying assets); issuer credit spread expands to 100BP (discount rate 4.824%): fixed income layer investment amount is $857,000, safety margin shrinks to $143,000, option income is $112,000, total expected return is $245,000, annualized 7.26% (still within a reasonable range).
Market fairness verification: By comparing with similar products, the rationality of pricing is verified. Reference: The "3-year US dollar 100% guaranteed return, S&P 500 benchmark certificate" issued by DBS Bank during the same period has terms of "participation rate 100%, upper limit 150%", with an annualized return upper limit of approximately 20.5%. This product has an upper limit of 160%, corresponding to an annualized return upper limit of approximately 23.86%, which is slightly higher than that of the DBS product. This is mainly due to the volatility parameter (15.91%) matching the market level, and the issuance cost (1%) being within the industry's normal range (0.5%-1%), so the pricing does not deviate from the market fair value.
5. Conclusion
This article conducts a pricing study on the 100% guaranteed principal participation type structured note (3-year term) linked to the S&P 500 index. By integrating the fixed income layer and using the DCF model to calculate with the 3.824% three-year US Treasury bond yield on July 23, 2025 as the risk-free rate, and adding an 60BP credit spread (discount rate 4.424%), it is necessary to allocate 874,200 US dollars of zero-coupon notes to cover 1,000,000 US dollars of principal, forming a "safety margin" of 125,800 US dollars. In the derivatives layer, through Monte Carlo simulation (100,000 index paths, based on an annualized volatility of 15.91% and a dividend rate of 1.23%), the theoretical value of the S&P 500 index-linked call option (100% participation rate, 160% upper limit) is estimated to be 118,600 US dollars. After deducting an issuance cost of 1% (10,000 US dollars), the total expected revenue of the product is 234,400 US dollars, corresponding to an annualized expected return of 7.81%. The revenue characteristics perfectly match the "guaranteed minimum, flexible upper limit" feature. Moreover, the pricing fairness has been verified through sensitivity tests (volatility, risk-free interest rate adjustment) and market comparisons (reference to similar products of DBS Bank). This process not only provides investors with clear references for risk and return, facilitating decision-making; but also offers data support for the issuance enterprises to optimize product terms (such as participation rate, linked target), while ensuring the pricing order of the structured product market and aligning with the core value of "serving multiple stakeholders' needs" as studied.
However, there are still two shortcomings in the current pricing method: Firstly, the Monte Carlo simulation relies on parameters such as historical volatility and expected return rate. If the parameters are selected only based on short-term data (such as the volatility in the past 3 years and the interest rate on the pricing day), it may not be able to adapt to extreme market scenarios (such as sudden increases in volatility caused by black swan events); Secondly, the market comparison samples are mostly limited to the same type of products in the same period, lacking cross-regional (such as between the European and American markets and the Asian-Pacific markets) and cross-term reference dimensions, and the fairness verification is not comprehensive enough. The future improvement should be carried out at three levels: At the regulatory level, it is necessary to require issuing enterprises to disclose the historical data range and logic for parameter selection, mandate the public display of the number of simulation paths, and enhance transparency; The future improvement should be carried out at three levels: At the regulatory level, it is necessary to require issuing enterprises to disclose the historical data range and logic for parameter selection, mandate the public display of the number of simulation paths, and enhance transparency; for industry enterprises, they can introduce dynamic parameter adjustment models, combine real-time market fluctuations to update volatility and risk-free interest rates, and enhance the adaptability of pricing; At the investor level, it is necessary to strengthen the ability to interpret parameters, by learning the core logic of Monte Carlo simulation, avoid deviation in expected returns caused by parameter misunderstandings, and enhance the ability to judge risks.
References
[1]. Lee, T. S. and Lin, H.Y. (2009). The pricing of structured notes with credit risk. Investment Management and Financial Innovations, 6 (4), 221-232
[2]. Mccrickerd, R. and Pakkanen, M. S. (2018). Turbocharging Monte Carlo pricing for the rough Bergomi model. Quantitative Finance, 18(11), 1877-1886
[3]. Droms, W. G. and Strauss, S. N. (2012). Structured Notes in a Balanced Portfolio: Enhancing Returns with Tail Risk Protection. Journal of Financial Planning, 25 (11), 68-75
[4]. Sabrina, T. W. (2024). Structured Notes: A nontraditional, customizable tool that’s useful for retiring clients. Source Media dba Arizent.
[5]. Sharma, A., Chen, F., Noh, J., Dejesus, J. and Schlener, M. (2024). Hedging and Pricing Structured Products Featuring Multiple Underlying Assets. Conference acronym’ICAIF, 14 (17), 1-7.
[6]. Li, H. (2023). Case Analysis of HSBC's "Profit to Flexibility" Structured Deposit Product. Journal of Financial Research, 5 (518), 187-202.
[7]. Kim, C. and Jeong, Y. (2023). A Practical Monte Carlo Method for Pricing Equity-Linked Securities with Time-Dependent Volatility and Interest Rate. Journal of Computational Finance.10.1007/s10614-023-10394-3.
[8]. Fang, Y., Zhang, Y. X., Liu, J. Z. and Zhang J. (2018). A study of Pricing for Structured Financial Products Linked with Multi-Asset. Journal of Fudan University (Natural Science), 57(5): 554-564, 579.
[9]. Gao, Y., Wang, J. H. and Yang, A. J. (2011). Estimation on Portfolio Risk via Time-varying T-copula and Monte-carlo Method. Chinese Journal of Management Science, 19(2): 10-15.
[10]. Smith, J. and Johnson, M. (2023). Structured Products in Retirement Portfolios: A Mean- Variance Analysis. Journal of Retirement Planning, 10 (2), 45-68.
[11]. John, C. H. (2023). Options, Futures, and Other Derivatives. Pearson Education, 108-112.
Cite this article
Tang,Y. (2025). Research on Pricing Factors of Structured Financial Products: Taking USD 100% Capped ProNote with Participation as an Example. Advances in Economics, Management and Political Sciences,233,9-17.
Data availability
The datasets used and/or analyzed during the current study will be available from the authors upon reasonable request.
Disclaimer/Publisher's Note
The statements, opinions and data contained in all publications are solely those of the individual author(s) and contributor(s) and not of EWA Publishing and/or the editor(s). EWA Publishing and/or the editor(s) disclaim responsibility for any injury to people or property resulting from any ideas, methods, instructions or products referred to in the content.
About volume
Volume title: Proceedings of ICFTBA 2025 Symposium: Data-Driven Decision Making in Business and Economics
© 2024 by the author(s). Licensee EWA Publishing, Oxford, UK. This article is an open access article distributed under the terms and
conditions of the Creative Commons Attribution (CC BY) license. Authors who
publish this series agree to the following terms:
1. Authors retain copyright and grant the series right of first publication with the work simultaneously licensed under a Creative Commons
Attribution License that allows others to share the work with an acknowledgment of the work's authorship and initial publication in this
series.
2. Authors are able to enter into separate, additional contractual arrangements for the non-exclusive distribution of the series's published
version of the work (e.g., post it to an institutional repository or publish it in a book), with an acknowledgment of its initial
publication in this series.
3. Authors are permitted and encouraged to post their work online (e.g., in institutional repositories or on their website) prior to and
during the submission process, as it can lead to productive exchanges, as well as earlier and greater citation of published work (See
Open access policy for details).
References
[1]. Lee, T. S. and Lin, H.Y. (2009). The pricing of structured notes with credit risk. Investment Management and Financial Innovations, 6 (4), 221-232
[2]. Mccrickerd, R. and Pakkanen, M. S. (2018). Turbocharging Monte Carlo pricing for the rough Bergomi model. Quantitative Finance, 18(11), 1877-1886
[3]. Droms, W. G. and Strauss, S. N. (2012). Structured Notes in a Balanced Portfolio: Enhancing Returns with Tail Risk Protection. Journal of Financial Planning, 25 (11), 68-75
[4]. Sabrina, T. W. (2024). Structured Notes: A nontraditional, customizable tool that’s useful for retiring clients. Source Media dba Arizent.
[5]. Sharma, A., Chen, F., Noh, J., Dejesus, J. and Schlener, M. (2024). Hedging and Pricing Structured Products Featuring Multiple Underlying Assets. Conference acronym’ICAIF, 14 (17), 1-7.
[6]. Li, H. (2023). Case Analysis of HSBC's "Profit to Flexibility" Structured Deposit Product. Journal of Financial Research, 5 (518), 187-202.
[7]. Kim, C. and Jeong, Y. (2023). A Practical Monte Carlo Method for Pricing Equity-Linked Securities with Time-Dependent Volatility and Interest Rate. Journal of Computational Finance.10.1007/s10614-023-10394-3.
[8]. Fang, Y., Zhang, Y. X., Liu, J. Z. and Zhang J. (2018). A study of Pricing for Structured Financial Products Linked with Multi-Asset. Journal of Fudan University (Natural Science), 57(5): 554-564, 579.
[9]. Gao, Y., Wang, J. H. and Yang, A. J. (2011). Estimation on Portfolio Risk via Time-varying T-copula and Monte-carlo Method. Chinese Journal of Management Science, 19(2): 10-15.
[10]. Smith, J. and Johnson, M. (2023). Structured Products in Retirement Portfolios: A Mean- Variance Analysis. Journal of Retirement Planning, 10 (2), 45-68.
[11]. John, C. H. (2023). Options, Futures, and Other Derivatives. Pearson Education, 108-112.