


1. Introduction
In the era of the digital economy, with the continuous improvement of blockchain technology, encrypted digital currencies represented by Bitcoin have gradually developed from edge assets into global financial products with a market value of over three trillion US dollars. However, the price volatility of cryptocurrencies far exceeds that of traditional financial assets, so it is crucial for investors and regulatory agencies to grasp the price volatility trends and pricing mechanisms of cryptocurrencies.
The results of Mi's research show that network factors have a significant positive impact on cryptocurrency prices, while information factors can amplify price fluctuations in a short period of time [1]. Yang pointed out in his research that the intrinsic factors of cryptocurrencies and the linkage factors between encrypted assets have an impact on price fluctuations [2]. However, few researchers have focused on the impact of macro policy factors on cryptocurrencies.
Cryptocurrencies are sometimes regarded as digital gold with certain anti-inflation properties, but they can also affect the independence of monetary policy, thereby reducing the economy's ability to withstand external shocks [3]. Therefore, under the influence of policies, cryptocurrencies have fallen simultaneously with risky assets, and Bitcoin, which has plummeted at some important nodes, is not favored as a safe-haven asset [4]. Even different countries' policies have varying impacts on it, such as the US government's cryptocurrency policy adjustments and the Russian government's cryptocurrency policy [5, 6]. Under the impact of COVID-19, in Gao's research, Bitcoin and gold were listed as risk aversion assets together [7]. In summary, the hedging function of cryptocurrencies is highly constrained by the policy environment and macro shocks, so studying the impact of macro policies on the price fluctuations of cryptocurrencies is meaningful.
To simplify the topic, this study mainly focuses on two issues: whether there is a time-varying correlation between monetary policy (taking the United States as an example) and cryptocurrency returns, and whether major events will change the mechanism of macroeconomic factors.
This study analyzed the price of Bitcoin and six influencing indicators based on the Pearson correlation coefficient and the Autoregressive Integrated Moving Average (ARIMA) model. Aim to quantify the transmission path of macroeconomic shocks, reflect the impact of cryptocurrency price fluctuations help build a more robust asset allocation framework.
2. Method
2.1. Data sources and explanations
Cryptocurrencies are downloaded from Coingecko using price as an indicator, while macro variable data is downloaded from the FRED database, including Consumer Price Index (CPI), Producer Price Index (PPI), federal funds rate, inflation rate, M2 money supply, and US dollar index [8, 9]. CoinGecko website was founded in 2014 and is a leading aggregator of cryptocurrency data, covering over 12000 cryptocurrencies and hundreds of exchanges. The FRED database is maintained by the St. Louis branch of the Federal Reserve and is an official statistical agency. Therefore, the data selection is authoritative.
2.2. Indicator selection and explanation
Selecting data from the ten years of 2015-2024, including four Federal Reserve interest rate hike cycles, three Bitcoin halving events, and extreme fluctuations in inflation rates ranging from 1% to 9%. Table 1 shows the names and reasons for selecting seven variables.
|
variable name |
Reason for selection |
|
Bitcoin price |
Bitcoin has the longest history of issuance, dominates the cryptocurrency market, and has a large and complete amount of data; Bitcoin has the highest level of decentralization and is best suited for research needs; There are many interference factors from other counterfeit currencies. |
|
CPI |
The core variable of expected inflation |
|
PPI |
Leading indicators that can predict the future trend of CPI |
|
Federal Funds Rate(FFR) |
The core transmission channel of monetary policy |
|
Inflation |
Verify whether the claim that Bitcoin can hedge against fiat currency depreciation is true. |
|
Money Supply M2(M2REAL) |
Verify the impact of liquidity on cryptocurrency assets |
|
U.S.Dollar Index(DXY) |
Verify whether the strengthening of the US dollar will suppress cryptocurrency prices. |
2.3. Method introduction
This article first processes the data in Table 1, unifies the data types, converts daily frequency data into monthly data by calculating the average value, and then performs data cleaning to fill in missing values and remove outliers.
Then, calculate the Pearson correlation coefficients between the Bitcoin price and six variables to verify whether there is a time-varying correlation. The Pearson correlation coefficient is used to evaluate the degree of collaborative change through the decentralized data of two variables. Due to standardization, the calculated values are not affected by dimensionality and scale, which allows for direct comparison of correlations between different datasets.
Next, perform an ADF test on the data (by checking whether the sequence has unit roots to determine if the time series is stationary). If it is not stationary, perform differential processing on the data until it is stationary, and then use the ARIMA model for time series prediction. Assuming that macro factors predict the trend of Bitcoin price fluctuations, the core idea of the ARIMA model is to explain the value of a time point in a sequence by combining past values and past prediction errors. The model has strong interpretability and can handle non-stationary sequences.
Finally, according to the results obtained, observe whether major events (strengthening digital gold during the COVID-19 epidemic, the Biden government triggering inflation and interest rate hikes, etc.) have changed the mechanism of macro factors.
3. Results and discussion
3.1. Time-varying correlation
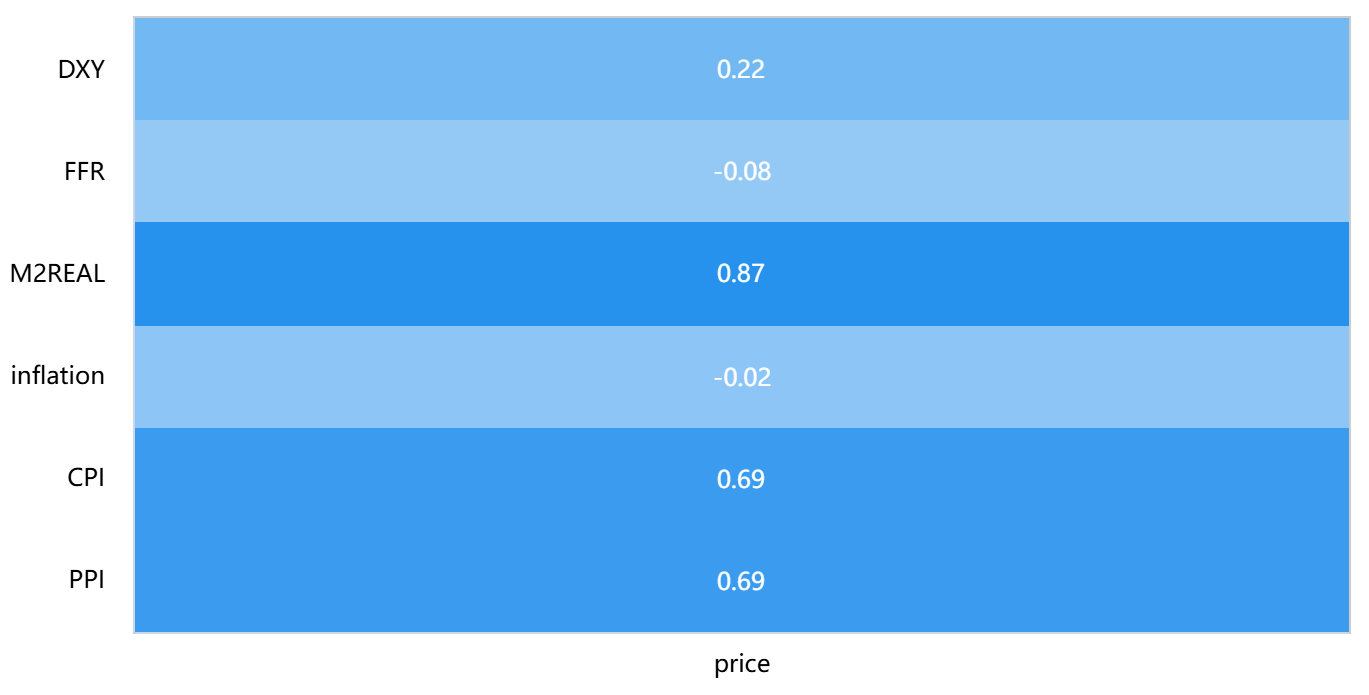
Based on Table 2, the following conclusion can be drawn: there is a significant positive correlation between price and DXY. There is no correlation between price and FFR. The correlation coefficient between price and M2REAL is 0.866, and shows significance at the 0.01 level, indicating a significant positive correlation between price and M2REAL. There is no correlation between price and inflation. There is a significant positive correlation between price and CPI. There is a significant positive correlation between price and PPI.
|
price |
||
|
DXY |
correlation coefficient |
0.219* |
|
sample size |
100 |
|
|
FFR |
correlation coefficient |
-0.080 |
|
sample size |
100 |
|
|
M2REAL |
correlation coefficient |
0.866** |
|
sample size |
100 |
|
|
inflation |
correlation coefficient |
-0.019 |
|
sample size |
100 |
|
|
CPI |
correlation coefficient |
0.693 |
|
sample size |
100 |
|
|
PPI |
correlation coefficient |
0.687** |
|
sample size |
100 |
|
|
* p<0.05 ** p<0.01 |
||
Visualizing the data, according to Figure 1, the darker the color, the stronger the correlation. It can be intuitively seen that the US dollar index, CPI, PPI, and M2 money supply are all correlated with the price of Bitcoin. The M2 money supply has the greatest impact on the price of Bitcoin, as it has the highest correlation coefficient and the smallest p-value. CPI and PPI also have similarly small p-values, far below the significance level of 0.05. Therefore, they may both be highly significant predictors of the influencing variables.
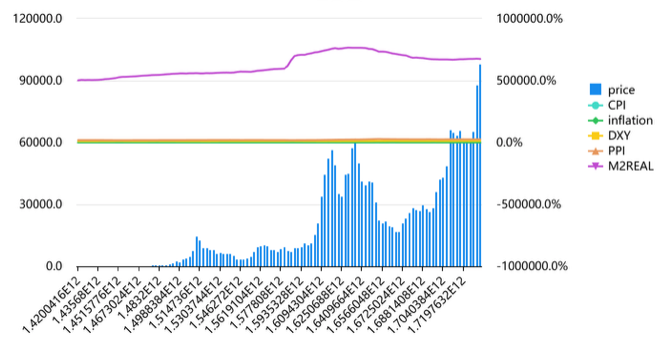
From Figure 2, it can be more intuitively seen that there is a significant co-directional fluctuation between M2 money supply and Bitcoin price; therefore, there is a positive correlation between the two. Other variables do not have a significant, consistent fluctuation with Bitcoin price (the main axis is the left coordinate, corresponding to larger units of data, and the secondary axis is the right coordinate, corresponding to percentage-type data), but Bitcoin price cannot mainly depend on this one variable.
3.2. ARIMA predict
Through ADF testing, perform first-order differencing on Bitcoin prices and second-order differencing on other variables, and predict for the next twelve periods. As shown in Table 3, the price of Bitcoin is mainly showing an upward trend, CPI,PPI, , the US dollar index are mainly showing a downward trend, while the M2 money supply is mainly showing an upward trend. Compared with reality, the price of Bitcoin mainly shows an upward trend, but there are slight fluctuations in between. CPI fluctuates greatly, PPI is relatively stable, the US dollar index shows an upward trend, and M2 money supply shows a downward trend, all of which are contrary to the predicted results. This comparison can reflect that the price of Bitcoin is not influenced by a single factor with strong correlation, but is determined by the combined action of multiple variable factors. Zhao Xin and Qin Jiangtao effectively predicted the price of cryptocurrencies through a hybrid model and machine learning in their research [10]. Therefore, the prediction performance can be improved by improving the model.
|
Predict |
price |
FFR |
inflation |
CPI |
PPI |
M2REAL |
DXY |
|
Backward 1 period |
30670.176 |
4.898 |
2.067 |
4.658 |
254.594 |
6814.630 |
119.427 |
|
Backward 2 period |
32271.719 |
4.922 |
2.031 |
4.485 |
252.282 |
6793.682 |
119.439 |
|
Backward 3 period |
33661.927 |
4.907 |
1.996 |
4.350 |
250.024 |
6781.228 |
119.424 |
|
Backward 4 period |
34854.804 |
4.857 |
1.962 |
4.247 |
247.865 |
6776.502 |
119.392 |
|
Backward 5 period |
35863.272 |
4.777 |
1.931 |
4.175 |
245.838 |
6778.706 |
119.349 |
|
Backward 6 period |
36700.097 |
4.672 |
1.902 |
4.130 |
243.972 |
6787.023 |
119.298 |
|
Backward 7 period |
37378.295 |
4.547 |
1.877 |
4.109 |
242.287 |
6800.631 |
119.243 |
|
Backward 8 period |
37911.225 |
4.407 |
1.855 |
4.111 |
240.798 |
6818.717 |
119.187 |
|
Backward 9 period |
38312.517 |
4.257 |
1.835 |
4.131 |
239.512 |
6840.487 |
119.131 |
|
Backward 10 periods |
38595.911 |
4.100 |
1.819 |
4.168 |
238.435 |
6865.178 |
119.077 |
|
Backward 11 period |
38775.071 |
3.941 |
1.807 |
4.220 |
237.565 |
6892.069 |
119.026 |
|
Backward 12 period |
38863.392 |
3.782 |
1.797 |
4.283 |
236.897 |
6920.486 |
118.979 |
Compared to the actual data, although the prices in the early stage did not match the predicted trend, the overall fluctuation was relatively small, and the prices in the last two periods have already approached 95% of the predicted upper line.
The evaluation index results are: root mean square error RMSE 3193.6745, mean square error MSE 10199556.8789, average absolute error MAE 1848.0502, and average absolute percentage error MAPE 0.1880.
3.3. The impact of major events on macro factor mechanisms
Observing the data, it can be concluded that the growth rate of M2 in the United States reached a historical high in the middle of the pandemic. In the early stages, the decrease in demand caused by deflationary pressure led to a temporary slump in CPI, while in the later stages, the rise in PPI intensified CPI inflation through downstream transmission through the industrial chain. At the beginning of the outbreak, the US dollar index quickly broke 103, and the medium-term easing policy was pushed down to below 90. Later, the Russia-Ukraine conflict led to the strengthening of the US dollar's risk aversion ability, and the US dollar index broke 114.
Observing the price of Bitcoin, it experienced a panic plunge in the early stages, plummeting 50% in a single day, but skyrocketed to a historical high in the middle, and later, the Federal Reserve's interest rate hike caused a significant correction in Bitcoin prices. It can be seen that under major events, the price of Bitcoin still shows a certain correlation with macro variables, and the mechanism of macro factors has not been greatly affected. In Liu Qingsong's research, it was concluded through Pearson correlation coefficient, time series analysis, and Granger causality test that there is a significant linkage between the returns of the cryptocurrency market and the global stock market [11]. Therefore, improving research methods may also reveal the impact of major events on macro factor mechanisms.
4. Conclusion
In summary, according to research, highly decentralized cryptocurrency prices are indeed influenced to some extent by macroeconomic policies. The price of Bitcoin is time-varying correlated with M2 money supply, CPI, PPI, and the US dollar index. It can be concluded that inflation, liquidity, and the trend of the US dollar will all have an impact on cryptocurrency. Therefore, it can be concluded that cryptocurrency is chosen as a safe haven asset, which requires a great deal of risk. The strengthening of the US dollar will also, to some extent, suppress the price increase of cryptocurrency. According to the analysis of data during the epidemic, it was found that the mechanism of action of macro factors was not greatly affected. In addition, the ARIMA model has inherent limitations and is more suitable for predicting short-term data. It is not the most useful or accurate model for predicting cryptocurrency prices, so the predicted results may differ from reality. Choosing a more scientific and effective model can still improve the accuracy of predicting Bitcoin prices through macro factors. In addition, an insufficient sample size of the sample can also affect the prediction performance. This article only used 120 variables from 6 samples for testing, and the data size is slightly small. Therefore, in future research, it is possible to consider increasing the dataset and adjusting the model selection to see if it can improve the accuracy of predictions.
References
[1]. Mi, J., & Wang, Y. (2022). New progress in research on digital currency and its economic impact. Economic Dynamics, 5, 127–142.
[2]. Yang, X. (2024). Research on price volatility of distributed finance (DeFi) platform tokens (Master’s thesis). Beijing University of Posts and Telecommunications.
[3]. Guo, C., & Chen, G. (2018). Can Bitcoin be used as a tool to control inflation? Business Research, 5, 96–102.
[4]. Guo, K. (2022). Can Bitcoin become a safe haven asset? China Economic Weekly, 7, 105–106.
[5]. Tan, J. (2025). US cryptocurrency policy adjustment: Reasons, effects, and responses. Open Report, 2, 75–85.
[6]. Shen, J., & Zhu, T. (2025). The policy evolution and development prospects of cryptocurrency in Russia. International Finance, 4, 60–66.
[7]. Gao, D., & Tong, Q. (2024). Research on the difference between gold and bitcoin in hedging against China’s stock market during COVID-19—Based on the DCC-GARCH t-Copula model. Systems Science and Mathematics, 44(2), 326–341.
[8]. CoinGecko. (2025, July 26). Cryptocurrency prices. Retrieved July 26, 2025, from https: //www.coingecko.com
[9]. Federal Reserve Bank of St. Louis. (2025, July 13). Economic data (FRED). Retrieved July 26, 2025, from https: //fred.stlouisfed.org
[10]. Zhao, X., & Qin, J. (2025). Research on the decomposition and integration framework of cryptocurrency price prediction. Journal of Chongqing Technology and Business University (Natural Science Edition), 1–13. Advance online publication.
[11]. Liu, Q. (2023). Research on the linkage and risk spillover effects of cryptocurrencies and global stock markets during COVID-19 (Doctoral dissertation). Shanghai University of Finance and Economics.
Cite this article
Song,Y. (2025). Analysis of Macro Factors Influencing Cryptocurrency Price Fluctuations. Advances in Economics, Management and Political Sciences,233,59-65.
Data availability
The datasets used and/or analyzed during the current study will be available from the authors upon reasonable request.
Disclaimer/Publisher's Note
The statements, opinions and data contained in all publications are solely those of the individual author(s) and contributor(s) and not of EWA Publishing and/or the editor(s). EWA Publishing and/or the editor(s) disclaim responsibility for any injury to people or property resulting from any ideas, methods, instructions or products referred to in the content.
About volume
Volume title: Proceedings of ICFTBA 2025 Symposium: Data-Driven Decision Making in Business and Economics
© 2024 by the author(s). Licensee EWA Publishing, Oxford, UK. This article is an open access article distributed under the terms and
conditions of the Creative Commons Attribution (CC BY) license. Authors who
publish this series agree to the following terms:
1. Authors retain copyright and grant the series right of first publication with the work simultaneously licensed under a Creative Commons
Attribution License that allows others to share the work with an acknowledgment of the work's authorship and initial publication in this
series.
2. Authors are able to enter into separate, additional contractual arrangements for the non-exclusive distribution of the series's published
version of the work (e.g., post it to an institutional repository or publish it in a book), with an acknowledgment of its initial
publication in this series.
3. Authors are permitted and encouraged to post their work online (e.g., in institutional repositories or on their website) prior to and
during the submission process, as it can lead to productive exchanges, as well as earlier and greater citation of published work (See
Open access policy for details).
References
[1]. Mi, J., & Wang, Y. (2022). New progress in research on digital currency and its economic impact. Economic Dynamics, 5, 127–142.
[2]. Yang, X. (2024). Research on price volatility of distributed finance (DeFi) platform tokens (Master’s thesis). Beijing University of Posts and Telecommunications.
[3]. Guo, C., & Chen, G. (2018). Can Bitcoin be used as a tool to control inflation? Business Research, 5, 96–102.
[4]. Guo, K. (2022). Can Bitcoin become a safe haven asset? China Economic Weekly, 7, 105–106.
[5]. Tan, J. (2025). US cryptocurrency policy adjustment: Reasons, effects, and responses. Open Report, 2, 75–85.
[6]. Shen, J., & Zhu, T. (2025). The policy evolution and development prospects of cryptocurrency in Russia. International Finance, 4, 60–66.
[7]. Gao, D., & Tong, Q. (2024). Research on the difference between gold and bitcoin in hedging against China’s stock market during COVID-19—Based on the DCC-GARCH t-Copula model. Systems Science and Mathematics, 44(2), 326–341.
[8]. CoinGecko. (2025, July 26). Cryptocurrency prices. Retrieved July 26, 2025, from https: //www.coingecko.com
[9]. Federal Reserve Bank of St. Louis. (2025, July 13). Economic data (FRED). Retrieved July 26, 2025, from https: //fred.stlouisfed.org
[10]. Zhao, X., & Qin, J. (2025). Research on the decomposition and integration framework of cryptocurrency price prediction. Journal of Chongqing Technology and Business University (Natural Science Edition), 1–13. Advance online publication.
[11]. Liu, Q. (2023). Research on the linkage and risk spillover effects of cryptocurrencies and global stock markets during COVID-19 (Doctoral dissertation). Shanghai University of Finance and Economics.