


1. Introduction
The international tourism and travel industry has been significantly transformed by a range of factors such as decreasing costs of airfares, growth of sharing economies, evolution of tourist preferences, and increased popularity of alternative tourism. Less frequently mentioned, but increasingly more so now, is the risk perception influence on tourism, particularly that of terrorism, political unrest, and natural disasters. These events are unpredictable and geographically specific, with profound effects on the choice of destination and prompting tourists to take safety precautions. Of these, the purchasing of travel insurance has become a central element for uncertainty mitigation. The global market for travel insurance has expanded. According to the UNWTO World Tourism Barometer 2025, in the first semester of 2025, global tourist travel increased by 5%, with about 300 million tourists [1]. Though some visitors might perceive risk as appealing in specific situations [2], it is more widely considered to be an undesirable component of the holiday experience [3,4]. Therefore, travelers practice risk-reduction activity [4-7], one of the most important mechanisms of which is insurance. The primary function of travel insurance is to reduce exposure to individual, insurable risks such as theft, health emergencies, and loss of property—risks that are generally not correlated among travelers and hence readily pollable by insurers [8-10]. By contrast, catastrophes like pandemics realize very correlated losses in hundreds of policyholders and are therefore hard to insure and tend to be ruled out of standard cover on the grounds of risk diversification impossibility [9,10].
Notwithstanding the widely documented role of travel insurance in mitigating health and economic hazards of international travel, its actual purchase behavior is patchy and ill-defined. Previous research has documented extensive geographical disparities in insurance take-up as well as demographic patterns related to buying behavior [5-8]. However, such a body of literature carries its own list of limitations. For instance, most studies are grounded on traditional statistical analyses, primarily binary logistic regression, which may fail to capture complex, non-linear interactions between conduct variables like behavioral, demographic, and psychological [11,12]. Traditional demographic-driven approaches are often not sufficient to represent the complex behavior of modern consumers. Therefore, applying data-driven machine learning algorithms offers an accurate and scalable method to identify potential customers of travel insurance. Cognate studies have proved that travel insurance is a key contributor to offsetting the costly nature of overseas medical facilities, which may not always come under national health covers.
However, penetration of actual insurance differs sharply, with some regions, such as Hong Kong, having relatively low coverage relative to the West [13]. Population profiles always show that adults who are older, educated, and married will be most likely to purchase travel insurance. Various studies have attempted to replicate the behaviors, primarily using binary logistic regression[5,11,12]. For example, Kai et al. focused on the elderly and emphasized social learning and peer influence regarding the insurance purchase decision [12]. Similarly, Sarman et al. applied an Integrated Choice and Latent Variable (ICLV) model, which incorporated travel motives and personality [11]. Other studies, such as Lo, Cheung, and Law, employed population surveys at the population level to establish gender, income, and travel frequency trends [5]. Disparities occur, however, as some conclude women and high-income people are more likely to purchase coverage, while others find higher take-up in married men or frequent travelers[5,11,12]. These differences demonstrate a fragmented view of consumption in this sector.
This study intends to bridge the gap in existing studies by employing several machine learning methods to develop a very generalization-performing model in anticipating the behavior of buying travel insurance. Employing more advanced classification methods, such as tree-based models, this study provides a nuanced understanding of the most significant determinants influencing consumer choices in the travel insurance industry. For insurers, understanding what drives the intent to purchase travel insurance is necessary in creating successful targeting marketing strategies and optimizing customer segmentation. As the improved predictive data can guide insurers in creating targeted marketing campaigns, designing targeted risk messages, and optimizing policy products to increase coverage penetration among under covered segments of travelers. This approach enhances the efficacy of marketing and serves to enhance resource allocation and budget management in the insurance sector.
2. Literature review
Research has shown that a substantial percentage, between 30% and 50%, of overseas travelers may be sick or injured while abroad [14]. The high expenses of foreign healthcare, not generally included in domestic insurance coverage, has made end-to-end travel insurance a rising need to manage health-associated risks overseas [15]. The use of travel medical insurance continues to remain high across the globe. For example, a survey of Hong Kong mainland-bound visitors revealed only 20% of respondents had purchased medical insurance for travel—far lower than in most Western countries [13]. Demographic trends show increased chances of such purchases among the elderly (45–60 years), those with higher education, and married men who are university graduates. To substantiate this, Mitchell et al. mentioned travel insurance to be the most successful second strategy for minimizing the negative effects of organized travel [16].
Recent studies have applied limited modeling approaches to examine the behavioral factors influencing travel insurance purchases. Sarman et al. and Kai et al. both employed logistic regression model to analyze the key factors affecting whether a traveler will buy travel insurance [11,12]. Sarman et al. applied the ICLV model based on binary logistic regression to explore insurance purchase decisions for individuals during leisure travels [11]. Results illustrate that personality traits, followed by sociodemographic and travel-related determinants, are key factors in determining insurance purchase decisions [11]. According to Kai et al., the research focused on the seniors and utilized binary logistic regression to analyze how peer effects, including social learning, conformity, and comparison behaviors, shape older adults' intentions to purchase travel insurance in China [12].
Other studies employed population-based survey analytics, while the existing findings are often inconsistent. A study by Lo, Cheung, and Law analyzing travel risk-mitigation behaviors among Hong Kong residents, using descriptive statistics and linear regression, revealed that women with higher educational attainment and salaries are inclined to obtain travel insurance [5]. This tendency also extends to seasoned travelers and tourists with long journeys. Conversely, individuals who are within the youngest and oldest age brackets have a lower probability of purchasing such coverage. In contrast, Lau, Yang, and Tsui reported different outcomes, noting that male participants with higher education degrees and those who were in a marriage exhibited a higher likelihood of purchasing travel insurance [13]. Furthermore, their study indicated that travelers from Western nations are generally more likely to secure medical insurance to cover health-related expenses compared to those from Asian countries.
3. Exploratory data analysis
This study investigates further application of machine learning algorithms in travel insurance purchase behavior prediction, based on a dataset with 10.00 usability rating retrieved from the Kaggle website [17]. This dataset provides information on approximately 2,000 past customers and seeks to develop a predictive model capable of determining whether an emption of a travel insurance package will happen based upon a provided set of pre-established features.
In the dataset eight indicators were selected for analysis (Table 1): Age (Age of the customer), Employment Type (The sector in which customer is employed), GraduateOrNot (Whether the customer is college graduate or not), AnnualIncome (The yearly income of the customer in Indian Rupees [Rounded to nearest 50 thousand Rupees), FamilyMembers (Number of members in customer's family), ChronicDiseases (Whether the customer suffers from any major disease or conditions like diabetes/high BP or Asthama, etc.), FrequentFlyer (Derived data based on customer's history of booking air tickets on at least 4 different instances in the last 2 years [2017-2019].), and EverTravelledAbroad (Has the customer ever travelled to a foreign country). The TravelInsurance (Did the customer buy travel insurance package during introductory offering held in the year 2019) is utilized as the dependent variable to identify if the customer purchased the travel insurance. Then this dataset is summarized in Table 1, which has been counted and utilized for data description and model training.
|
Age |
Employment Type |
Graduate Or Not |
Annual Income |
Family Members |
Chronic Diseases |
Frequent Flyer |
Ever Travelled Abroad |
Travel Insurance |
|
|
count |
1987 |
1987 |
1987 |
1987 |
1987 |
1987 |
1987 |
1987 |
1987 |
|
mean |
29.650226 |
0.713135 |
0.851535 |
933000 |
4.752894 |
0.277806 |
0.209864 |
0.191243 |
0.357323 |
|
std |
2.913308 |
0.452412 |
0.35565 |
377000 |
1.60965 |
0.44803 |
0.407314 |
0.393379 |
0.479332 |
|
min |
25 |
0 |
0 |
300000 |
2 |
0 |
0 |
0 |
0 |
|
25% |
28 |
0 |
1 |
600000 |
4 |
0 |
0 |
0 |
0 |
|
50% |
29 |
1 |
1 |
900000 |
5 |
0 |
0 |
0 |
0 |
|
75% |
32 |
1 |
1 |
125000 |
6 |
1 |
0 |
0 |
1 |
|
max |
35 |
1 |
1 |
1800000 |
9 |
1 |
1 |
1 |
1 |
For the data preprocessing, since the dataset is clean with no missing values or outliers, it only requires to be modified to solve the problem of class imbalance in the dataset. As shown in Table 2, the ratio of 0 to 1 is near 2:1 in the original dataset for the predicted variable.
The Synthetic Minority Over-Sampling Technique (SMOTE) [18] is a well-known approach to class imbalance issues in a wide range of application domains. Basically, SMOTE enhances the minority class representation by generating new instances based on the similarity between the feature spaces of existing minority instances. The algorithm operates by iteratively going through each minority class instance
Where δ is a random number between 0 and 1, while
|
Original dataset |
Resampled dataset |
|
|
0 |
1277 |
1277 |
|
1 |
710 |
1277 |
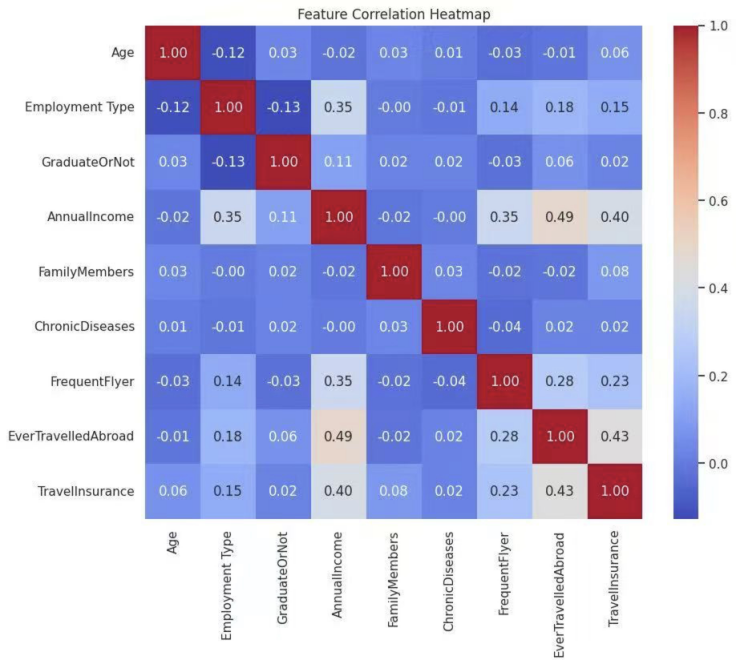
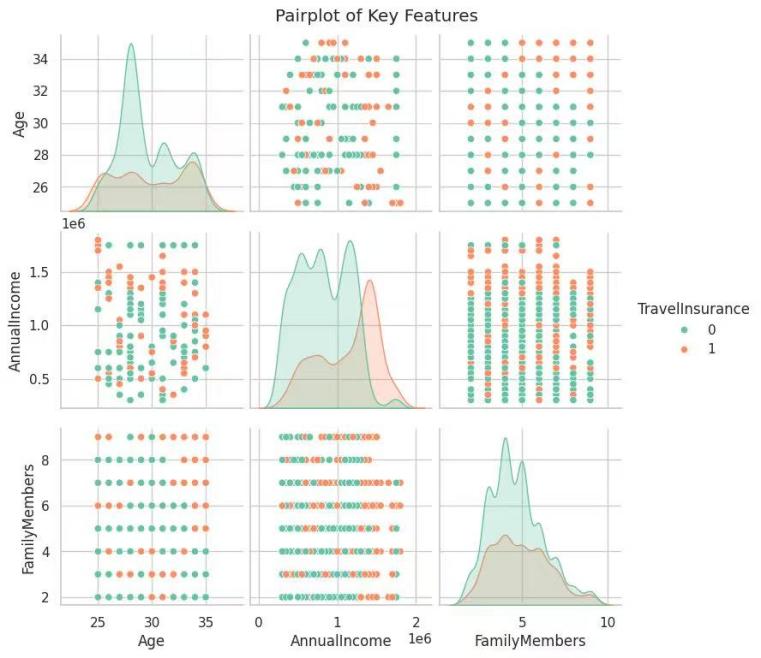
For the data visualization, according to the heatmap (Figure 1), all the correlation coefficients of all the variables are less than 0.5. Additionally, Figure 2 illustrates that there is no linear relationship among any quantitative indicators (Family members, Ages, and Annual incomes), so that it could conclude that there is no multicollinearity among all the indicators. The absence of strong inter-variable correlations ensures the stability of parameter estimates in subsequent classification models and supports the validity of the underlying assumptions required for various machine learning algorithms.
Besides, the histograms for the three quantitative predictors (Family members, Ages, and Annual incomes) were drawn to depict their distribution. Figure 3 demonstrates the number of family members of potential customers. The histogram centers at people with 4 family members, and this distribution is skewed to the right. The potential customers with a family that there are members greater than 5 has an obviously higher probability to purchase insurance, and the probability for them is about 43%, which is greater than the customers with less than or equal to 5 family members by 11% on average.

Moreover, Figure 4 represents the number of ages of potential customers. Obviously, the number of potential customers aged 28 is larger than the other bars in the distribution of potential customers, and people who aged less than 27 and greater than 32 tend to have a higher probability to purchase the insurance.
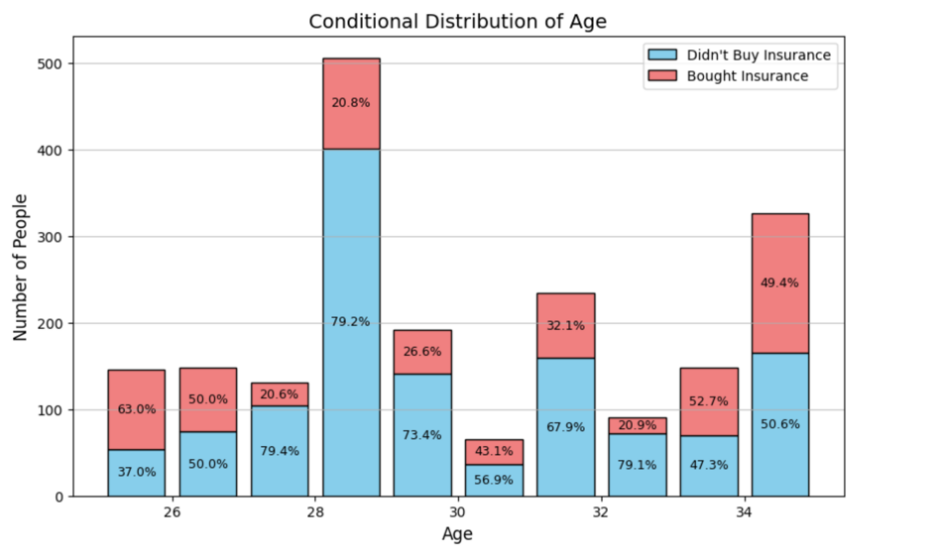
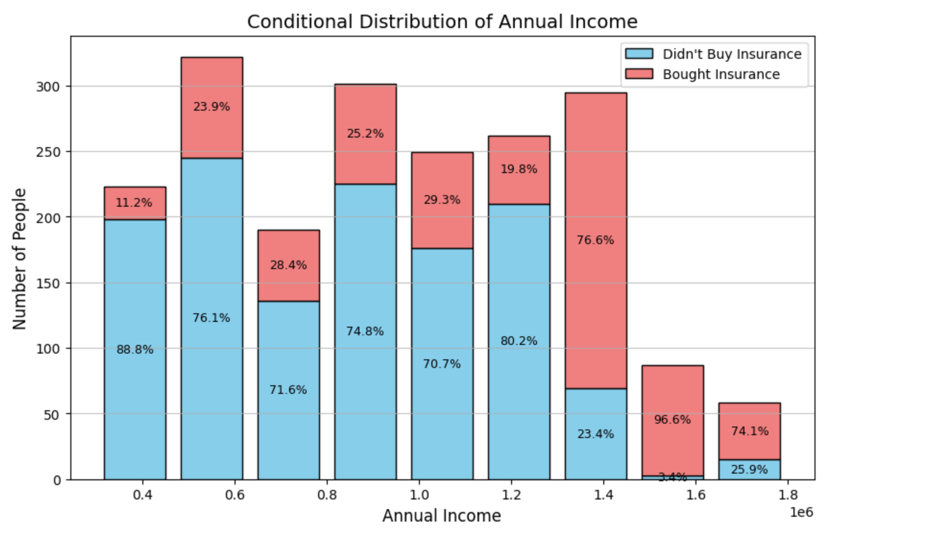
Figure 5 shows the annual incomes of potential customers. There is a high correlation between the income of the potential customers and the proportion of whether they decide to buy. The higher income they have, the higher probability they purchase the travel insurance. The probability increases from less than 10% to greater than 70% for the potential customers who have annual income 300,000 rupees to 1,800,000 rupees.
4. Methodology
Based on the existing research and empirical results, Logistic Regression, Decision Tree models, and Random Forests have always performed better and reliably in the task of classification [18]. With its robust ability to handle the error distribution as well as being easy to implement, logistic regression has been widely used in a variety of fields. The logistic regression model is employed to predict the probability of occurrence of a specific outcome, i.e., F(x), with
Being the basic classification algorithm, the decision tree algorithm [19, 20] constructs its structure by recursively partitioning the dataset into two sub nodes, starting from the root node using the full data. At each partitioning, the best splitter, based on impurity or diversity criteria, such as Gini impurity, bi-partition, least-squares deviation, etc., is selected. The aim is to create subsets that are increasingly homogeneous with respect to the target variable. This study uses the Gini impurity metric, which is particularly suited to classification issues with discrete outcome classes. The Gini value of a node t,
Where i and j denote the distinct classes of the objective variable, the index reaches its maximum value of 1
The Gini-based split criterion for a possible split s at node t is provided by the function Φ
where
Random Forest, which is one of the most sophisticated algorithms among the tree-based ensemble learning methods, is used extensively for classification and regression. The method creates hundreds or thousands of decision trees during training, with the final prediction taken from the consolidation of individual predictions, by majority vote in a classification context and by averaging in a regression context. There are certain factors that contribute to the success of Random Forest, such as its use of bootstrap sampling (bagging) for enhancing model robustness, its use of random feature subsets at each node split to reduce inter-tree correlation, and the creation of an ensemble voting system for combining outputs. Its resistance to overfitting, combined with high-quality predictive performance, makes it suitable for a wide variety of data types and tasks. As an added benefit, Random Forest also naturally provides estimates of feature importance, further augmenting its usefulness and popularity in applied machine learning settings.
The evaluation approach utilized here is an accurate mechanism necessary for confirming the strength and validity of models developed for predicting behavioral outcomes. In this paper, the F1-score and accuracy are utilized as metrics to display a model's performance in outcome prediction. The formulations of the evaluation metrics are outlined in Equations (6), (7), (8), and (9).
5. Experiments
We used the F1-score as the main measure for the classification performance because it balances precision and recall, particularly in cases with significant class imbalance. After applying the SMOTE method and optimizing the models through grid search, we present the performance metrics on the test dataset for the three models below. As shown in Table 3, the optimized Logistic Regression model demonstrated modest classification performance, with F1-scores of 0.71 for class 0 and 0.69 for class 1, along with an overall accuracy of about 0.70. However, as shown in Table 4, the Decision Tree model significantly preceded the Logistic Regression model, achieving F1-scores of 0.89 for both target classes while maintaining a similar level of accuracy. Notably, as shown in Table 5, the Random Forest classifier surpassed both competitors, recording the best results with consistent F1-scores of 0.90 for all classes and an overall accuracy of 0.90. Additionally, on the training dataset, the Best Random Forest Model also showed the highest performance among the three models, holding the same F1-scores and an accuracy of 0.90.
|
Precision |
Recall |
F1-score |
Support |
|
|
0 |
0.66 |
0.77 |
0.71 |
365 |
|
1 |
0.75 |
0.63 |
0.69 |
402 |
|
Accuracy |
0.7 |
767 |
||
|
Macro avg |
0.7 |
0.7 |
0.7 |
767 |
|
Weighted avg |
0.71 |
0.7 |
0.7 |
767 |
|
Precision |
Recall |
F1-score |
Support |
|
|
0 |
0.84 |
0.95 |
0.89 |
365 |
|
1 |
0.95 |
0.84 |
0.89 |
402 |
|
Accuracy |
0.89 |
767 |
||
|
Macro avg |
0.89 |
0.89 |
0.89 |
767 |
|
Weighted avg |
0.9 |
0.89 |
0.89 |
767 |
|
Precision |
Recall |
F1-score |
Support |
|
|
0 |
0.86 |
0.93 |
0.9 |
365 |
|
1 |
0.94 |
0.86 |
0.9 |
402 |
|
Accuracy |
0.9 |
767 |
||
|
Macro avg |
0.9 |
0.9 |
0.9 |
767 |
|
Weighted avg |
0.9 |
0.9 |
0.9 |
767 |
Figure 6 illustrates the Receiver Operating Characteristic (ROC) curves for the Best Models developed using Random Forest, Logistic Regression, and Decision Tree algorithms, which measures classification performance among different thresholds. As shown, the Random Forest model possesses the largest area under the curve (AUC = 0.90), followed closely by the Decision Tree model (AUC = 0.89), while the Logistic Regression model lags with an AUC of 0.70.
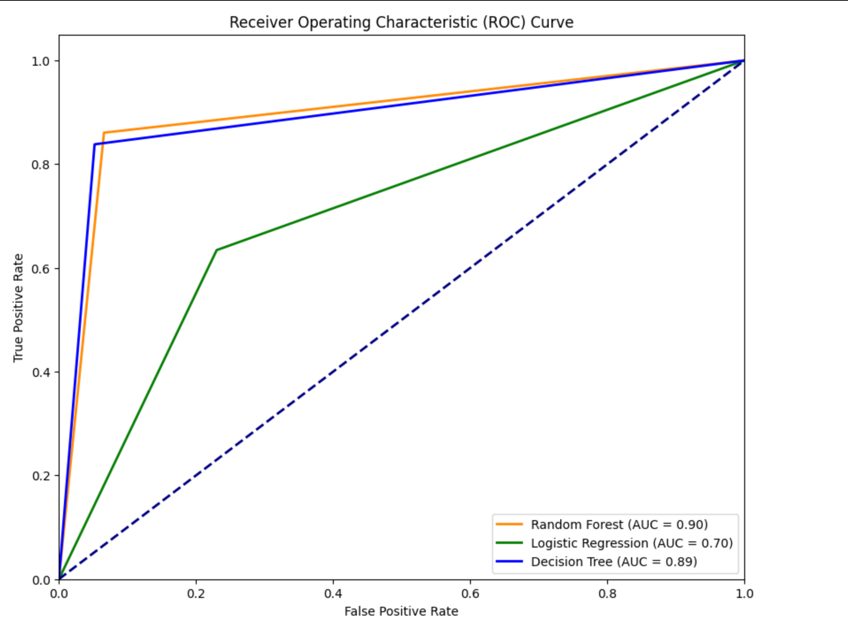
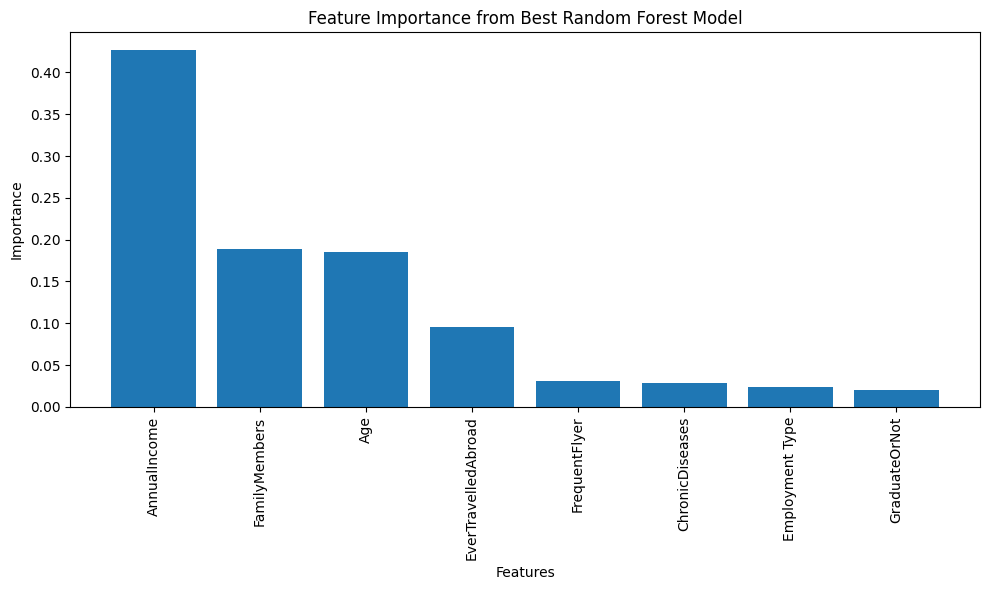
Figure 7 shows the most important features of the Best Random Forest model. Among all input features, Annual Income was the most predictive, with an importance exceeding 0.40, indicating that people with higher incomes might have a higher tendency to invest in travel-related risk coverage. The second and third-ranking features were Family Members and Age, with an importance of approximately 0.19, indicating that family size and demographic profile are also strong determinants of insurance take-up. The fourth-ranking feature, EverTravelledAbroad, with an importance of approximately 0.10, identifies previous international travel experience as a key behavioral indicator, most likely due to increased awareness of potential travel risk and a higher probability of insurance uptake.
6. Conclusion
Overall, three machine learning models, including Logistic Regression, Decision Trees, and Random Forest, have been used in the current study to examine the purchasing behavior for travel insurance. To balance the data contained in the set, the Synthetic Minority Over-Sampling Technique (SMOTE) was utilized, after which the Grid Search Method was employed for the identification of the best-performing model. As a result, the Random Forest model is the most accurate predictive model following the application of the SMOTE and the Grid Search. Furthermore, Annual Income, Family Members, Age, and EverTravelledAbroad are the most important features informing travel insurance purchase predictions, in ranking order. This current study's major contribution is the increase in the predictive usefulness through the employment of the relevant data preprocessing, as well as the stringent validation for the models. Despite this, the present study is plagued by challenges arising from data availability as well as the type of model. Therefore, further studies should be carried out in other study fields for the knowledge on the current object in view to increase comprehensively, though possibly through the application of better techniques or with deep learning techniques.
This research establishes a significant basis for forthcoming inquiries focused on examining consumer behavior in relation to the acquisition of travel insurance. Also, this study applied diverse machine learning techniques to predict trends in the purchasing of travel insurance. In a comparative assessment, the Random Forest algorithm, utilizing SMOTE after Grid Search, demonstrated the highest efficacy for the task among the three models analyzed. To gain a more profound understanding of the determinants influencing buying behavior, the significance of various features was evaluated through the application of the top-performing Random Forest model. The investigation revealed that Annual Income surfaced as the most significant predictor, suggesting that tourists with higher salaries are potentially more inclined to allocate resources toward travel-related risk protection. The subsequent influential factors included Family Members and Age, emphasizing the importance of family composition and demographic elements in shaping insurance purchasing decisions. Furthermore, the fourth-ranked attribute, EverTravelledAbroad, underscores the relevance of prior experiences with international travel, which likely corresponds with an elevated risk perception and a greater inclination to obtain coverage. The primary contribution of this research lies in improving the precision of predictions concerning travel insurance purchases by effectively addressing data imbalance and evaluating multiple classification techniques. Moreover, the comparative results provide valuable insights for future model selection and enhancement. Despite its contributions, the research highlights the necessity for improved feature engineering methods to achieve more robust forecasting outcomes.
The present study is characterized by several limitations, which could potentially guide the development of future research initiatives. Firstly, the analysis is limited to just one dataset consisting of only 1987 observations, making its findings inapplicable on a universal level. Secondly, the models used largely rely on historical information for training, which might limit their flexibility in the highly dynamic market or economic environments. Moreover, the predictive ability of the models largely depends on the input selection and the dataset quality. Specifically, suboptimal selected features or the inclusion of noise in the data can seriously undermine the performance of the models. Finally, the models used (Logistic Regression, Decision Tree, and Random Forest) might not provide much information in unusual conditions, for instance, the introduction of new financial tools or phases with high market volatility. Considering the above, the need to explore further research avenues would need to be addressed with the aim of reaching the full scope of the knowledge on this issue. In future improvements, the models ought to prioritize the combination with more diverse data sources, along with the use of sophisticated techniques, for example, deep learning. It is promising for uncovering complex behavioral patterns and improving the models' capacity to generalize across varied contexts.
References
[1]. UNWTO (2025). UN Tourism World Tourism Barometer | Global Tourism Statistics. [online] www.unwto.org. Available at: https: //www.unwto.org/un-tourism-world-tourism-barometer-data.
[2]. Lepp, A. and Gibson, H. (2008). Sensation seeking and tourism: Tourist role, perception of risk and destination choice. Tourism Management, 29(4), pp.740–750. doi: https: //doi.org/10.1016/j.tourman.2007.08.002.
[3]. Sarman, I., Scagnolari, S. and Maggi, R. (2016). Acceptance of Life-Threatening Hazards among Young Tourists. Journal of Travel Research, 55(8), pp.979–992. doi: https: //doi.org/10.1177/0047287515612595.
[4]. Walters, G., Wallin, A. and Hartley, N. (2018). The Threat of Terrorism and Tourist Choice Behavior. Journal of Travel Research, [online] 58(3), pp.370–382. doi: https: //doi.org/10.1177/0047287518755503.
[5]. Lo, A.S., Cheung, C. and Law, R. (2011). Hong Kong Residents’ Adoption of Risk Reduction Strategies in Leisure Travel. Journal of Travel & Tourism Marketing, 28(3), pp.240–260. doi: https: //doi.org/10.1080/10548408.2011.562851.
[6]. Fuchs, G. and Reichel, A. (2011). An exploratory inquiry into destination risk perceptions and risk reduction strategies of first time vs. repeat visitors to a highly volatile destination. Tourism Management, 32(2), pp.266–276. doi: https: //doi.org/10.1016/j.tourman.2010.01.012.
[7]. Ritchie, B.W., Chien, P.M. and Sharifpour, M. (2016). Segmentation by Travel Related Risks: An Integrated Approach. Journal of Travel & Tourism Marketing, 34(2), pp.274–289. doi: https: //doi.org/10.1080/10548408.2016.1156616.
[8]. Tan, D. and Caponecchia, C. (2020). COVID-19 and the public perception of travel insurance. Annals of Tourism Research, p.103106. doi: https: //doi.org/10.1016/j.annals.2020.103106.
[9]. Doherty, N.A. and Dionne, G. (1993). Insurance with undiversifiable risk: Contract structure and organizational form of insurance firms. Journal of Risk and Uncertainty, 6(2), pp.187–203. doi: https: //doi.org/10.1007/bf01065358.
[10]. Markowitz, H.M. (1976). Portfolio selection : efficient diversification of investments. New Haven ; London: Yale University Press.
[11]. Sarman, I., Curtale, R. and Hajibaba, H. (2019). Drivers of Travel Insurance Purchase. Journal of Travel Research, 59(3), p.004728751984318. doi: https: //doi.org/10.1177/0047287519843187.
[12]. Kai, Y., Zhujun, K., Zhijie, C., Xiaoting, S. and Wanyue, T. (2021). Social learning? Conformity? Or comparison? — An empirical study on the impact of peer effects on Chinese seniors’ intention to purchase travel insurance. Tourism Management Perspectives, 38, p.100809. doi: https: //doi.org/10.1016/j.tmp.2021.100809.
[13]. Lau, J.T.F., Yang, X. and Tsui, H.Y. (2007). Health Services–Seeking Behaviors of People Traveling From Developed Areas—A Case of Hong Kong Residents Visiting Mainland China. Journal of Travel Medicine, 14(4), pp.215–225. doi: https: //doi.org/10.1111/j.1708-8305.2007.00121.x.
[14]. Steffen, R., Rickenbach, M., Wilhelm, U., Helminger, A. and Schar, M. (1987). Health Problems After Travel to Developing Countries. Journal of Infectious Diseases, 156(1), pp.84–91. doi: https: //doi.org/10.1093/infdis/156.1.84.
[15]. Leggat, P.A. and Leggat, F.W. (2006). Knowledge and Acceptance of First Aid and Travel Insurance in Hostelers from North and Central Queensland, Australia. Journal of Travel Medicine, 9(5), pp.269–272. doi: https: //doi.org/10.2310/7060.2002.24129.
[16]. Mitchell, V.-W., Davies, F., Moutinho, L. and Vassos, V. (1999). Using Neural Networks to Understand Service Risk in the Holiday Product. Journal of Business Research, 46(2), pp.167–180. doi: https: //doi.org/10.1016/s0148-2963(98)00020-4.
[17]. www.kaggle.com. (n.d.). Travel Insurance Prediction Data. [online] Available at: https: //www.kaggle.com/datasets/tejashvi14/travel-insurance-prediction-data.
[18]. Wen, Y. (2024). Analysis of Credit Default Prediction Based on Logistic Regression, Random Forest and KNN Model. Advances in Economics Management and Political Sciences, 85(1), pp.161–169. doi: https: //doi.org/10.54254/2754-1169/85/20240868.
[19]. Breiman, L., Friedman, J., Olshen, R.A. and Stone, C.J. (1984). Classification and regression trees. Belmont, Calif. Wadsworth International Group.
[20]. Ture, M., Tokatli, F. and Kurt, I. (2009). Using Kaplan–Meier analysis together with decision tree methods (C& RT, CHAID, QUEST, C4.5 and ID3) in determining recurrence-free survival of breast cancer patients. Expert Systems with Applications, 36(2), pp.2017–2026. doi: https: //doi.org/10.1016/j.eswa.2007.12.002.
Cite this article
Chen,Z.;Lin,H.;Gao,Z. (2025). Purchase Behavior Analysis of Travel Insurance. Advances in Economics, Management and Political Sciences,233,18-30.
Data availability
The datasets used and/or analyzed during the current study will be available from the authors upon reasonable request.
Disclaimer/Publisher's Note
The statements, opinions and data contained in all publications are solely those of the individual author(s) and contributor(s) and not of EWA Publishing and/or the editor(s). EWA Publishing and/or the editor(s) disclaim responsibility for any injury to people or property resulting from any ideas, methods, instructions or products referred to in the content.
About volume
Volume title: Proceedings of ICFTBA 2025 Symposium: Data-Driven Decision Making in Business and Economics
© 2024 by the author(s). Licensee EWA Publishing, Oxford, UK. This article is an open access article distributed under the terms and
conditions of the Creative Commons Attribution (CC BY) license. Authors who
publish this series agree to the following terms:
1. Authors retain copyright and grant the series right of first publication with the work simultaneously licensed under a Creative Commons
Attribution License that allows others to share the work with an acknowledgment of the work's authorship and initial publication in this
series.
2. Authors are able to enter into separate, additional contractual arrangements for the non-exclusive distribution of the series's published
version of the work (e.g., post it to an institutional repository or publish it in a book), with an acknowledgment of its initial
publication in this series.
3. Authors are permitted and encouraged to post their work online (e.g., in institutional repositories or on their website) prior to and
during the submission process, as it can lead to productive exchanges, as well as earlier and greater citation of published work (See
Open access policy for details).
References
[1]. UNWTO (2025). UN Tourism World Tourism Barometer | Global Tourism Statistics. [online] www.unwto.org. Available at: https: //www.unwto.org/un-tourism-world-tourism-barometer-data.
[2]. Lepp, A. and Gibson, H. (2008). Sensation seeking and tourism: Tourist role, perception of risk and destination choice. Tourism Management, 29(4), pp.740–750. doi: https: //doi.org/10.1016/j.tourman.2007.08.002.
[3]. Sarman, I., Scagnolari, S. and Maggi, R. (2016). Acceptance of Life-Threatening Hazards among Young Tourists. Journal of Travel Research, 55(8), pp.979–992. doi: https: //doi.org/10.1177/0047287515612595.
[4]. Walters, G., Wallin, A. and Hartley, N. (2018). The Threat of Terrorism and Tourist Choice Behavior. Journal of Travel Research, [online] 58(3), pp.370–382. doi: https: //doi.org/10.1177/0047287518755503.
[5]. Lo, A.S., Cheung, C. and Law, R. (2011). Hong Kong Residents’ Adoption of Risk Reduction Strategies in Leisure Travel. Journal of Travel & Tourism Marketing, 28(3), pp.240–260. doi: https: //doi.org/10.1080/10548408.2011.562851.
[6]. Fuchs, G. and Reichel, A. (2011). An exploratory inquiry into destination risk perceptions and risk reduction strategies of first time vs. repeat visitors to a highly volatile destination. Tourism Management, 32(2), pp.266–276. doi: https: //doi.org/10.1016/j.tourman.2010.01.012.
[7]. Ritchie, B.W., Chien, P.M. and Sharifpour, M. (2016). Segmentation by Travel Related Risks: An Integrated Approach. Journal of Travel & Tourism Marketing, 34(2), pp.274–289. doi: https: //doi.org/10.1080/10548408.2016.1156616.
[8]. Tan, D. and Caponecchia, C. (2020). COVID-19 and the public perception of travel insurance. Annals of Tourism Research, p.103106. doi: https: //doi.org/10.1016/j.annals.2020.103106.
[9]. Doherty, N.A. and Dionne, G. (1993). Insurance with undiversifiable risk: Contract structure and organizational form of insurance firms. Journal of Risk and Uncertainty, 6(2), pp.187–203. doi: https: //doi.org/10.1007/bf01065358.
[10]. Markowitz, H.M. (1976). Portfolio selection : efficient diversification of investments. New Haven ; London: Yale University Press.
[11]. Sarman, I., Curtale, R. and Hajibaba, H. (2019). Drivers of Travel Insurance Purchase. Journal of Travel Research, 59(3), p.004728751984318. doi: https: //doi.org/10.1177/0047287519843187.
[12]. Kai, Y., Zhujun, K., Zhijie, C., Xiaoting, S. and Wanyue, T. (2021). Social learning? Conformity? Or comparison? — An empirical study on the impact of peer effects on Chinese seniors’ intention to purchase travel insurance. Tourism Management Perspectives, 38, p.100809. doi: https: //doi.org/10.1016/j.tmp.2021.100809.
[13]. Lau, J.T.F., Yang, X. and Tsui, H.Y. (2007). Health Services–Seeking Behaviors of People Traveling From Developed Areas—A Case of Hong Kong Residents Visiting Mainland China. Journal of Travel Medicine, 14(4), pp.215–225. doi: https: //doi.org/10.1111/j.1708-8305.2007.00121.x.
[14]. Steffen, R., Rickenbach, M., Wilhelm, U., Helminger, A. and Schar, M. (1987). Health Problems After Travel to Developing Countries. Journal of Infectious Diseases, 156(1), pp.84–91. doi: https: //doi.org/10.1093/infdis/156.1.84.
[15]. Leggat, P.A. and Leggat, F.W. (2006). Knowledge and Acceptance of First Aid and Travel Insurance in Hostelers from North and Central Queensland, Australia. Journal of Travel Medicine, 9(5), pp.269–272. doi: https: //doi.org/10.2310/7060.2002.24129.
[16]. Mitchell, V.-W., Davies, F., Moutinho, L. and Vassos, V. (1999). Using Neural Networks to Understand Service Risk in the Holiday Product. Journal of Business Research, 46(2), pp.167–180. doi: https: //doi.org/10.1016/s0148-2963(98)00020-4.
[17]. www.kaggle.com. (n.d.). Travel Insurance Prediction Data. [online] Available at: https: //www.kaggle.com/datasets/tejashvi14/travel-insurance-prediction-data.
[18]. Wen, Y. (2024). Analysis of Credit Default Prediction Based on Logistic Regression, Random Forest and KNN Model. Advances in Economics Management and Political Sciences, 85(1), pp.161–169. doi: https: //doi.org/10.54254/2754-1169/85/20240868.
[19]. Breiman, L., Friedman, J., Olshen, R.A. and Stone, C.J. (1984). Classification and regression trees. Belmont, Calif. Wadsworth International Group.
[20]. Ture, M., Tokatli, F. and Kurt, I. (2009). Using Kaplan–Meier analysis together with decision tree methods (C& RT, CHAID, QUEST, C4.5 and ID3) in determining recurrence-free survival of breast cancer patients. Expert Systems with Applications, 36(2), pp.2017–2026. doi: https: //doi.org/10.1016/j.eswa.2007.12.002.