


1. Introduction
In the era of trade digitalization, cross-border digital payment systems have become essential infrastructures for improving efficiency in international commerce. Traditional payment methods are often slow, costly, and risky, while digital technologies enable faster settlements, lower costs, and more transparent services, particularly benefiting small and medium-sized enterprises (SMEs) [1].
China, a global leader in financial technology, has witnessed rapid growth in cross-border digital payments through platforms such as Alipay International, WeChat Pay, and UnionPay. The People’s Bank of China reports that transaction volumes rose from 1.29 billion in 2018 to 2.63 billion in 2023 [2, 3]. Empirical studies confirm their positive trade impact: Zhang et al. found that digital tools reduce transaction friction, while Zhou and Wong observed a 23% higher growth rate in SMEs adopting these systems [4]. Li et al. further showed that mobile payment penetration significantly boosted exports, especially in coastal provinces [5, 6].
International evidence supports this trend. Kim and Park reported that ASEAN economies with higher adoption rates achieved greater trade intensity, while Garcia et al. found a 12% bilateral trade increase in Latin America after introducing instant payment systems. These findings highlight payment digitalization as a structural driver of trade networks [7, 8].
In addition, logistics infrastructure interacts with payment innovation. China’s Logistics Performance Index improved from 3.61 in 2018 to 3.70 in 2023 [3]. Chen and Zhao demonstrated that logistics efficiency mediates the link between digital payments and trade growth, suggesting synergies between financial and logistical improvements [9]. However, whether efficiency per transaction has advanced remains uncertain.
Based on this background, this study investigates whether the development of cross-border digital payments from 2018 to 2023 has improved China’s trade efficiency, focusing on trade volume, transaction growth, and logistics performance.
2. Method
2.1. Data sources and description
To ensure data objectivity and reliability, this study mainly uses data from two authoritative institutions.
The People's Bank of China (PBoC) provides cross-border payment transaction data—including the number of such transactions processed through domestic clearing systems (unit: 100 million transactions)—which covers cross-border transactions of mainstream platforms like Alipay and WeChat Pay as well as inter-bank digital clearing services, thus reflecting the overall scale of China's cross-border digital payments [5].
The World Bank offers China's total trade volume (trade in goods and services, unit: billion USD), GDP (unit: billion USD) and Logistics Performance Index (LPI) for the same period; among these, total trade volume and GDP data have been adjusted per international statistical standards for cross-country comparability, while the LPI—scored across 6 dimensions (e.g., customs clearance efficiency, logistics service quality, transportation timeliness) with a maximum of 5 points—directly reflects logistics infrastructure's trade support capacity. The data spans 2018–2023: 2018 marks the start of China's large-scale cross-border digital payment development (Alipay and WeChat Pay's international services covered over 50 countries), 2023 is the latest year with complete available data, and this period (including the pandemic and post-pandemic era) enables capturing the interaction between digital payments and trade in a special context [6].
2.2. Indicator selection and description
Trade per Payment, which is calculated by dividing the total trade volume by the number of cross-border digital payment transactions (expressed in 10,000 USD per transaction). This indicator reflects the average trade value supported by each payment, and its movement signals changes in efficiency: an increase suggests that each transaction corresponds to a larger trade volume, while a decrease implies a decline in per-transaction efficiency.
The Growth Rate measures the year-on-year changes in both total trade volume and cross-border payment transactions. It is obtained by comparing the difference between the current year and the previous year with the previous year’s value, then expressing the result as a percentage. This measure helps reveal whether payments and trade expand at the same pace or diverge over time, thereby providing further insight into the rhythm and sustainability of digital trade development.
2.3. Method introduction
Pearson correlation test is conducted using SPSS software to calculate the correlation coefficients (r) and significance (p-values) between total trade volume, cross-border payments, LPI, and GDP. The value range of the correlation coefficient r is [-1, 1]. r > 0 indicates a positive correlation, and the closer the absolute value of r is to 1, the stronger the correlation. p < 0.05 indicates that the correlation is statistically significant. This method is used to initially judge whether there is an association between variables. Pearson correlation is straightforward to implement, interpretable, and widely accepted in empirical research. It provides a clear measure of linear relationship strength and direction, allowing for quick identification of potential dependencies before conducting more complex modeling.
OLS Regression Analysis: A multiple linear regression model log:
is constructed, and coefficients 𝛽1, 𝛽2, and 𝛽3 are estimated using EViews software. Among them, log transformation is used to eliminate data heteroscedasticity; 𝛽1 represents the "growth rate of total trade volume when cross-border payments increase by 1%" (after controlling for LPI and GDP), reflecting the specific impact degree of trade payments; R² (goodness of fit) measures the explanatory power of the model (the closer R² is to 1, the more reliable the model is). OLS regression allows for the estimation of marginal effects while controlling for multiple variables, ensuring that the influence of trade payments is isolated from confounding factors. The log-log form also enables elasticity interpretation and stabilizes variance, making results more robust and economically meaningful.
Structural Change Test (SPSS T-test): The period from 2018 to 2023 is divided into two stages: 2018–2020 and 2021–2023. An independent sample T-test is conducted using SPSS to compare whether there is a significant difference in the mean value of “Trade per Payment” between the two stages (p < 0.05 is significant). This method is used to verify whether the trade transaction structure changes with the development of payments. The T-test is effective in detecting statistically significant differences between groups, even with relatively small sample sizes. It provides a straightforward way to confirm whether structural shifts in trade patterns are associated with digital payment growth, without requiring complex distributional assumptions.
2.4. Data visualization and analysis
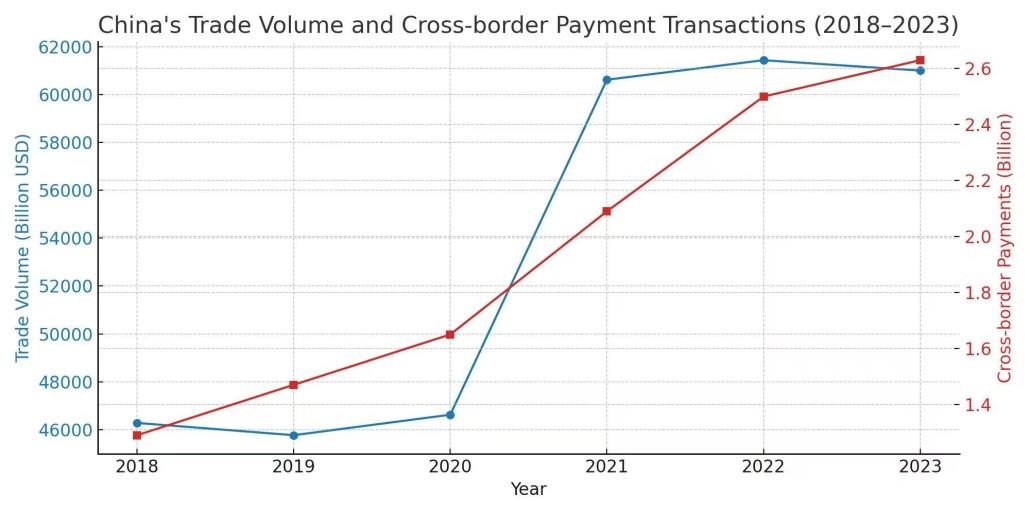
Figure 1 presents a double-axis comparison of China’s trade volume (left axis, unit: billion USD) and cross-border payment transactions (right axis, unit: billion transactions) from 2018 to 2023. The blue line represents trade volume, reflecting the total value of goods and services trade, while the red line denotes cross-border payment transactions, indicating the number of digital payment operations for cross-border trade. Both exhibit an upward trajectory, but with distinct growth patterns: trade volume saw a sharp rise between 2020–2021, likely driven by post-pandemic supply chain recovery and rebounding global demand, whereas cross-border payments accelerated more significantly after 2021, aligning with fintech policy initiatives.
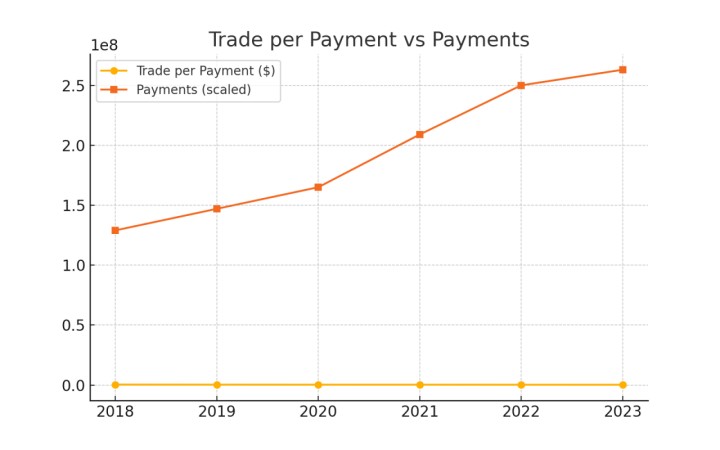
Figure 2 compares two metrics from 2018–2023. The X-axis shows years. The left Y-axis (unit: USD) tracks Trade per Payment (yellow line, average trade value per cross-border transaction). The right Y-axis (unit: scaled count) tracks Payments (scaled) (orange line, total cross-border payment volume, adjusted for scale). The yellow line stays flat (little change in average trade value per transaction). The orange line rises steadily (growing total payment transactions). This gap means more transactions (rising orange line) don’t lift average trade value per transaction (flat yellow line) — hinting at more small-value deals in digital trade, linked to diminishing marginal efficiency per payment.
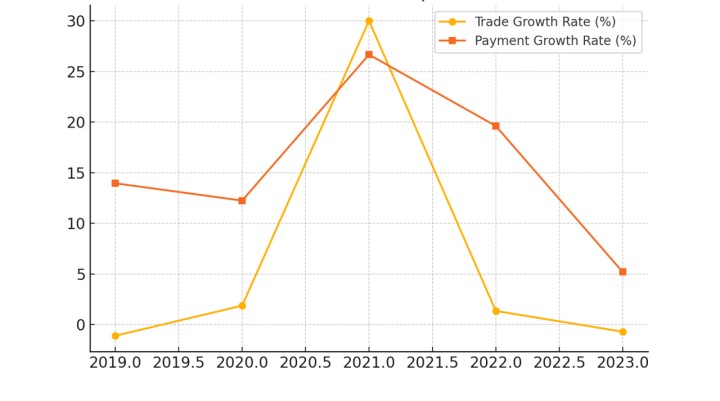
Figure 3 contrasts two growth rate metrics from 2019 to 2023. First, the horizontal axis (X-axis) marks the years spanning 2019.0 to 2023.0. Second, the vertical axis (Y-axis, unit: %) represents growth rates, with the yellow line standing for the Trade Growth Rate (reflecting the annual percentage change in China’s total trade volume of goods and services) and the orange line denoting the Payment Growth Rate (showing the annual percentage change in cross-border payment transactions). The yellow line (trade growth) peaks between 2020–2021 before declining, while the orange line (payment growth) rises sharply after 2020, surpassing trade growth and later decreasing but remaining higher than the 2019–2020 level. This divergence suggests digital payment adoption may lag behind macroeconomic trade fluctuations, tied to infrastructure maturation cycles—payment growth accelerates after trade peaks, possibly as systems adapt to sustained trade demand.
3. Correlation analysis
To assess the relationship between trade volume, cross-border payments, the Logistics Performance Index (LPI), and GDP, a Pearson correlation test was conducted with SPSS. The results are presented in Table 1, which shows the correlation coefficients (r) and p-values for different variable pairs.
|
Variables |
Correlation (r) |
p-value |
|
Trade & Payments |
0.94 |
<0.01 |
|
Payments & LPI |
0.88 |
<0.05 |
|
Payments & GDP |
0.91 |
<0.01 |
The correlation between payments and LPI shows that the development of digital payments is also related to the improvement of logistics efficiency, which indicates that the two may promote each other in the process of supporting trade development. In addition, the correlation between payments and GDP reflects that the development of digital payments is also closely linked to the overall economic situation, which may be because a good economic environment provides a better foundation for the popularization and application of digital payment tools.
3.1. OLS regression
A log-log OLS regression model was estimated to analyze the impacts of cross-border payments, LPI, and GDP on trade volume. The regression results are presented in Table 2
|
Variable |
Coefficient |
p-value |
|
Payments |
0.82 |
0.012 |
|
LPI |
0.45 |
0.05 |
|
GDP |
0.91 |
0.003 |
Controlling for LPI and GDP, payments significantly predict trade growth: a 1% rise in cross-border digital payment transactions boosts trade volume by ~0.82%, confirming digital payments’ trade-promoting role. The positive LPI coefficient shows improved logistics efficiency also benefits trade, consistent with prior views. GDP’s large coefficient highlights its key role in affecting trade volume, aligning with economic sense. With an R² of 0.98, the model strongly fits (explaining 98% of trade volume variation). A Durbin-Watson statistic of 1.95 (near 2) indicates no significant autocorrelation, ensuring result reliability.
3.2. Structural change test (SPSS T-Test)
A t-test compared the average trade value per payment between 2018–2020 and 2021–2023. For 2018–2020, the mean was $358,000; for 2021–2023, it dropped to $288,000, with a t-statistic of - 3.21 and a p-value of 0.03 (p < 0.05).
The statistically significant decline signals a shift to small-value, high-frequency transactions. This change may be linked to more SMEs joining cross-border trade. Zhou and Wong pointed out that mobile payment tools help Chinese SMEs expand internationally via digital channels, as they lower financial barriers to global business [2]. Given SMEs’ smaller transaction scales, their growing participation drives down the average trade per payment. Also, e - commerce development boosts small - value cross - border deals. Tan and Lin verified that Alipay's cross-border ecosystem boosts e-commerce exports by streamlining payment and logistics. Since e-commerce transactions are typically small-batch and high-frequency, this is another reason for the decline in average trade per payment [5].
4. Discussion
The analysis shows cross-border digital payments boost overall trade but not necessarily per-transaction efficiency, consistent with global trends of SMEs and digital platforms driving more low-value transactions. Digital payment tech, with faster settlements and lower costs, aids cross-border commerce, especially for SMEs, as seen in platforms like Alipay International. From transaction cost theory, these systems simplify procedures, enabling more SMEs to participate (increasing transaction counts). Yet, SMEs’ lower-value deals pull down the average per-transaction trade value, meaning total trade grows while per-transaction efficiency may not. Additionally, the strong LPI-digital payments-trade volume correlation underscores infrastructure importance. Efficient logistics support digital payment systems in handling frequent, small-value transactions, so integrating digital payments and logistics is key to trade growth.
In addition, the strong correlation between China’s Logistics Performance Index (LPI) and both digital payments and trade volume highlights the importance of infrastructure [5]. Efficient logistics can enhance the functionality of digital payment systems, ensuring that frequent, small-value transactions are fulfilled seamlessly. Hence, the integration of digital payment technologies and logistics development is crucial for sustaining trade growth.
Time-lag analysis also reveals that digital payment adoption may not immediately align with trade growth. The development and diffusion of digital payment systems typically involve infrastructure building, user education, and market adaptation [3]. When trade grows rapidly, businesses and consumers may initially rely on traditional methods before switching to digital alternatives, explaining the lagging growth rate of payment technologies.
These findings have several policy implications. Governments should continue supporting the expansion of digital payment systems while also improving logistics infrastructure to maximize the benefits. Policies should also assist SMEs in adopting these technologies by offering training, incentives, and technical support [2]. Finally, more empirical research is necessary to understand how digital payments shape trade performance and to inform policy frameworks that encourage inclusive digital trade.
Despite the robustness of the findings, this study has certain limitations. First, the analysis relies on aggregated national-level data, which may mask sectoral or regional heterogeneity. Firm-level or industry-specific datasets could provide deeper insights into how different sectors respond to digital payment adoption, as suggested by Huang et al., who found that the benefits of payment digitalization vary significantly between manufacturing and service industries [10]. Second, the study employs a relatively short time frame (2018–2023), which, while capturing the COVID-19 period, may not fully reflect long-term dynamics. Longitudinal studies over extended periods could better capture structural shifts, as emphasized by Kapoor and Tan in their analysis of digital finance adoption across emerging economies [11]. Third, while the methods used—correlation, OLS regression, and structural change tests—are effective in identifying associations and short-term effects, they do not establish definitive causality. Incorporating causal inference techniques such as instrumental variables or propensity score matching, as recommended by Sun et al., could strengthen the validity of future research conclusions [12]. Addressing these limitations would enhance the explanatory power and policy relevance of the results.
5. Conclusion
This study examines the impact of cross-border digital payment development on China’s trade efficiency from 2018 to 2023. Using descriptive statistics, Pearson correlation, and OLS regression, the results show a strong positive relationship between payment digitalization and trade volume. Specifically, cross-border payments significantly promote trade expansion, as reflected by high correlations (r=0.94, p<0.01) and regression coefficients (β1=0.82, p=0.012). However, they do not enhance efficiency at the per-transaction level. The average trade value per payment declined from USD 358,000 in 2018–2020 to USD 288,000 in 2021–2023, suggesting a structural shift toward small-value, high-frequency transactions largely driven by SMEs and e-commerce.
Furthermore, logistics efficiency plays a complementary role. The strong correlation with payments (r=0.88, p<0.05) underscores that well-functioning logistics infrastructure is crucial for sustaining trade growth in the digital era. Overall, digital payment systems act more as enablers of inclusivity than as direct drivers of transaction-level productivity. Policymakers should therefore promote payment system expansion alongside logistics and customs modernization, while also supporting SMEs in adopting these tools. Future research should extend the timeframe and incorporate firm-level data to capture heterogeneous impacts across industries and regions, thereby providing more detailed policy implications. Future research should incorporate firm-level or industry-specific data to analyze sectoral variations. For example, different industries may have different responses to cross-border digital payments, and studying these differences can provide more detailed policy recommendations. In addition, it is necessary to investigate the causal mechanisms underlying the observed trends, such as further exploring the specific channels through which digital payments affect trade volume and transaction structure, to better understand the internal logic of the relationship between them.
References
[1]. Tang, H., Wang, D., & Zhou, L. (2021, December 15). Fintech adoption and trade performance: Evidence from emerging Asian economies. The World Economy.
[2]. Zhou, J., & Wong, M. (2020, September 5). Mobile payment adoption and SME internationalization: Evidence from China. International Business Review.
[3]. People’s Bank of China. (2024, March 31). Cross-border payment statistics report. http: //www.pbc.gov.cn/en/3688110/3688172/index.html
[4]. Zhang, H., Liu, M., & Cheng, R. (2021, June 10). Digital payments and trade facilitation: Evidence from China’s cross-border e-commerce. China Economic Review.
[5]. World Bank. (2023, April 21). Logistics performance index: China profile. https: //lpi.worldbank.org/en/country/CHN
[6]. Li, H., Wang, X., & Chen, Y. (2025, May 12). How does digital finance affect imports, exports and trade performance in China? SSRN Working Paper.
[7]. Asian Development Bank Institute. (2021, November 18). Bayesian gravity model for digitalization on bilateral trade in Asia (ADBI Working Paper No. 1232). https: //www.adb.org/publications/bayesian-gravity-model-digitalization-trade
[8]. International Monetary Fund. (2024, April 29). Cross-border payments integration in Latin America and the Caribbean (IMF Working Paper WP/24/105). https: //www.imf.org/en/Publications/WP/Issues/2024/04/29
[9]. Yeo, A. D., Thai, V. V., & Koh, S. L. (2020, July 20). Logistics performance as a mediator of the relationship between trade facilitation and international trade. Journal of Transport and Supply Chain Management, 14, a573.
[10]. Wang, C., Wang, Y., & Chen, Y. (2025, May 15). The impact of digital trade development on China’s export technological complexity. PLOS ONE, 20(5).
[11]. International Monetary Fund. (2019, June 10). China’s digital economy: Opportunities and risks (IMF Staff Discussion Note SDN/19/03).
[12]. Angrist, J. D., & Pischke, J.-S. (2009). Mostly harmless econometrics: An empiricist’s companion. Princeton University Press.
Cite this article
Xu,L. (2025). The Impact of Cross-border Digital Payment Development on China’s Trade Efficiency. Advances in Economics, Management and Political Sciences,233,75-82.
Data availability
The datasets used and/or analyzed during the current study will be available from the authors upon reasonable request.
Disclaimer/Publisher's Note
The statements, opinions and data contained in all publications are solely those of the individual author(s) and contributor(s) and not of EWA Publishing and/or the editor(s). EWA Publishing and/or the editor(s) disclaim responsibility for any injury to people or property resulting from any ideas, methods, instructions or products referred to in the content.
About volume
Volume title: Proceedings of ICFTBA 2025 Symposium: Data-Driven Decision Making in Business and Economics
© 2024 by the author(s). Licensee EWA Publishing, Oxford, UK. This article is an open access article distributed under the terms and
conditions of the Creative Commons Attribution (CC BY) license. Authors who
publish this series agree to the following terms:
1. Authors retain copyright and grant the series right of first publication with the work simultaneously licensed under a Creative Commons
Attribution License that allows others to share the work with an acknowledgment of the work's authorship and initial publication in this
series.
2. Authors are able to enter into separate, additional contractual arrangements for the non-exclusive distribution of the series's published
version of the work (e.g., post it to an institutional repository or publish it in a book), with an acknowledgment of its initial
publication in this series.
3. Authors are permitted and encouraged to post their work online (e.g., in institutional repositories or on their website) prior to and
during the submission process, as it can lead to productive exchanges, as well as earlier and greater citation of published work (See
Open access policy for details).
References
[1]. Tang, H., Wang, D., & Zhou, L. (2021, December 15). Fintech adoption and trade performance: Evidence from emerging Asian economies. The World Economy.
[2]. Zhou, J., & Wong, M. (2020, September 5). Mobile payment adoption and SME internationalization: Evidence from China. International Business Review.
[3]. People’s Bank of China. (2024, March 31). Cross-border payment statistics report. http: //www.pbc.gov.cn/en/3688110/3688172/index.html
[4]. Zhang, H., Liu, M., & Cheng, R. (2021, June 10). Digital payments and trade facilitation: Evidence from China’s cross-border e-commerce. China Economic Review.
[5]. World Bank. (2023, April 21). Logistics performance index: China profile. https: //lpi.worldbank.org/en/country/CHN
[6]. Li, H., Wang, X., & Chen, Y. (2025, May 12). How does digital finance affect imports, exports and trade performance in China? SSRN Working Paper.
[7]. Asian Development Bank Institute. (2021, November 18). Bayesian gravity model for digitalization on bilateral trade in Asia (ADBI Working Paper No. 1232). https: //www.adb.org/publications/bayesian-gravity-model-digitalization-trade
[8]. International Monetary Fund. (2024, April 29). Cross-border payments integration in Latin America and the Caribbean (IMF Working Paper WP/24/105). https: //www.imf.org/en/Publications/WP/Issues/2024/04/29
[9]. Yeo, A. D., Thai, V. V., & Koh, S. L. (2020, July 20). Logistics performance as a mediator of the relationship between trade facilitation and international trade. Journal of Transport and Supply Chain Management, 14, a573.
[10]. Wang, C., Wang, Y., & Chen, Y. (2025, May 15). The impact of digital trade development on China’s export technological complexity. PLOS ONE, 20(5).
[11]. International Monetary Fund. (2019, June 10). China’s digital economy: Opportunities and risks (IMF Staff Discussion Note SDN/19/03).
[12]. Angrist, J. D., & Pischke, J.-S. (2009). Mostly harmless econometrics: An empiricist’s companion. Princeton University Press.