


1. Introduction
In the modern financial investment scenarios, Investors apply different approaches of valuation to estimate a company's worth [1]. Among these, The Discounted Cash Flow (DCF) model, a fundamental analysis tool extensively used in business and finance. The DCF model helps investors work out a company's intrinsic value and appraise their investments based on projected future cash - flows [2]. When applying DCF analysis, Investors can take more informed and exact investment decisions [3].
The DCF model is extremely important when it comes to estimating continuing value, a critical component in firm v. Often, the Gordon growth formula is employed to derive this value by projecting free cash flow outside the explicit forecast period [4]. Jennergren (2008) did a detailed examination of the elements that constitute continuing value, with especial emphasis on capital expenditures and tax savings arising from property depreciation, processing plant, and equipment (PPE) [5]. Further enhancing this notion, value driver formulas give a well - structured and consistent framework for estimating continuing value inside the DCF model, augmenting its practicality and reliability in corporate valuation [6].
Actual empirical examinations, for instance, the poll of UK investment analysts by Imam et al. Show that in practice, DCF is regarded as significantly more important than what previous survey evidence had indicated [7]. Moreover, The DCF model is often compared alongside other valuation m. For instance, Lundholm and O’Keefe (2001) compared the DCF and residual income models and concluded that although it cannot be claimed that one model is superior in all aspects. Equity values derived via DCF often show statistically significant divergences from book values, insinuating the need for more accuracy trials [8]. The consonance of assumptions, for instance, the correlation between growth and capital expenditure, is a significant factor having an effect on the reliability of DCF outcomes [9].
This paper exhibits a practical application of the DCF model to figure out the intrinsic value of Apple Inc., one of the biggest companies globally, selected for the reason that its cash flows are relatively stable and predictable [10]. We calculate Apple’s Free Cash Flow to Firm, which are subsequently utilized to estimate the company's present and terminal values [11]. Based on these outcomes, we gauge the intrinsic value of Apple and its commons. To raise the reliability of our valuation, we add sensitivity testing and Monte Carlo simulation to the DCF analysis. Resolving valuation uncertainty and improving the soundness of the results when cash flows are highly predictable [12].
2. The principle and application of DCF model
The DCF model first needs the future free cash flow of the company over a defined period. Then, people can get terminal value of the company by assuming a stable growth rate of the company beyond the forecast period. After deriving the discount rate which people can get based on the calculation of weighted average cost of capital (WACC), we can discount the future free cash flow to present value and sum them to calculate the company’s intrinsic value.
The rationale of our model selection can be shown in three aspects. First, Apple’s financial ratios show low historical volatility, validating mean reversion. Second, we use the mean value of Apple’s financial parameters in our calculation, which can mitigate outlier impact. Third, the 10-year dataset is insufficient for complex models like ARIMA.
2.1. Data collecting and pre-processing
We collect the required parameters (The parameters can be seen in Table 1) and basic data from the official financial report of Apple from 2020 to 2025, Yahoo Finance, Guru Focus, and other official sources.
|
Parameter |
Value |
Source & Validation |
|
Risk-Free Rate |
4.40% |
US 10-Year Treasury Yield (2025-07-28 market consensus) |
|
US 10-Year Treasury Yield (2025-07-28 market consensus) |
US 10-Year Treasury Yield (2025-07-28 market consensus) |
Yahoo Finance 5-Year Monthly Beta (vs. S&P 500) |
|
Market Risk Premium |
Market Risk Premium |
Damodaran Implied ERP (Jan 2025 Update) |
|
Cost of Debt |
4.50% |
Markets Insider Apple Bond YTM |
|
Effective Tax Rate |
15.46% |
GuruFocus Apple 2025 Q2 Report |
|
Equity Value (E) |
$3280B |
Bloomberg Real-Time Market Cap (2025-07-26) |
|
Net Debt (D) |
Net Debt (D) |
Apple 2025 Q2 Report ($98.2B Gross Debt - $28.2B Cash) |
2.2. The calculation of future free cash flow to firm (2025-2029)
With the parameters needed to calculate the FCFF, we use the formula of FCFF to forecast Apple’s free cash flow from 2025 to 2029 and all parameters in the formula is the mean value over 10 years.
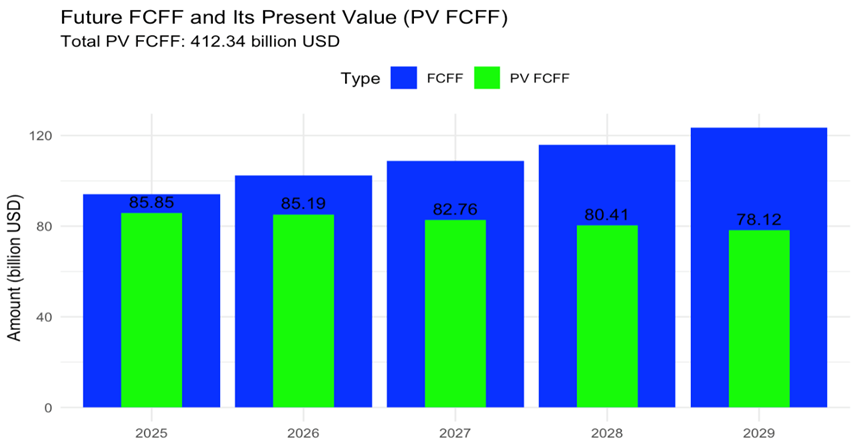
Then, we can get the forecast of FCFF (2025-2029). The precise number is $96.079B, $102.290B, $108.902B, $115.942B, and $123.437B.
2.3. The calculation of weighted average cost of capital
The WACC is the company’s overall cost of capital, representing the average return expected by shareholders and lenders. To derive the WACC, we must introduce another model called capital asset pricing model (CAPM) to calculate an important value in WACC formula — Cost of equity (
With cost of equity, we get the WACC of Apple through WACC formula.
So, the WACC is 9.58%.
2.4. Discounting future cash flows back to present value
Using the discount factor based on WACC, we calculate the present value of future cash flow, and compare it with FCFF. The comparison between FCFF and its present value can be seen in Figure 1.
2.5. Calculation of terminal value
Terminal value is also a very important parameter in DCF model. We calculate the terminal value and discount it to present value.
Final results
After we get all parameters that are required for company’s intrinsic value, we calculate the enterprise value, equity value, and intrinsic value per share as our results of DCF model.
3. Analysis of DCF model results
To estimate the accuracy of our results, we have taken two methods to assess our model: Sensitivity Analysis and Monte Carlo Stimulation, which is two common methods to estimate the results of model.
3.1. The steps of application of DCF model
Sensitivity Analysis tests model output response to changes in key inputs, assessing uncertainty and robustness. We use grid method varying WACC (6%-12%) and g (2-4.5%) to compute EV ranges. The result of sensitivity analysis can be seen in Table 2.
|
g WACC |
2% |
2.5% |
3% |
3.5% |
4% |
4.5% |
|
12% |
1130.7 |
1172.0 |
1217.9 |
1269.1 |
1326.8 |
1392.2 |
|
11% |
1246.5 |
1299.6 |
1359.4 |
1427.2 |
1504.6 |
1594.0 |
|
10% |
1393.5 |
1463.7 |
1544.0 |
1636.7 |
1744.8 |
1872.5 |
|
9% |
1585.3 |
1681.4 |
1793.5 |
1926.0 |
2085.0 |
2279.3 |
|
8% |
1844.4 |
1981.9 |
2146.9 |
2348.5 |
2600.5 |
2924.5 |
|
7% |
2211.7 |
2420.9 |
2682.5 |
3018.8 |
3467.2 |
4095.0 |
|
6% |
2768.4 |
3117.6 |
3583.2 |
4235.0 |
5212.7 |
6824.3 |
By conducting modeling to calculate the average relative change rate:
WACC ±1% (g fixed): ∓17.6%
g ±1% (WACC fixed): ±18.8%
WACC ±1% + g ±1% (same direction): ±1.2%
WACC ±1% + g ∓1% (opposite direction): ∓36.4%
Based on our sensitivity analysis, enterprise value is highly sensitive to WACC and g changes, with baseline EV around $1639B and EV ranges $1131B to $6842B.
Our conclusion based on sensitivity analysis is that WACC dominates downside risk, g drives upside potential, and investors should watch interest rate volatility and growth uncertainty, implying Apple’s current market cap may be overvalued.
3.2. The steps of application of DCF model
Monte Carlo Simulation is a probabilistic method running model multiple times (10000) with random input samples, generating output distributions to quantify uncertainty. Our simulation assume growth ~ Normal (6.46%, 12.19%), WACC ~ Normal (9.58%, 1%), and g ~ Normal (3%, 0.5%). It computes enterprise value per share distributions. The results of Monte Carlo Simulation can be seen in Figure 2.
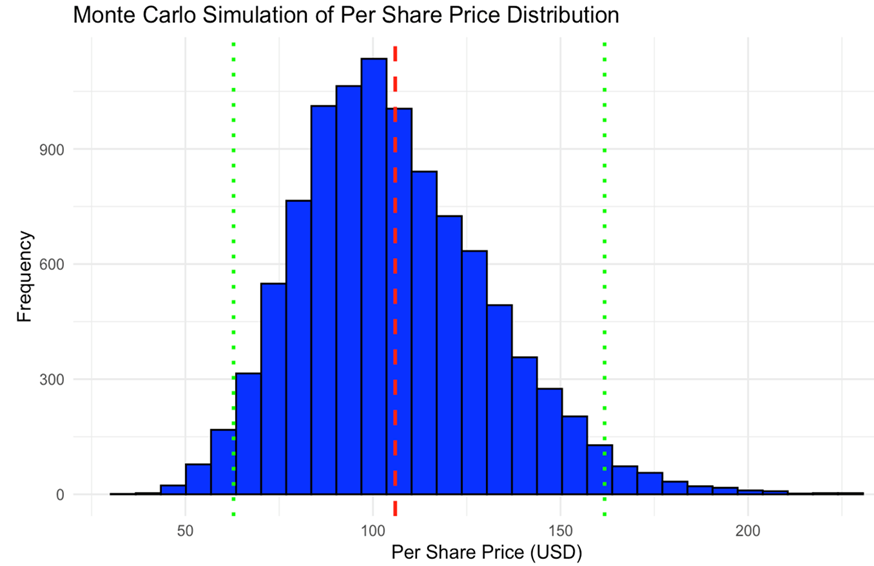
The mean of Monte Carlo Simulation is $105.691(red line), CI is $62.769-$162.873(green line), and SD is $25.493. The distribution is right-skewed (higher downside risk).
4. Conclusion
Based on our overall valuation process, the model uses historical mean reversion for FCFF prediction, 9,58% WACC, yielding Apple’s intrinsic value that is $105 per share, well below market price 214$, implying overvaluation. The sensitivity analysis emphasizes interest rate risk dominates downside. The Monte Carlo simulation is right-skewed, which shows higher downside risk and support conservative valuation and capturing growth/WACC uncertainty. The model is conservative and sensitive to assumptions, monitor macro factors. If the overvaluation can be confirmed through the following estimation, investors should consider selling.
References
[1]. Aho A. Practical Challenges in the Application of the Discounted Cash Flow (DCF) Model [J]. 2025.
[2]. Honková I. Assessment of the DCF method in company valuation [J]. 2017.
[3]. Adamczyk P, Zbroszczyk A. A key factor of the DCF model coherency [J]. Journal of Economics and Management, 2017 (28): 5–22.
[4]. Siegel J J. The application of the DCF methodology for determining the cost of equity capital [J]. Financial Management, 1985: 46–53.
[5]. Jennergren L P. Continuing value in firm valuation by the discounted cash flow model [J]. European journal of operational research, 2008, 185(3): 1548–1563.
[6]. Jennergren L P. Value Driver Formulas for Continuing Value in Firm Valuation by the Discounted Cash Flow Model [J]. The Engineering Economist, 2013, 58(1): 59-70.
[7]. Imam S, Barker R, Clubb C. The use of valuation models by UK investment analysts [J]. European accounting review, 2008, 17(3): 503–535.
[8]. Lundholm R, O'keefe T. Reconciling value estimates from the discounted cash flow model and the residual income model [J]. Contemporary Accounting Research, 2001, 18(2): 311–335.
[9]. Adamczyk P, Zbroszczyk A. A key factor of the DCF model coherency [J]. Journal of Economics and Management, 2017 (28): 5–22.
[10]. Liu X, Shi S. The Application of DCF Model in MCN Evaluation: Case Study of Fengyuzhu Company [C]//Proceedings of the 2022 6th International Conference on E-Business and Internet. 2022: 327–332.
[11]. Jennergren L P. A tutorial on the discounted cash flow model for valuation of companies [J]. SSE/EFI Working paper series in business administration, 2011, 1998(1): 1–55.
[12]. Huang S, Tan H, Wang X, et al. Valuation uncertainty and analysts’ use of DCF models [J]. Review of Accounting studies, 2023, 28(2): 827–861.
Cite this article
Shen,C. (2025). Apple Inc. Valuation Analysis: A DCF Model Approach. Advances in Economics, Management and Political Sciences,240,118-124.
Data availability
The datasets used and/or analyzed during the current study will be available from the authors upon reasonable request.
Disclaimer/Publisher's Note
The statements, opinions and data contained in all publications are solely those of the individual author(s) and contributor(s) and not of EWA Publishing and/or the editor(s). EWA Publishing and/or the editor(s) disclaim responsibility for any injury to people or property resulting from any ideas, methods, instructions or products referred to in the content.
About volume
Volume title: Proceedings of ICFTBA 2025 Symposium: Data-Driven Decision Making in Business and Economics
© 2024 by the author(s). Licensee EWA Publishing, Oxford, UK. This article is an open access article distributed under the terms and
conditions of the Creative Commons Attribution (CC BY) license. Authors who
publish this series agree to the following terms:
1. Authors retain copyright and grant the series right of first publication with the work simultaneously licensed under a Creative Commons
Attribution License that allows others to share the work with an acknowledgment of the work's authorship and initial publication in this
series.
2. Authors are able to enter into separate, additional contractual arrangements for the non-exclusive distribution of the series's published
version of the work (e.g., post it to an institutional repository or publish it in a book), with an acknowledgment of its initial
publication in this series.
3. Authors are permitted and encouraged to post their work online (e.g., in institutional repositories or on their website) prior to and
during the submission process, as it can lead to productive exchanges, as well as earlier and greater citation of published work (See
Open access policy for details).
References
[1]. Aho A. Practical Challenges in the Application of the Discounted Cash Flow (DCF) Model [J]. 2025.
[2]. Honková I. Assessment of the DCF method in company valuation [J]. 2017.
[3]. Adamczyk P, Zbroszczyk A. A key factor of the DCF model coherency [J]. Journal of Economics and Management, 2017 (28): 5–22.
[4]. Siegel J J. The application of the DCF methodology for determining the cost of equity capital [J]. Financial Management, 1985: 46–53.
[5]. Jennergren L P. Continuing value in firm valuation by the discounted cash flow model [J]. European journal of operational research, 2008, 185(3): 1548–1563.
[6]. Jennergren L P. Value Driver Formulas for Continuing Value in Firm Valuation by the Discounted Cash Flow Model [J]. The Engineering Economist, 2013, 58(1): 59-70.
[7]. Imam S, Barker R, Clubb C. The use of valuation models by UK investment analysts [J]. European accounting review, 2008, 17(3): 503–535.
[8]. Lundholm R, O'keefe T. Reconciling value estimates from the discounted cash flow model and the residual income model [J]. Contemporary Accounting Research, 2001, 18(2): 311–335.
[9]. Adamczyk P, Zbroszczyk A. A key factor of the DCF model coherency [J]. Journal of Economics and Management, 2017 (28): 5–22.
[10]. Liu X, Shi S. The Application of DCF Model in MCN Evaluation: Case Study of Fengyuzhu Company [C]//Proceedings of the 2022 6th International Conference on E-Business and Internet. 2022: 327–332.
[11]. Jennergren L P. A tutorial on the discounted cash flow model for valuation of companies [J]. SSE/EFI Working paper series in business administration, 2011, 1998(1): 1–55.
[12]. Huang S, Tan H, Wang X, et al. Valuation uncertainty and analysts’ use of DCF models [J]. Review of Accounting studies, 2023, 28(2): 827–861.