


1. Introduction
Propelled by demand expansion, a demographic dividend, and land-related gains, China sustained rapid growth for nearly forty years [1]. Yet, under a fossil-heavy energy mix and an industry structure skewed toward heavy manufacturing, emissions rose in tandem, imposing significant environmental and health externalities [2]. Amid the worldwide shift toward green and low-carbon development, examining how policy instruments can steer firms toward sustainability has emerged as a central concern for both governments and businesses [3]. As a core component of China's dual carbon strategy, local governments have issued policies related to the New Energy Demonstration City policy (NEDC), taking measures to guide local governments and enterprises to increase new energy investment, driving the overall level of green development. At present, with respect to the relationship between energy policies and firms’ ESG performance, there are few systematic empirical tests in academia, and research on the mechanism by which new energy policies affect corporate ESG performance is particularly scarce.
In existing related studies, some scholars have studied the role of government environmental policies in corporate innovation investment, pollution reduction, and financial performance. Dong et al. used a triple difference model to evaluate the impact of the pilot policy of new energy demonstration cities on carbon lock-in based on A-share listed companies. The findings indicate that, relative to non-pilot regions, highcarbon firms in pilot areas had a statistically significant 1.06percentagepoint reduction in carbon lock-in [4]. Xie et al., based on the super-efficiency slack-based measure–global Malmquist–Luenberger index measurement (SBM-GML), found that the NEDC significantly improved urban green total factor productivity [5]. However, scholarship on how public policies shape firms’ ESG performance remains fragmented. This paper addresses the gap by assessing the effect of the NEDC on companies’ ESG outcomes. and by probing the underlying mechanisms.
The main contribution of this study is to treat the NEDC under a quasi-natural experiment framework to systematically identify the effect of the policy on company ESG metrics. Secondly, to reveal the impact mechanism from the three perspectives of corporate total factor productivity, corporate green innovation, and digital transformation.
2. Research design
2.1. Theoretical analysis and hypothesis
Against the backdrop of the "dual carbon" goals and energy structural transformation, the NEDC, through comprehensive policy tools such as fiscal and tax incentives, demonstration applications and scenario provision, infrastructure and data platform development, and regulatory and information disclosure requirements, reshapes the external constraints and incentives faced by enterprises, thereby influencing their ESG behavior and performance. Based on the Porter hypothesis, institutional pressure theory, and the resource-based perspective, the following logical chain emerges: On the one hand, policies use a "constraint + incentive" mechanism to encourage enterprises to improve environmental compliance and information transparency. On the other hand, by improving factor allocation efficiency, stimulating green technological innovation, and promoting digital management, they enhance enterprises' ability and willingness to implement sustainable practices, thereby systematically improving ESG performance. Accordingly, we posit two hypotheses for empirical testing.
H1: The NEDC improves the overall ESG performance of enterprises.
H2: The NEDC affects enterprise ESG performance through three mechanisms: total factor productivity, green innovation, and digital transformation.
2.2. Model setting
Viewing the NEDC within a quasi-natural experimental setting, this paper utilizes DID to estimate the policy’s influence on green innovation. Compared to simple before-and-after comparisons, DID, under the assumption of parallel trends, can simultaneously eliminate time-invariant unobservable differences between groups and common time shocks. It also controls for long-term firm endowments and macroeconomic fluctuations through individual and time fixed effects, thereby enhancing the effectiveness of causal identification. Based on the principles and design steps of the DID method, we select data from listed companies from 2006 to 2023 as a sample. The treatment group consists of 81 cities, which were the first to implement the NEDC. A dummy variable representing the NEDC is constructed, which is assigned 1 if the firm's location is a policy demonstration zone, and 0 if it is not.
The model settings are as follows:
Where
2.3. Sample selection and data sources
This paper selects 254 Ashare firms from prefecture-level or higher cities during 2006–2023, measures ESG using Bloomberg ratings, merges data from the China City Statistical Yearbook, China Energy Statistical Yearbook, China Economic Net Statistical Database, CSMAR, and WIND, and evaluates the NEDC’s impact on corporate ESG performance [6]. In accordance with common practice, this paper excludes the financial and real estate industries, excludes special treatment, particular transfer, special treatment of delisting risk (ST, PT, *ST) enterprises, and drops data whose debt-to-asset ratios exceed one. To enhance data quality and avoid extreme cases, this paper performs 1% and 99% tailing processing on all control variables. After the above processing, 13,730 samples are finally obtained.
3. Empirical analysis
3.1. Descriptive analysis
Table 1 presents the descriptive statistics. Specifically, the sample includes 13,730 observations. Corporate ESG performance (ESG) shows some fluctuation, but overall, it is at a moderate level. Within the dimensional performance, we can see that corporate social responsibility performance (S) has the highest coefficient of variation, followed by governance performance (G) and environmental performance (E), but overall, there is significant variation. The average value of the dummy variable (did) for the overall enterprise participation in the NEDC is 0.312, indicating that approximately 31.2% of enterprises are affected by this policy. Regarding control variables, enterprise size (scale) has a mean of 23.045 and a standard deviation of 1.375, reflecting the large differences in enterprise size. The logarithm of enterprise age (age) has a mean of 2.453 and a standard deviation of 0.750, indicating that the sample enterprises are mostly mature and established.
|
Variable |
Variable symbol |
Sample size |
Mean |
Standard deviation |
Min |
Max |
|
E performance |
E |
13730 |
29.604 |
10.118 |
11.57 |
60.064 |
|
S performance |
S |
13660 |
10.470 |
14.206 |
0 |
62.066 |
|
G performance |
G |
13719 |
14.353 |
7.992 |
2.57 |
42.11 |
|
ESG performance |
ESG |
13730 |
64.629 |
14.179 |
32.029 |
89.284 |
|
The NEDC Dummy variable |
did |
13730 |
0.312 |
0.463 |
0 |
1 |
|
Fixed asset ratio |
fixratio |
13730 |
0.232 |
0.179 |
0.002 |
0.749 |
|
Chairman–General Manager duality status |
duality |
13730 |
0.201 |
0.401 |
0 |
1 |
|
Enterprise size |
scale |
13730 |
23.045 |
1.375 |
20.129 |
26.872 |
|
Shareholding ratio of institutional investors |
share |
13730 |
0.556 |
0.222 |
0.032 |
0.940 |
|
Whether the auditor is from one of the Big Four accounting firms |
Accounting |
13730 |
0.134 |
0.340 |
0 |
1 |
|
Debt-to-asset ratio |
lev |
13730 |
0.475 |
0.198 |
0.067 |
0.880 |
|
Proportion of independent directors |
indep |
13730 |
0.375 |
0.055 |
0.308 |
0.571 |
|
Proportion of female executives in the top management team |
female |
13728 |
0.146 |
0.157 |
0 |
0.667 |
|
logarithm of enterprise age |
age |
13730 |
2.453 |
0.750 |
0 |
3.401 |
|
Board size of the enterprise |
board |
13730 |
2.182 |
0.205 |
1.609 |
2.708 |
3.2. Benchmark regression
Table 2 shows that, after controlling for covariates, the NEDC (did) significantly improves firms’ ESG performance.
In the NEDC's impact model on the overall ESG score (4), the estimate on “did” is 0.9679, with significance at the 1 percent level, indicating that after the NEDC came into force, the ESG performance of enterprises increased by an average of 0.9679 units. The possible explanation is that the policy may directly promote enterprises' investment and improvement in social contribution affairs by providing incentives such as financial subsidies and tax incentives, thereby enhancing the public image and market competitiveness of enterprises and indirectly promoting enterprises to improve their ESG performance.
Among the controlled variables, the coefficient for scale is 2.0059 and is significant at the 1% level, signifying that company size is positively associated with enhanced ESG performance. This may arise because bigger corporations often have ample resources available for sustainability-related investments. The coefficient for age is significantly negative in the E and S models and significantly positive in the G model. This suggests that established companies are more experienced in corporate governance (G) but may be less agile than emerging companies in environmental (E) and social (S) innovation.
|
Variable |
(1) |
(2) |
(3) |
(4) |
|
E |
S |
G |
ESG |
|
|
did |
1.3337***(5.822) |
1.0131***(7.305) |
0.4945***(3.281) |
0.9679***(7.796) |
|
scale |
2.9178***(25.578) |
1.6606***(24.337) |
1.2652***(15.210) |
2.0059***(31.832) |
|
share |
2.2039***(4.192) |
0.8199**(2.452) |
2.8031***(7.705) |
2.3216***(8.282) |
|
Accounting |
6.3466***(16.116) |
3.0941***(13.599) |
3.8837***(15.106) |
4.4170***(20.927) |
|
lev |
-2.7782***(-4.323) |
-3.8050***(-9.739) |
-1.0809**(-2.414) |
-1.9763***(-5.603) |
|
fixratio |
-0.3836(-0.491) |
-0.2927(-0.594) |
-2.2011***(-3.969) |
-1.2849***(-2.969) |
|
duality |
0.3067(1.158) |
-0.1251(-0.788) |
0.4838***(2.795) |
0.3279**(2.312) |
|
age |
-0.9545***(-5.958) |
-0.9580***(-9.405) |
0.2759**(2.555) |
-0.0497(-0.582) |
|
board |
0.1375(0.232) |
1.3922***(3.869) |
1.0671**(2.518) |
0.8610***(2.644) |
|
indep |
0.5548(0.268) |
3.2065***(2.599) |
7.2225***(4.681) |
3.8520***(3.377) |
|
female |
1.4538**(2.140) |
1.2411***(2.971) |
0.8808**(1.970) |
1.1773***(3.197) |
|
_cons |
-56.3068***(-20.518) |
-25.2677***(-15.244) |
28.3428***(14.379) |
-20.9971***(-13.988) |
|
Industry fixed |
Y |
Y |
Y |
Y |
|
Year fixed |
Y |
Y |
Y |
Y |
|
Sample size |
13640 |
13699 |
13710 |
13710 |
|
adj. R2 |
0.423 |
0.313 |
0.714 |
0.661 |
Note: ***, **, * indicate significance at the 1%, 5%, and 10% statistical levels, respectively; the data in brackets are t-statistics.
3.3. Parallel trend test and dynamic effect analysis
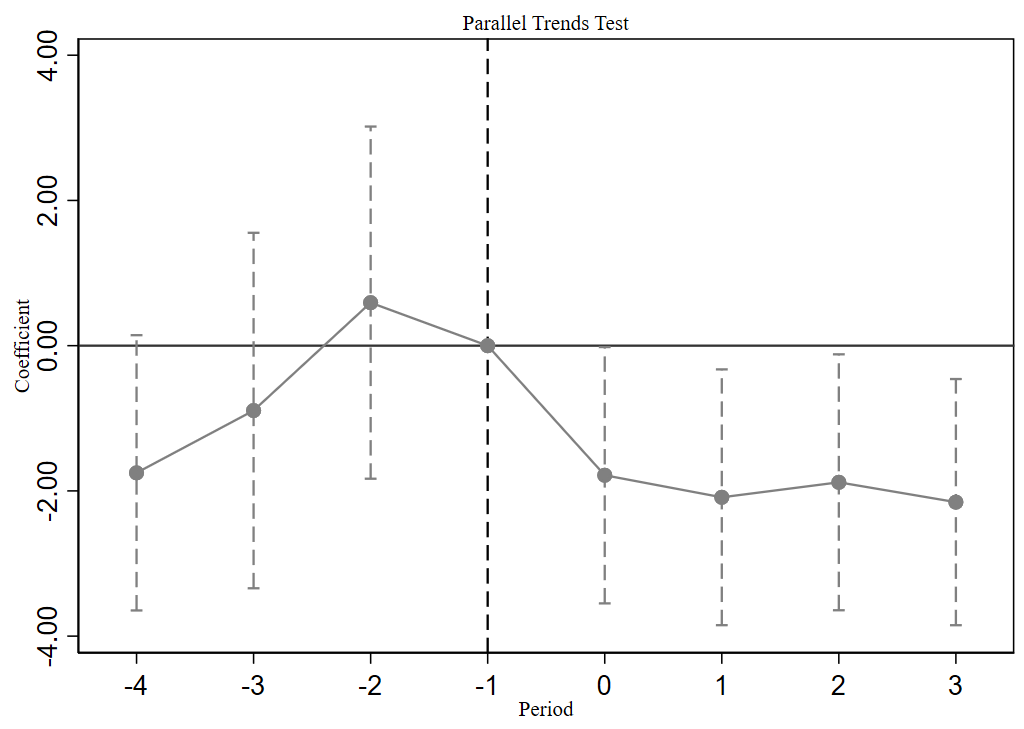
To validate the DID approach, we test whether the treated and control groups display parallel trends before the policy. By introducing interactions of the treatment flag with annual dummy variables, the paper estimates the coefficients. Figure 1 reports the corresponding findings. When constructing the parallel trend model, because the data are unbalanced panel data and 2014 is the starting year of the NEDC, this paper only uses data from the four years before the policy and the four years after its implementation for analysis. Specifically, following the approach of Kudamatsu and Liu, this paper attributes the data from the four years after the policy to the policy opening period to explore the parallel trend of the DID model [7,8].
Figure 1 is a dynamic effect test chart. The results show that before the policy implementation (before period 0), estimates in the pre-policy window are insignificant, indicating that the parallel-trends condition holds; and post-policy coefficients are significant and stabilize thereafter, consistent with DID assumptions and a persistent policy impact.
3.4. Placebo test
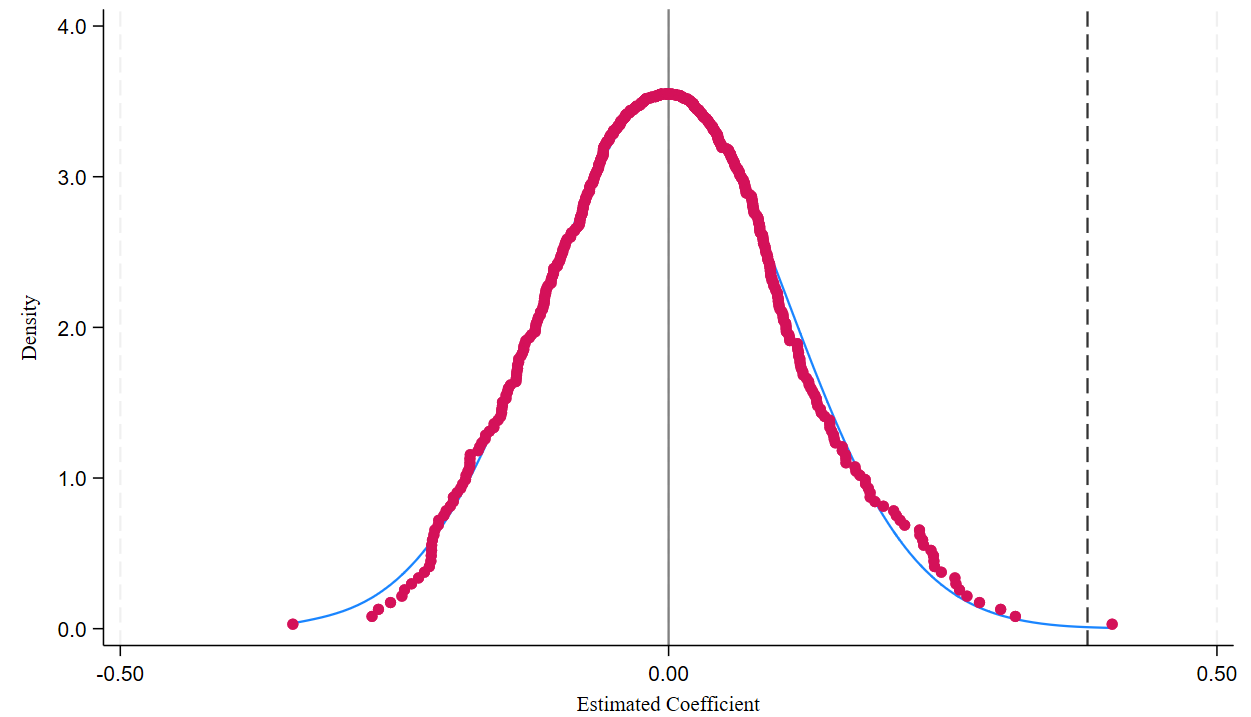
To ensure robust inference by controlling for extraneous factors that are not policy-driven, this paper implemented a placebo test. The procedure randomly allocates observations to treatment and control groups, then reruns the empirical regressions to identify how the NEDC causally influences a firm’s ESG performance. improvements. Specifically, the treatment group is randomly selected from the sample companies, and these randomly selected companies are regarded as companies affected by the energy transition policy, while the leftover samples form the control group and do not face the policy intervention [9]. To enhance credibility, the randomized sampling step is carried out 500 times.
As shown in Figure 2, the simulated estimated coefficients are densely distributed around 0, approximating a normal distribution, consistent with theoretical expectations. The baseline regression’s estimate of the true policy effect (dashed line) appears on the far-right side of the simulation distribution, markedly distant from the bulk of simulated outcomes. This indicates that our core results are significantly different from the placebo effect at the 99% confidence level, providing confidence that the positive effect captured by the baseline regression is indeed due to the new energy policy, rather than other random factors or model misspecification.
3.5. Robustness test
To strengthen confidence in the outcomes, this paper performs multiple robustness assessments, including replacing the explained variables, adding enterprise fixed effects, and excluding municipalities and provincial capitals. The results are shown in Table 3.
Firstly, to avoid measurement errors associated with a single indicator, it uses Huazheng’s ESG rating as an alternative metric to reassess the outcome variable. The analysis confirms that did, as the core factor, stays significantly positive at the 1% significance benchmark, indicating that the results are insensitive to the variable measurement method. Secondly, after controlling for industry and year effects, we further add firm fixed effects to handle individual-specific factors that remain constant across periods. The estimated effect for “did” continues to be highly significant, with a pronounced improvement in the model’s explanatory strength, confirming that the conclusion remains robust after accounting for unobservable factors. Finally, to eliminate interference from the special city sample, it removes the municipalities and provincial capitals and re-estimates the DID coefficient. The “did” coefficient remains significantly positive, and both the sign and the level of significance for other variables remain essentially stable, indicating that the conclusion is universally applicable to general prefecture-level cities. All assessments indicate that the baseline conclusions remain robust.
|
Variables |
(1) |
(2) |
(3) |
|
Replacing the explained variables |
Adding enterprise fixed effects |
Excluding municipalities and provincial capitals |
|
|
did |
0.1334***(7.502) |
1.6959***(3.239) |
1.4243***(8.380) |
|
Fixed variables Industry fixed |
Y Y |
Y Y |
Y Y |
|
Year fixed |
Y |
Y |
Y |
|
Enterprise fixed |
N |
Y |
N |
|
Sample size |
13017 |
13680 |
6598 |
|
adj. R2 |
0.193 |
0.817 |
0.680 |
Note: ***, **, * indicate significance at the 1%, 5%, and 10% statistical levels, respectively; the data in brackets are t-statistics.
To rigorously demonstrate that the core conclusion of this article—that the NEDC's positive effect on ESG performance—is not driven by other relevant policies implemented concurrently, this study gradually controlled for three potentially confounding key environmental and urban policies: Carbon Emissions Trading, the Environmental “fee-to-tax” policy, and the smart city pilot program. Table 4 reports the corresponding findings.
It finds that even after incorporating these competing policy variables individually and simultaneously, for the core explanatory variable “did”, the coefficient estimate is still significant at the one-percent threshold with high magnitude. This result strongly suggests that even when combined with multiple important environmental and economic policies, the NEDC's impact on corporate ESG performance remains significant, demonstrating that its policy effects possess unique and irreplaceable explanatory power.
|
Variables |
(1) |
(2) |
(3) |
(4) |
|
ESG |
ESG |
ESG |
ESG |
|
|
did |
1.0073***(8.098) |
0.9638***(7.769) |
0.9177***(6.871) |
0.8604***(6.416) |
|
Carbon Emissions Trading |
0.5481***(4.678) |
0.4898***(3.854) |
||
|
Environmental “fee-to-tax” policy |
0.3855***(3.376) |
0.3400***(2.637) |
||
|
Smart city pilot program |
-0.1241(-1.042) |
-0.3440***(-2.718) |
||
|
Fixed variables Industry fixed |
Y Y |
Y Y |
Y Y |
Y Y |
|
Year fixed |
Y |
Y |
Y |
Y |
|
Sample size |
13710 |
13710 |
13710 |
13710 |
|
adj. R2 |
0.661 |
0.661 |
0.661 |
0.661 |
Note: ***, **, * indicate significance at the 1%, 5%, and 10% statistical levels, respectively; the data in brackets are t-statistics.
3.6. Mechanism verification
To conduct an in-depth examination of the mechanism through which NEDC affects ESG performance, we conducted an empirical test on three intermediary channels: total factor productivity, green innovation (measured by green patents, etc.), and digital transformation [10]. Table 5 reports the corresponding findings.
Table 5 indicates that the estimated values of “did” for all three channels are all significant to some extent, which shows that the policy significantly improves total factor productivity (TFP), demonstrating that it enhances operational efficiency through technological spillovers and optimized resource allocation, laying the resource foundation for ESG investment. Furthermore, policy significantly promotes green innovation, driving corporate green technology research and development, which directly translates into improved environmental performance. Furthermore, policy also strongly drives corporate digital transformation, empowering enterprises to improve energy management and governance efficiency through digital technologies, and systematically enhancing ESG management effectiveness.
The results show that NEDC works together to improve the ESG performance of enterprises through three mechanisms: efficiency improvement, innovation incentives, and digital empowerment.
|
Variable |
(1) |
(2) |
(3) |
|
Total factor productivity |
Green innovation |
Digital transformation |
|
|
did |
0.0277**(2.535) |
0.0344*(1.793) |
0.0713***(3.670) |
|
Fixed variables Industry fixed |
Y Y |
Y Y |
Y Y |
|
Year fixed |
Y |
Y |
Y |
|
Sample size |
13050 |
13727 |
13624 |
|
adj. R2 |
0.766 |
0.512 |
0.541 |
Note: ***, **, * indicate significance at the 1%, 5%, and 10% statistical levels, respectively; the data in brackets are t-statistics.
4. Conclusion
The essential conclusions of the paper are as follows:
The NEDC has a significant impact on corporate ESG performance. Policy implementation has significantly increased corporate ESG scores on average, with consistent positive effects over three dimensions of ESG, confirming the positive role of energy transition policies in promoting corporate sustainability practices.
Secondly, mechanistic analysis reveals that policies primarily impact ESG performance through three channels: improving corporate total factor productivity, stimulating green innovation, and promoting digital transformation. This demonstrates that policies not only create external constraints and incentives but also promote corporate ESG development at multiple levels and through multiple pathways by stimulating internal efficiency improvements, technological innovation, and management upgrades.
Given the above results, the paper sets out a series of policy prescriptions. Firstly, policy pilots should be expanded and support deepened, further expanding the scope NEDC to promote comprehensive optimization of ESG practices. Secondly, the government can strengthen support for green innovation and digital transformation, leveraging technological spillovers and efficiency gains to build internal momentum for ESG improvements.
References
[1]. Xu, Y., Dong, B., Chen, Y., & Qin, H. (2021). Effect of industrial transfer on carbon lock-in: a spatial econometric analysis of Chinese cities. Journal of Environmental Planning and Management, 65(6), 1024–1055.
[2]. Ma, X. J., C. X. Wang, B. Y. Dong, G. C. Gu, R. M. Chen, Y. F. Li, H. F. Zou, W. F. Zhang, and Q. N. Li. (2019). Carbon Emissions from Energy Consumption in China: Its Measurement and Driving Factors. Science of the Total Environment 648: 1411–1420.
[3]. Porter, M. E., & van der Linde, C. (1995). Toward a new conception of the environment-competitiveness relationship. Journal of Economic Perspectives, 9(4), 97–118.
[4]. Dong, K., Zhao, C., & Dong, X. (2025). Impact of China's new energy demonstration city policy on corporate carbon lock-in (in Chinese). China Population, Resources and Environment, 35(2), 41–54.
[5]. Xie, D., & Wang, L. (2025). Energy transition policies and the improvement of urban green total factor productivity: A quasi-natural experiment based on the New Energy Demonstration City pilot policy (in Chinese). Journal of Industrial Technological Economics, 44(8), 107–117.
[6]. Fang, Z., Luo, Q., Ye, K., & Zhao, X. (2023). Environmental regulation, green innovation, and ESG performance: Evidence from Chinese listed companies. Journal of Cleaner Production, 395, 136320
[7]. Kudamatsu, M. (2012). Has democratization reduced infant mortality in sub-Saharan Africa? Evidence from microdata. Journal of the European Economic Association, 10(6), 1294–1317.
[8]. Liu, Z., Tang, Q., & Wang, J. (2019). The impact of environmental regulation on green total factor productivity: Evidence from China’s environmental protection tax pilot. Journal of Cleaner Production, 214, 728–736.
[9]. Li, Y., Cheng, H., & Ni, C. (2023). Energy transition policy and urban green innovation vitality: a quasi⁃natural experiment based on the new energy demonstration city policy (in Chinese). China population, resources and environment, 33(1), 137–149.
[10]. Peng P, Sun M. (2024). Government subsidies and corporate environmental, social and governance performance: Evidence from companies of China. International Studies of Economics, 19(3): 374-405.
Cite this article
Xu,Z. (2025). Enhancing Corporate ESG Performance Through Policy Pilots — A Quasi-Natural Experiment and Mechanism Analysis Based on New Energy Demonstration Cities. Advances in Economics, Management and Political Sciences,239,76-85.
Data availability
The datasets used and/or analyzed during the current study will be available from the authors upon reasonable request.
Disclaimer/Publisher's Note
The statements, opinions and data contained in all publications are solely those of the individual author(s) and contributor(s) and not of EWA Publishing and/or the editor(s). EWA Publishing and/or the editor(s) disclaim responsibility for any injury to people or property resulting from any ideas, methods, instructions or products referred to in the content.
About volume
Volume title: Proceedings of ICFTBA 2025 Symposium: Data-Driven Decision Making in Business and Economics
© 2024 by the author(s). Licensee EWA Publishing, Oxford, UK. This article is an open access article distributed under the terms and
conditions of the Creative Commons Attribution (CC BY) license. Authors who
publish this series agree to the following terms:
1. Authors retain copyright and grant the series right of first publication with the work simultaneously licensed under a Creative Commons
Attribution License that allows others to share the work with an acknowledgment of the work's authorship and initial publication in this
series.
2. Authors are able to enter into separate, additional contractual arrangements for the non-exclusive distribution of the series's published
version of the work (e.g., post it to an institutional repository or publish it in a book), with an acknowledgment of its initial
publication in this series.
3. Authors are permitted and encouraged to post their work online (e.g., in institutional repositories or on their website) prior to and
during the submission process, as it can lead to productive exchanges, as well as earlier and greater citation of published work (See
Open access policy for details).
References
[1]. Xu, Y., Dong, B., Chen, Y., & Qin, H. (2021). Effect of industrial transfer on carbon lock-in: a spatial econometric analysis of Chinese cities. Journal of Environmental Planning and Management, 65(6), 1024–1055.
[2]. Ma, X. J., C. X. Wang, B. Y. Dong, G. C. Gu, R. M. Chen, Y. F. Li, H. F. Zou, W. F. Zhang, and Q. N. Li. (2019). Carbon Emissions from Energy Consumption in China: Its Measurement and Driving Factors. Science of the Total Environment 648: 1411–1420.
[3]. Porter, M. E., & van der Linde, C. (1995). Toward a new conception of the environment-competitiveness relationship. Journal of Economic Perspectives, 9(4), 97–118.
[4]. Dong, K., Zhao, C., & Dong, X. (2025). Impact of China's new energy demonstration city policy on corporate carbon lock-in (in Chinese). China Population, Resources and Environment, 35(2), 41–54.
[5]. Xie, D., & Wang, L. (2025). Energy transition policies and the improvement of urban green total factor productivity: A quasi-natural experiment based on the New Energy Demonstration City pilot policy (in Chinese). Journal of Industrial Technological Economics, 44(8), 107–117.
[6]. Fang, Z., Luo, Q., Ye, K., & Zhao, X. (2023). Environmental regulation, green innovation, and ESG performance: Evidence from Chinese listed companies. Journal of Cleaner Production, 395, 136320
[7]. Kudamatsu, M. (2012). Has democratization reduced infant mortality in sub-Saharan Africa? Evidence from microdata. Journal of the European Economic Association, 10(6), 1294–1317.
[8]. Liu, Z., Tang, Q., & Wang, J. (2019). The impact of environmental regulation on green total factor productivity: Evidence from China’s environmental protection tax pilot. Journal of Cleaner Production, 214, 728–736.
[9]. Li, Y., Cheng, H., & Ni, C. (2023). Energy transition policy and urban green innovation vitality: a quasi⁃natural experiment based on the new energy demonstration city policy (in Chinese). China population, resources and environment, 33(1), 137–149.
[10]. Peng P, Sun M. (2024). Government subsidies and corporate environmental, social and governance performance: Evidence from companies of China. International Studies of Economics, 19(3): 374-405.