


1. Introduction
1.1. Matters of Financial Statements
Recent decades have witnessed a boom in publicly traded companies all around the world. It has been a common phenomenon that more and more fierce competitions occur among firms with similar industries. One of the most crucial goals for outperformance over the competition is to attract investors. Since investors would like to make decisions of whether to invest their money to become one of the shareholders or not based on analyzing various financial ratios from firms’ financial statements. In contemporary society, the federal government has aggressively increased interest rates since the beginning of 2022 in order to deal with inflation, that is, the increasing price of consumer goods, which causes a big trend: people all around the world tend to save more money in banks. Thus, it is wise for publicly traded companies to seize this opportunity to attract more investors for raising equity purposes. Some popular financial ratios to reflect how the firm performs could be Return On Asset (ROA), Return On Equity (ROE), which basically measures how efficiently the firm utilizes investor’s money to generate sales; Earnings Before Interest, Taxes, Depreciation & Amortization margin (EBITDA Margin) simply indicates the performance of a firm’s operating profits as a percentage of sales revenue. There are more than ten ratios to measure the performance of firms from different aspects, but it is not necessary to understand all of them respectively. What all have to be aware of here is to know that financial ratios are an important component of whether companies are able to attract investors. Further, the calculation of these ratios is based on companies’ four financial statements: income statement, balance sheet, statement of shareholder’s equity, and cash flow statement. Specific descriptions and how they matter in our experiment will be introduced later.
1.2. Quality of Accounting Disclosure
After companies initially sell their shares to the public (IPO), they are required to disclose their accounting information as much as possible, including publishing their accounting information on their annual reports (Form-10K), quarter reports (Form-8K), and press releases (the accounting information that matters to investors should be reported). This information is supervised by the U.S Securities and Exchange Commission (SEC), which is a kind of agency that unify accounting rules for all publicly traded companies. Importantly, as long as the companies’ stock is traded in the U.S. stock market, no matter their locations, they need to follow the rules of the SEC. Not surprisingly, the number of Chinese companies listed in the U.S. stock market is not small, and they have to disclose their accounting information the same as U.S. companies do. Similarly, large numbers of U.S publicly traded companies are located in China. All of these companies should follow the same rules set by the SEC as outlined above, which indicates that the extent of exposing accounting information from their financial statements should be the same. However, the debate over whether the accounting quality of Chinese companies listed in the U.S. stock market is similar to the U.S. publicly traded companies has been growing in intensity. Some people argue that Chinese companies listed in the U.S stock market always disclose the same extent accounting information as the U.S publicly traded companies because their order of constructing each financial statement is the same, while others claim that even though they follow the same accounting rules to report their financial statements, it is difficult to unify the accounting quality because managers from these two countries choose different ways to record accounting information as long as their ways are permitted by the SEC, such as the way of calculating inventory, costs of goods sold, and depreciation expenses. This paper will statistically examine and compare the accounting quality of these two groups of companies, using M-score as the cornerstone to finding their extent of accounting disclosure and then utilizing T-Test and hypothesis testing to find out the exact difference in their accounting quality. We hypothesize that there is a significant difference between the M-score of U.S. listed Chinese companies and U.S. companies.
2. Background
2.1. Overview of Factors Influencing Disclosure
It is generally considered the information disclosure condition in the US capital market is much better than the Chinese. Although the supervision regulations emphasize impartiality, transparency, and law authority, the difference between Chinese and the US capital markets is still obvious [1]. The contrast can be shown in Table 1 below. These differences directly lead to different disclosure results.
Table 1: Comparison between Chinese and the US capital markets.
| Chinese capital market | The US capital market | |
Self-regulating mechanism of securities demand and supply | -Approval system for IPO: more moral hazard and rent-seeking -Lack of delisting mechanism | -Registration system for IPO: more efficient -More delisting mechanism | |
Information disclosure system accounting principles | Similar (discussed below in the “difference between Chinese and the US GAAP”) | ||
Information disclosure obligation | Lack of enough information in listed company announcement reports | More detailed regulations about information content including operation risks, management and acquisition process | |
short selling mechanism | Lack | Various | |
Supervision and punishment | -CSRC(Chinese Security Regulation Commission) Supervision defect -Lack of punishment for disclosure regulation violation and insider trade | Strict supervision of SEC(Securities and Exchange Commission) -Serious punishment for violation and insider trade | |
Investors | Dominated by retail investor lack of rational judgment for securities information | Mainly consists of institutional investors with abundant investment knowledge about information | |
2.2. Condition of Information Disclosure in China
Figure 1 presents the results of information disclosure assessment by Shanghai stock exchange and Shenzhen stock exchange in 2017. There are 663 Grade-A (Excellent) companies, which account for 20% of all A-share companies; 2,070 Grade-B (Good) companies, which account for 64%; 435 Grade-C (Pass) companies, which account for 13%, and 82 Grade-D (Fail) companies, which account for 3%. With only 16% of A-share companies demonstrating flaws or non-compliance in this area, it indicates that the majority of A-share companies have complied with rules and regulations surrounding information disclosure.
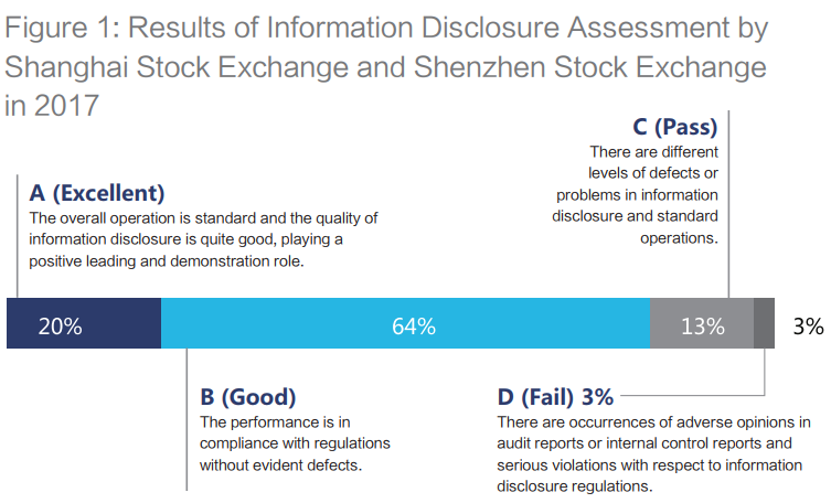
Figure 1: Results of information disclosure assessment by Shanghai stock exchange and Shenzhen stock exchange in 2017.
Information is disclosed by the listed-company announcement, CSRC figures, and Security analysts' reports. From 2013 to 2017, companies with disclosure violations or earnings restatement constituted a significant portion of the listed companies in the Chinese capital market [2]. Figure 2 shows the proportion of companies involved in information disclosure violations.
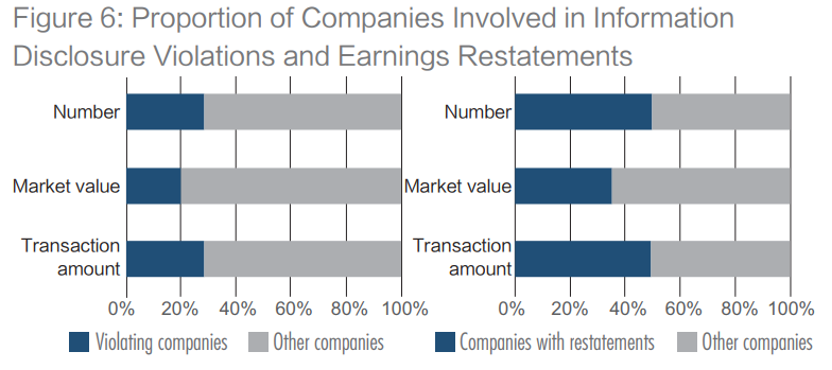
Figure 2: Proportion of companies involved in information disclosure violations and earnings restatements.
According to figure 3, the reason of illegal and dishonest behaviors in China’s capital market is as follows: low cost of illegal behaviors(55%), incomplete legal systems(32%), the corporate pursuit of short-term interest(28%), insufficient regulations(17%), management’s lack of integrity awareness(18%), deficient corporate government structure(10%) [2].
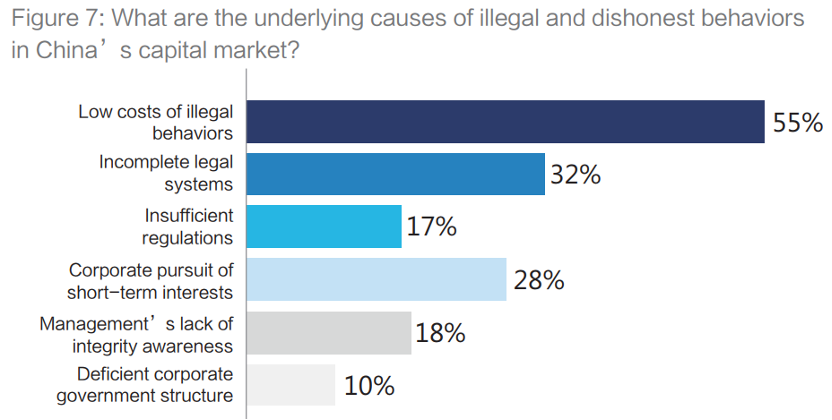
Figure 3: What are the underlying causes of illegal and dishonest behaviors in China’s capital market?
Figure 4 indicates the most common means including inflating income(30%), overestimating assets(15%), understating cost(14%), related party transactions(14%), change in accounting policies and estimation(8%), asset restructuring(8%) and underestimating liabilities(5%) [2].
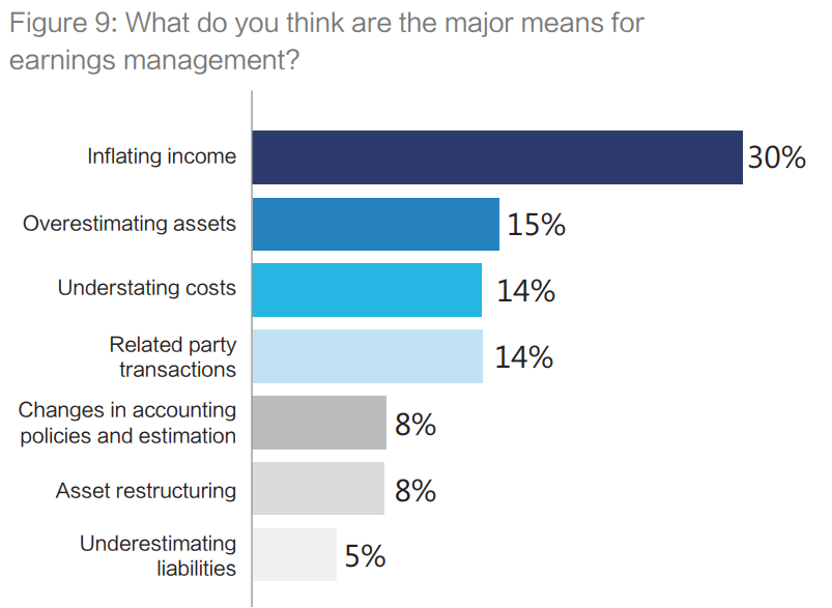
Figure 4: What do you think are the major means for earnings management?
2.3. Current Disclosure Status of Chinese Companies Now Listed in the U.S.
The Holding Foreign Companies Accountable Act (the "HFCAA"), which was signed into law by the then-US president Donald J. Trump in December 2020, requires the US-listed China-based companies (also known as "Chinese Listcos") to annually meet specific additional disclosure requirements to demonstrate that they are not owned or controlled by a government entity. The corporation could be barred from the exchange by NYSE or NASDAQ if the Public Company Accounting Oversight Board (the "PCAOB") decides it cannot examine or probe thoroughly. If an issuer's prolonged listing causes public concern and it is unable to submit sufficient reports for three years in a row, it will be delisted. On August 26th, 2022, the CSRC announced a cooperation agreement with PCAOB(Public Company Accounting Oversight Board) on how to carry out cross-border audit supervision and share audit working papers. The audit working paper that PCAOB must review will be retrieved and provided with the assistance of the Chinese regulatory agency.
3. Literature Review
The quality of accounting information is one of the most important studies in the accounting literature [3]. Higher accounting quality in financial reporting will be accompanied by higher conservatism and less information asymmetry [4]. Companies with high accounting quality will be expected to provide verifiable information to stakeholders in their reported disclosures about losses, financial failures, and other adverse financial events affecting the company's performance as described in the financial accounts. Higher accounting quality is expected to lead to higher levels of investor confidence and easier access to equity and debt capital [5]. In a related study by Francis and Wang [6], the study result suggests that companies with high-quality accounting disclosures tend to be larger, more visible in the marketplace and more profitable and liquid. Their capital requirements and financial obligations drive them to prepare higher quality financial statements. High-quality financial statements are important to a company's growth. Companies that experience management changes and/or audits by Big 4 auditors tend to report high quality accounting information. The quality of such reviews and disclosures is rigorous. In addition, companies with high-quality accounting statements can identify material losses earlier than companies with low-quality financial statements. This is because high-quality financial information provides more detailed judgments about a company's operations; low-quality accounting statements will misjudge a company's decisions and prevent shareholders from making accurate judgments about a company's operations. This study found that conditional robustness is positively related to accounting quality. Companies with high-quality disclosures exhibit more conditional conservatism and less unconditional conservatism than companies with low-quality disclosures. This would further increase the strength and value of accounting information reported by these companies. Theoretical studies on the negative relationship between the level of disclosure and the cost of equity capital suggest that more disclosure enhances stock market liquidity, thereby reducing the cost of equity capital by reducing transaction costs or increasing the demand for the firm's securities [7]. More disclosure reduces the estimation risk associated with investors' estimates of the parameters of asset returns or return distributions. When there is less information, there is greater uncertainty about the "true" parameters. Clarkson, Guedes, and Thompson provide that the quality of disclosure is also important [8]. At the same time, when companies are followed by a large number of analysts and may use these analysts to communicate with the market, measures of disclosure levels are limited to the disclosures provided in the annual report and may not provide a strong proxy for the overall level of disclosure. However, for companies with fewer analysts, the measurement error due to the limited scope of disclosure measures should be less severe because the annual report plays a greater role in the communication process [9]. Management's concerns about disclosing sensitive information to competitors and concerns about the beginning of an untenable disclosure precedent limit voluntary disclosure [10]. Firm's cost of capital is significantly affected by voluntary disclosure. While early studies in the field treated disclosure as exogenous, studies in recent years have explicitly acknowledged the endogenous nature of disclosure decisions [9]. The instrumental variables (IV) approach is commonly used in accounting studies when the regression variables are endogenous, such as corporate governance and disclosure studies. The application and results of IV to the determinants of the cost of capital vary from study to study. In the study by Brown and Hillegeist [11], they found that there was an expected negative relationship between their disclosure proxies and selected measures of cost of capital after using IV estimates. In contrast, Cohen discovered that after accounting for the endogeneity of reporting quality decisions, the association between his reporting quality metrics and the cost of capital was no longer significant [12]. These researches highlight the decisions and challenges for researchers when utilizing IV estimation. There are many ways to check and assess the quality of accounting. Nikolaev has produced a completely new way of studying accrued profit [13]. This makes it possible to measure the quality of accounting with clear objectives. It is also possible to determine the variance of the "real" economic performance. An indicator of the quality of accounting is the utilization of cash flows from operations and earnings to reflect the same economic performance. Different corporate disclosure has received significant attention from researchers and financial institutions worldwide, as there has been a great deal of research and study on various issues related to the subject over the past two decades. To further investigate the measures of accounting quality used in the previous literature, this research paper will mainly use the m score and t-test to compare the accounting quality and disclosure quality of Chinese listed companies in the U.S. and U.S. companies.
4. Research Design and Methods
4.1. Mechanism of M-score & One Sample t-test
The M-score is a numerical index used to indicate the propensity or likelihood of corporate financial fraud [14]. This means that the M-score is a numerical measure of the quality of a company's accounting information. In brief, the core methodology of the M-score is to propose eight indicators that can indicate the financial manipulation behavior of a firm and estimate the probability that the indicator predicts that the firm has engaged in financial manipulation using a probit model regression.
The M-Score model consists of eight indicators. Beneish himself conducted a probit regression analysis using a panel data set [15]. The results of their analysis, the classification error rate of the model (type I error/type II error), and the losses from each type of error are not presented here. It is reasonable that the data set should be updated in order to be applicable to today's market and accounting environment or to China, but the current common operation is to calculate directly using the classical parameters as follows.
\( M-Score = -4.840 + 0.920*DSRI + 0.528*GMI + 0.404*AQI + 0.892*SGI + 0.115*DEPI - 0.172*SAI - 0.327*LVGI + 4.679*TATA \) (1)
a. Days Sales in Receivables Index (DSRI)
A rapid and considerable increase (fluctuation) in the DSRI indicates that the business environment is likely to worsen, necessitating a number of changes to the sales credit program. Since early revenue recognition is expected throughout this process, the risk of financial manipulation increases as the index rises.
b. Asset Quality Index (AQI)
If this index rises over 1, it means that the company's asset quality has declined, and it may postpone costs in order to boost profits by taking advantage of unusual costs. This measure thus has a favorable correlation with excess manipulation.
c. Depreciation Index (DEPI, or Depreciation Index)
The depreciation rate of the firm has decreased if this indicator is higher than 1. In other words, by changing the useful life of its assets or by other financial means, it may have understated its depreciation expenditure. This would be a blatant deception and raise the company's excess as well.
d. Total Accruals to Total Assets (TATA)
Simply put, the accrual factor is a prescribed algorithmic formula. Accruals = (∆Current Assets - ∆Money Funds) - (∆Current Liabilities - ∆Long-term Liabilities due within one year - ∆Taxes Payable) - Depreciation Expense
e. Gross Margin Index (GMI, or Gross Margin Index)
A value higher than 1 denotes a declining profitability for the firm. This can result in a stronger propensity for "financial manipulation".
f. Sales Growth Index (SGI)
When an index exceeds 1, it indicates that a company's sales have increased. Numerous studies have revealed that in order to draw in potential investors, higher growing companies may need to have higher capital needs and financial performance criteria. As a result, these businesses may have a greater incentive to manipulate results. Operating income is regarded as being closely tied to the "manipulation motivation" in the M-Score model since it is a more thorough indicator of a company's development.
g. Sales General and Administrative Expenses Index (SGAI)
A higher index value indicates that the company's sales and administrative costs have grown, which increases the likelihood that it is having issues with cost control. The business is also more driven to fudge its profits in order to avoid experiencing similar financial problems.
h. Financial Leverage Index (LVGI)
When this index exceeds 1, it indicates that the company's leverage has grown, which might increase financial risk and thus raise the danger of default. The company's tendency for financial manipulation is becoming more clear at this stage.
*Higher M is associated with a higher probability of manipulation, M > -2.22 indicates potential manipulation (higher M than average non-manipulator)
*Beneish suggests that the cut-off of M > -1.89 is to balance the error when non-manipulator with the error when non-manipulator.
The t-test is one of the simplest statistical methods for assessing statistical differences between up to two different samples. It is only applicable to a small sample (<30) to assess a larger group. The t-test (also known as Student's t-test) compares two means (averages) because William Gosset, a Guinness brewer, published this statistical method under the pseudonym Student. He wanted to get information from a very small sample size (usually 3-5) because it was too expensive to brew a keg for his sample. The t-test also tells you how large these differences are; in other words, it lets you know if they might have occurred by chance.
To evaluate differences between the means of variables from up to two samples, statistical means are utilized. The factors, like the m-score measure we are looking at here, must be measurable. Based on the predicted level of significance, the t-test determines if the difference you see is "significant." A t-distribution is used by t-tests to determine the level of predicted variance. The ratio of the differences within groups to the differences between two groups is known as a t-score. The difference between the groups is bigger the higher the t-score. The degree of similarity between the groups is inversely correlated with the t-score. If the groups are three times as dissimilar from one another as they are from one another, the t-score is 3. A large t-score tells you that the groups are different. A small t-score tells you that the groups are similar.
The t-test is to collect a small random sample from a statistical population and compare the sample mean with another "value," which can be a known set value or the mean of another sample. For example, this time, we study the difference in accounting disclosure between Chinese listed companies in the U.S. and U.S. listed companies whose variable is m-score. Since there are not many Chinese companies listed in the U.S., some of them are delisted within a few years after listing, and some of them are just listed recently, so the sample size becomes a limitation of our experiment. However, the t-test is most suitable for small samples to do data variance assessment, which precisely solves our limitation due to small samples. Then our group randomly selected 20 Chinese listed companies in the US and US listed companies and calculated the average of their m-score for 8 years to compare their differences. the t-test can help us to verify "whether there is a difference between the accounting disclosure of the two companies."
4.2. Absolute Advantage of M-score
The M-Score model is maintaining high accuracy over time. A recent paper to be published in Accounting Review, the official journal of the American Accounting Association, points to the M-Score model as a major forensic model designed in the late 1990s by Professor Daniel Benish of Indiana University's Kelley School of Business. The M-Score model, a major forensic model designed by Professor Daniel Benish of the KELLEY School of Business in the late 1990s, remains highly accurate today and is the most economically viable model currently used by investors [16].
Currently, the M-Score model serves as a very important financial test indicator, which can effectively help practitioners to judge the investment risk of a company while avoiding relevant irregularities in a timely manner.
In 2018, the then pharmaceutical Baima stock Kangmei Pharmaceutical shocked the world with its financial fraud case, which accumulated more than 88 billion yuan of inflated monetary funds, becoming the largest financial fraud case in the history of A-share. According to the data, a total of 52,037 investors in Kangmei Pharmaceutical finally received compensation of 2.459 billion yuan. It was the case with the largest number of participants and the highest claims and compensation amount in A-share history. However, it is worth mentioning that as early as 2017, the M-Score model flagged the financial value of the relevant anomalies in [Kangmei Pharmaceutical].
Professor Daniel-Benish said the M-Score model's greatest significance is to provide auditors, investors, regulators and other professionals with relevant evidence of the costs and benefits of using fraud prediction models to minimize misjudgment and misdirection.
4.3. Abstract Sample Selection & and Descriptive Statistics
The two critical factors that we need to take into account during the data selection, in this case, the selection of Chinese and US companies listed in the U.S. stock market and their financial information, include the company size and company industry. To some extent, company size and the industry that a company belongs to directly affect its M-score, which can confuse our t-test result. In order to significantly eliminate the impact of these two factors, we started selecting companies in pairs, one Chinese company listed in the US and one US company listed in the US. Each pair of companies are in the same industry and have a close company size. For instance, One pair we selected is American Airlines and China Eastern Airlines. The two companies are among the largest airlines in the United States and China. In total, 25 pairs of companies were selected, covering a wide range of industries, including airlines, IT, manufacturing, healthcare, and others. 25 pairs are then split and assigned to two categories based on countries. M-scores of each company for the recent 8 time periods are calculated and recorded correspondingly. Table 2& 3 shows the top 5 rows of the two groups of data we’ve collected and organized.
Table 2: M-scores of U.S. listed Chinese companies of first 5 observations.
Company | Company type | 2021-2020 | 2020-2019 | 2019-2018 | 2018-2017 | 2017-2016 | 2016-2015 | 2015-2014 | 2014-2013 |
China Mobile (Hong Hong) | 1 | -3.235 | -2.773 | -2.666 | -2.486 | -3.272 | -1.939 | -2.377 | -2.612 |
Sinopec | 1 | -2.580 | -6.230 | -3.530 | -1.110 | -3.590 | -1.890 | -1.850 | -4.430 |
China Eastern Airlines | 1 | -2.500 | -2.750 | -2.860 | -2.360 | -2.310 | -2.910 | -2.790 | -2.870 |
China Southern Airlines Company | 1 | -2.970 | -4.610 | -2.930 | -2.630 | -2.500 | -2.960 | -3.240 | -2.950 |
Aluminum Cooperation of China Limited | 1 | -2.600 | -3.090 | -2.510 | -2.560 | -2.810 | -3.310 | -2.980 | -0.200 |
Table 3: M-scores of U.S. listed U.S. companies of first 5 observations.
Company | Company type | 2021-2020 | 2020-2019 | 2019-2018 | 2018-2017 | 2017-2016 | 2016-2015 | 2015-2014 | 2014-2013 |
Autozone | 0 | -2.853 | -2.819 | -2.590 | -3.061 | -2.669 | -2.579 | -2.538 | -2.484 |
American Airlines Group | 0 | -249.730 | -2.170 | -2.170 | -2.620 | -2.920 | -3.050 | -1.870 | -2.740 |
US Energy Corp | 0 | -3.980 | -1.000 | -2.330 | -2.870 | -4.000 | -8.260 | -11.300 | -2.150 |
Southwest Airlines | 0 | -5.780 | -2.080 | -3.150 | -2.640 | -2.780 | -2.970 | -2.900 | -2.890 |
Pfizer Inc | 0 | -2.730 | -2.860 | -2.350 | -2.500 | -2.310 | -2.720 | -2.640 | -2.590 |
With obtained two samples of M-score data, we subtracted the mean M-score of Chinese companies listed in the United States from the mean M-score of American companies in each period to obtain the final sample, containing 8 values, which was used for the t-test. Figure 5 displays the final sample we obtained. By calculating the final sample mean and standard deviation, we are able to run the classic one-sample t-test with a population mean of 0 since our purpose is to investigate whether the difference between the two delivered means is equal to zero.
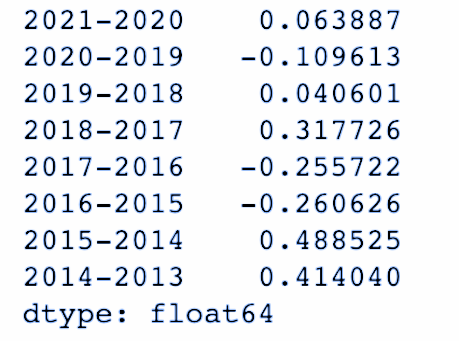
Figure 5: Final sample.
5. Preliminary Suppositions and Implications
The hypotheses are as follows:
H0: the difference between the mean M-score of U.S. listed Chinese companies and the mean M-score of U.S. companies is not significant.
\( H0: µmC- µmA = 0 \) (2)
(where µmC stands for the mean M-score of U.S. listed Chinese companies and µmA stands for the mean M-score of mean M-score of U.S. companies)
import scipy.stats as stats
t_statistic,p_value = stats.ttest_lsamp(a=diff, popmean = 0)
print(t_statistic ,p_value)
0.8431603930359414 0.42700723361302073
HA: the difference between the mean M-score of U.S. listed Chinese companies and the mean M-score of U.S. companies is significant.
HA: µmC- µmA ≠ 0(3)
The p-value and histogram of our sample are demonstrated as follows:
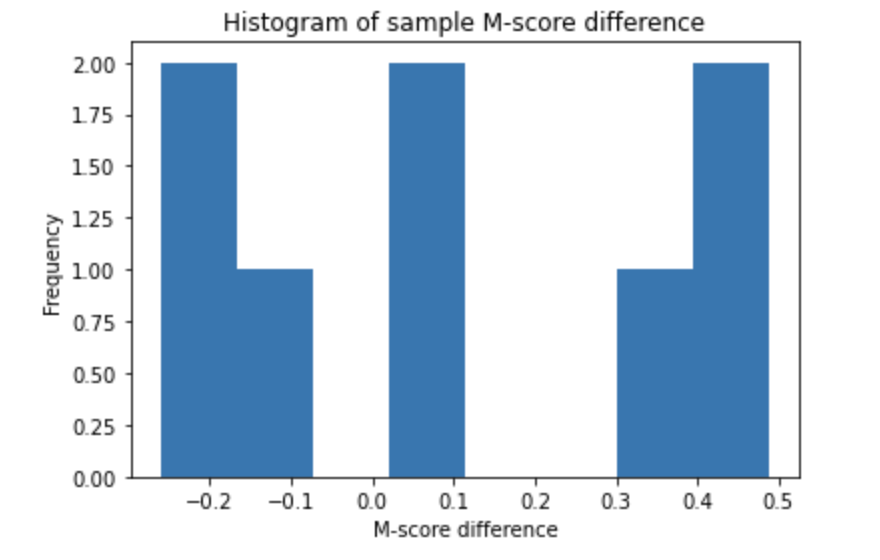
Figure 6: Histogram of sample M-score difference.
In convention, the results of all types of t-tests are evaluated based on the numerical value of alpha and the p-value, with alpha being 0.05 in most cases. If the p-value is less than alpha, the result is typically considered to be statistically significant, and the null hypothesis (H0) is rejected. Otherwise, the result fails to reject the null hypothesis. Back to our one sample t-test, the p-value of our results (0.43) is greater than alpha = 0.05, and hence we fail to reject the null hypothesis, which indicates that there is no significant meaning to investigate the difference between mean values of M-score between the group of U.S. listed Chinese companies and the group of U.S. companies. Figure 6 above is a histogram of M-score differences, and values in Figure 5. The histogram has separated bars which do not close to the typical shape of a T-distribution graph.
It further indicates the result of no significant relationship between variables that we are investigate in this research topic. Even if we transform the data set by applying log transform, the result does not change pretty much. As this result does not look consistent with our previous expectations, we propose the following conjecture to explain it.
Chinese companies listed in the U.S. are required by relevant U.S. laws and rules to prepare financial statements and meet disclosure obligations; otherwise, they cannot be registered with U.S. regulators [17]. Therefore, Chinese businesses adhere to all applicable rules and regulations in the United States. According to US generally accepted accounting rules, companies having their headquarters in China are often set up as variable interest entities (VIEs) ("GAAP"), and the consolidated financial statements created by the U.S. listed firm incorporate the operations and financial status of the Chinese company or Chinese VIE. Therefore, both U.S. listed companies and Chinese listed companies in the U.S. prepare their financial reports based on GAAP. This results in the M-score of both being not significant.
When we selected the number of Chinese listed companies in the U.S., we found that recently, "as the game between China and the U.S. intensified, the U.S. continued to strengthen its regulatory policies involving Chinese stocks, expanding the list of securities trading restrictions, introducing and accelerating the implementation of the Foreign Company Accountability Act, and increasing restrictions and disclosure requirements for companies with variable interest entity structures. The regulatory environment for the Chinese stock market has changed profoundly, and uncertainty has increased significantly, causing most Chinese stocks to choose to delist [17]. This results in a small selection of companies, with only 25 Chinese listed companies in our final sample. This phenomenon may lead to errors in our calculation of the average M-score for each year. This may result in the M-score of both being not significant.
The last conjecture focuses on the credibility of chosen companies and the meaning behind the M-score. Although M-score takes a variety of significant financial information or main indexes into account, its major purpose is to detect the possibility of financial manipulation, and its conclusion is classified by several numerical numbers as aforementioned. Most of the companies in the sample have not been publicly reported to be involved in or suspected of manipulating financial information, which implies most of their M-scores are healthy and classified into the group of “no manipulation.” In this case, the final classification weighs much more than the numerical outcome of the calculation. More parameters may be needed to study the relationship between the country in which a company is established and its accounting quality.
6. Conclusion
This paper document investigates the difference in accounting quality between Chinese companies and the U.S. companies listed in the U.S. stock market as accounting quality is one of the critical indicators that all stakeholders, especially investors, pay attention to when making decisions and the accounting disclosure difference between two countries contributed by a variety of factors may directly affect the quality of disclosure. We perform a two-tailed one-sample t-test and descriptive analysis to evaluate the sample, which consists of M-scores from 50 companies in two countries with specific restrictions. The results suggest that there is no significant difference between the two groups of M-scores, which does not stay consistent with our previous hypothesis. To explain such a result, we shifted the focus to the aspect of data quality in the sample and described possible reasons. We conclude that to improve the sample for the final t-test, more financial information, models, and parameters need to be taken into account.
References
[1]. Liu, Huadong. “Analysis of the Differences and Linkage between Chinese and American Stock Markets.” American Journal of Industrial and Business Management, vol. 8, no. 3, 8 Mar. 2018, www.scirp.org/journal/paperinformation.aspx?paperid=83326, 10.4236/ajibm.2018.83047.
[2]. Lu, Hai. “Information Quality in China’s Capital Market and the Information Transparency Index White Paper.” Pku.edu.cn, 2020, news.pku.edu.cn/wyyd/dslt/5bafd6243bf94fcda1d18db4f215d9c0.htm. Accessed 28 Sept. 2022.
[3]. Dechow, P., Ge, W., & Schrand, C. (2010). Understanding Earnings Quality: A review of the proxies, their determinants and their consequences. Journal of Accounting and Economics, 50(2-3), 344–401. https://doi.org/10.1016/j.jacceco.2010.09.001.
[4]. Ball, R., & Shivakumar, L. (2005). Earnings quality in UK private firms: Comparative loss recognition timeliness. Journal of Accounting and Economics.
[5]. Basu, S. (2005). Discussion of ‘Conditional and unconditional conservatism: Concepts and modeling’. Review of Accounting Studies, 10(2/3), 311−321.
[6]. Francis, J., & Wang, D. (2008). The joint effect of investor protection and Big 4 audits on earnings quality around the world. Contemporary Accounting Research, 25(1), 157−191.
[7]. Diamond D., and R. Verrecchia. 1991. Disclosure, liquidity and the cost of equity capital. The Journal of Finance.
[8]. Clarkson, P., Guedes, J., & Thompson, R. (1996). On the diversification, Observability, and measurement of Estimation Risk. jstor. Retrieved November 27, 2022, from https://www.jstor.org/stable/2331387.
[9]. Botosan, C. A. (1997). Disclosure Level and the Cost of Equity Capital. The Accounting Review, 72(3), 323–349. http://www.jstor.org/stable/248475
[10]. Graham JR, Harvey CR, Rajgopal S (2005) The economic implications of corporate financial reporting. J Account Econ 40(1–3):3–73.
[11]. Brown, S., Hillegeist, S.A., 2007. How disclosure quality affects the level information asymmetry. Review of Accounting Studies 12, 443–477.
[12]. Cohen, D.A., 2008. Does information risk really matter? An analysis of the determinants and economic consequences of financial reporting quality. Asia Pacific Journal of Accounting and Economics 15, 69–90.
[13]. Nikolaev, V. V. (2014, August 23). Identifying accounting quality. SSRN. Retrieved November 27, 2022, from https://papers.ssrn.com/sol3/papers.cfm?abstract_id=2484958.
[14]. Beneish’s M-Score | Accounting Ratio | GMT Research. Gmtresearch.com. (1999). Retrieved 22 September 2022, from https://www.gmtresearch.com/en/accounting-ratio/beneishs-m-score/.
[15]. D. Beneish, M. (1999). The Detection of Earnings Manipulation. Retrieved 27 September 2022, from https://citeseerx.ist.psu.edu/viewdoc/download?doi=10.1.1.195.3676&rep=rep1&type=pdf.
[16]. University, I. (2022). Kelley professor’s M-Score model remains most viable means of predicting corporate fraud. Kelley School of Business. Retrieved 27 September 2022, fromhttps://blog.kelley.iu.edu/2022/02/17/kelley-professors-m-score-model-remains-most-viable-means-of-predicting-corporate-fraud/.
[17]. Yeh, D., Sha, S., Zhou, J., Ni, S., & Qu, P. (2022). The HFCAA and consequences for US-listed China-based companies | White & Case LLP. Whitecase.com. Retrieved 28 September 2022, from https://www.whitecase.com/insight-our-thinking/hfcaa-and-consequences-us-listed-china-based-companies.
Cite this article
Wang,J.;Lin,Y.;Liu,Y.;Zhang,F.;Li,Y. (2023). The Differences in Accounting Quality between Chinese Companies and American Companies Listed in the United States. Advances in Economics, Management and Political Sciences,18,55-67.
Data availability
The datasets used and/or analyzed during the current study will be available from the authors upon reasonable request.
Disclaimer/Publisher's Note
The statements, opinions and data contained in all publications are solely those of the individual author(s) and contributor(s) and not of EWA Publishing and/or the editor(s). EWA Publishing and/or the editor(s) disclaim responsibility for any injury to people or property resulting from any ideas, methods, instructions or products referred to in the content.
About volume
Volume title: Proceedings of the 2023 International Conference on Management Research and Economic Development
© 2024 by the author(s). Licensee EWA Publishing, Oxford, UK. This article is an open access article distributed under the terms and
conditions of the Creative Commons Attribution (CC BY) license. Authors who
publish this series agree to the following terms:
1. Authors retain copyright and grant the series right of first publication with the work simultaneously licensed under a Creative Commons
Attribution License that allows others to share the work with an acknowledgment of the work's authorship and initial publication in this
series.
2. Authors are able to enter into separate, additional contractual arrangements for the non-exclusive distribution of the series's published
version of the work (e.g., post it to an institutional repository or publish it in a book), with an acknowledgment of its initial
publication in this series.
3. Authors are permitted and encouraged to post their work online (e.g., in institutional repositories or on their website) prior to and
during the submission process, as it can lead to productive exchanges, as well as earlier and greater citation of published work (See
Open access policy for details).
References
[1]. Liu, Huadong. “Analysis of the Differences and Linkage between Chinese and American Stock Markets.” American Journal of Industrial and Business Management, vol. 8, no. 3, 8 Mar. 2018, www.scirp.org/journal/paperinformation.aspx?paperid=83326, 10.4236/ajibm.2018.83047.
[2]. Lu, Hai. “Information Quality in China’s Capital Market and the Information Transparency Index White Paper.” Pku.edu.cn, 2020, news.pku.edu.cn/wyyd/dslt/5bafd6243bf94fcda1d18db4f215d9c0.htm. Accessed 28 Sept. 2022.
[3]. Dechow, P., Ge, W., & Schrand, C. (2010). Understanding Earnings Quality: A review of the proxies, their determinants and their consequences. Journal of Accounting and Economics, 50(2-3), 344–401. https://doi.org/10.1016/j.jacceco.2010.09.001.
[4]. Ball, R., & Shivakumar, L. (2005). Earnings quality in UK private firms: Comparative loss recognition timeliness. Journal of Accounting and Economics.
[5]. Basu, S. (2005). Discussion of ‘Conditional and unconditional conservatism: Concepts and modeling’. Review of Accounting Studies, 10(2/3), 311−321.
[6]. Francis, J., & Wang, D. (2008). The joint effect of investor protection and Big 4 audits on earnings quality around the world. Contemporary Accounting Research, 25(1), 157−191.
[7]. Diamond D., and R. Verrecchia. 1991. Disclosure, liquidity and the cost of equity capital. The Journal of Finance.
[8]. Clarkson, P., Guedes, J., & Thompson, R. (1996). On the diversification, Observability, and measurement of Estimation Risk. jstor. Retrieved November 27, 2022, from https://www.jstor.org/stable/2331387.
[9]. Botosan, C. A. (1997). Disclosure Level and the Cost of Equity Capital. The Accounting Review, 72(3), 323–349. http://www.jstor.org/stable/248475
[10]. Graham JR, Harvey CR, Rajgopal S (2005) The economic implications of corporate financial reporting. J Account Econ 40(1–3):3–73.
[11]. Brown, S., Hillegeist, S.A., 2007. How disclosure quality affects the level information asymmetry. Review of Accounting Studies 12, 443–477.
[12]. Cohen, D.A., 2008. Does information risk really matter? An analysis of the determinants and economic consequences of financial reporting quality. Asia Pacific Journal of Accounting and Economics 15, 69–90.
[13]. Nikolaev, V. V. (2014, August 23). Identifying accounting quality. SSRN. Retrieved November 27, 2022, from https://papers.ssrn.com/sol3/papers.cfm?abstract_id=2484958.
[14]. Beneish’s M-Score | Accounting Ratio | GMT Research. Gmtresearch.com. (1999). Retrieved 22 September 2022, from https://www.gmtresearch.com/en/accounting-ratio/beneishs-m-score/.
[15]. D. Beneish, M. (1999). The Detection of Earnings Manipulation. Retrieved 27 September 2022, from https://citeseerx.ist.psu.edu/viewdoc/download?doi=10.1.1.195.3676&rep=rep1&type=pdf.
[16]. University, I. (2022). Kelley professor’s M-Score model remains most viable means of predicting corporate fraud. Kelley School of Business. Retrieved 27 September 2022, fromhttps://blog.kelley.iu.edu/2022/02/17/kelley-professors-m-score-model-remains-most-viable-means-of-predicting-corporate-fraud/.
[17]. Yeh, D., Sha, S., Zhou, J., Ni, S., & Qu, P. (2022). The HFCAA and consequences for US-listed China-based companies | White & Case LLP. Whitecase.com. Retrieved 28 September 2022, from https://www.whitecase.com/insight-our-thinking/hfcaa-and-consequences-us-listed-china-based-companies.