


1. Introduction
The market of films was thriving before the pandemic outbreak. In 2019, global film industry reached an undefeatable high record of 42.5 billion U.S. dollars overall [1]. However, the outbreak of the COVID-19 in the early 2020 has caused a huge impact on the global economy [1]. This also affected the companies in the film industry in many ways. This pandemic has produced a direct consequence that film companies have been asked to stop the business and ordered their employees to stay at home, causing a massive impact on Hollywood’s traditional production [2]. The shirking workforce of entertainment industry, including film industry, has caused unemployment of 890,000 professionals overnight [2]. Due to the COVID-19 pandemic and lockdown, the Hollywood in United States of America, one of the major markets in the world, was broken by the virus. It also made the film makers have no choice but releasing the recently released films online, which led to the bad condition of cinema hall. Apart from the threat of streaming platform, other challenge has emerged in the form of lacking new released film. The production schedule has been disturbed by the pandemic, resulting some delayed of released dates or total cancellation [2].
To measure possible effects of the COVID-19 on a particular business-like film industry, analyzing stock price could be one accessible way [3]. In 2020, the beginning of the COVID-19 pandemic, information is provided by the stock prices on how certain companies were influenced by the pandemic in line with investors [3]. CAPM model is introduced to analyze stock returns, volatility, and profits. It has been widely used to discuss the impact of the outbreak of COVID-19 on certain industries. Based on CAPM model, investigation on food supply chain under the outbreak found that the pandemic has smaller impact on food sector, showing a lower volatility than in the S&P500 [3]. Another investigation on forest industry shows that it was hit hard by the pandemic, but it recovered rapidly during 2020. They also discovered that systematic rick of forest industry in North America experienced a dramatic change in 2020, by measuring beta values of CAPM model [4]. Fan analyzed traditional Chinese medicine industry’s performance during the COVID-19 pandemic, and found that the fitting efficiency of CAPM model was not very good. Stock of Chinese medicine not only affected by systemic risk, but it’s also affected by some other non-systemic risk, which shows the boundedness of CAPM model [5]. It’s noticed that another investigation conducted by Zou and Wang on the investment value of China’s medical sector found that the medical and pharmaceutical sector now have a stable systematic risk and their values are obviously underestimated by the investors [6]. Another case with the result discussed the investing decisions during the COVID-19 by using CAPM model, concluded the inverse relationship of beta value and E(Ri). They expected to help making comparison when making investment decisions during the outbreak period [7].
Many researchers have conducted studies to investigate how pandemic outbreak had affected various industries adopting CAPM model, while there’s a lack of study focusing on stock price performance of film industry under the effects of the pandemic outbreak. The main aim of this study is to investigate the performance variation of film industry during the COVID-19 pandemic. It’s expected to gain a valuable insight into the film industry’s resilience and potential for growth. Five big film industry companies in Hollywood are investigated as the sample of the study. The first step of study is to show a general picture of the five companies’ annual variation over the period from 2020 to 2022 through extracting the stock close price. Furthermore, the regressions will be run to investigate the impact of the outbreak on film industry companies in different phases of the pandemic by using CAPM model. Therefore, some comparisons will be made to show the different characteristics of the companies and how COVID-19 induced shock to film industry. At last, the limitations of the CAPM model in this study will be discussed along with the outlook of film industry. In this way, some solutions and coping means towards sudden events will be expected to be introduced.
2. Data & Method
2.1. Data
In order to analyze the impact of the COVID-19 on film industry, five big film industry companies are chosen as a typical sample: Warner Bros. Pictures, Walt Disney Studios, Universal Pictures, 20th Century Studios, and Sony Pictures Entertainment. The reason why these five companies are chosen is that they are the head film companies of Hollywood and they can be a typical sample to represent the performance of film industry over the period of the pandemic. Stock data of these five companies is extracted from Yahoo Finance in the years 2020, 2021, 2022 by Python. The evolutions of the price for the selected stocks are shown in Fig. 1.
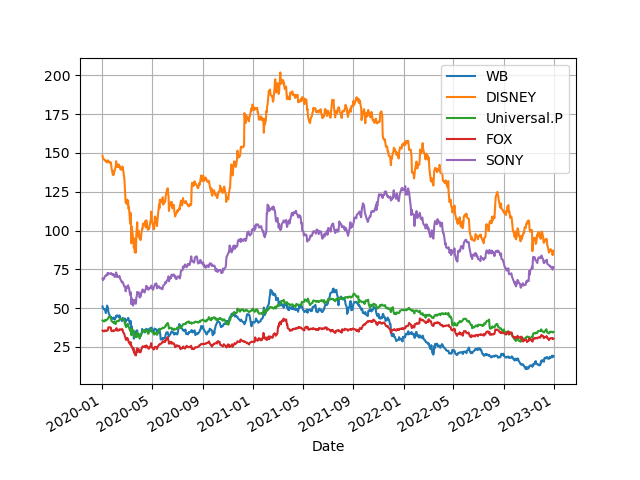
Figure 1: Time series plot of the stock prices of five film companies from 2020 to 2022.
2.2. CAPM Model
This study uses the Capital Asset Pricing Model (CAPM) which is a theoretical model based on the risk-free rate of return, the expected market return, and the asset’s beta that can describe the relationship between expected return on an investment and risk [1]. It uses single variable (system risk known as the Beta variable) to describe risk. Compared to the market index, the beta factor measures the system risk of an asset [8]. The alpha represents the excess return of an asset or portfolio surpassing its expected return based on the systematic risk [9]. It measures the asset’s performance relative to CAPM model’s prediction. More formally, the regression model of the CAPM model is estimated as:
\( Rit-Rft=αi+βi(Rmt-Rft)+εit \) (1)
The intercept term is calculated by CAPM model, representing the deviation between the actual market return and the expected return. Furthermore, Rit represents the monthly return of the stock in month t, and Rft represents the risk-free return rate in month t. Therefore, Rit-Rft represents the excess return rate of relative risk-free assets in month t, Rmt-Rft represents the market risk premium in month t [10].
2.3. Processing
For the analysis of the impact of the COVID-19, the years 2020, 2021, 2022 are discussed separately as different phases of the pandemic. Firstly, S&P500 is chosen as stock index, which explains a large share of the market capitalization in the U.S. market. 500 large companies in U.S. were listed in S&P500 to measure their stock performance. Based on the close price, daily returns can be calculated using pct.change method in python. For the regression model, based on the market return of S&P500, beta values are calculated by the mean of linear regression. The alpha values are the intercepts also worked out by the mean of linear regression. R-squares are used to measure whether the CAPM model is well-fitted.
3. Result & Discussion
3.1. Regression Results in 2020
Fig. 2 shows the daily returns for five film companies and S&P500 in 2020. High fluctuations can be seen in the beginning phase of the pandemic. It shows its lowest point on 16 March 2020, where negative returns exceed those of the other time in 2020. All five companies show more volatility than the market, which mean the pandemic has caused more uncertainty in film industry.
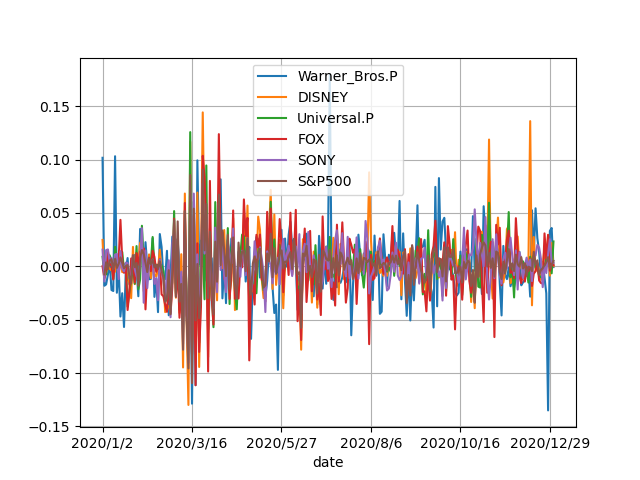
Figure 2: Time series plot of the stock daily returns of five film companies in 2020.
Statistics of regression variables are illustrated in Table 1. The mean of R-square is approximately 0.467, which indicates that CAPM model can explain 46.7% of the excess returns of individual stocks. According to Financial modelling, the financial regression that gives R square around 20% to 30% is a reasonable result [11]. However, mean of R-square in 2020 is much higher than the reasonable range, which means that in this period 46.7% of the risk may come from market fluctuation which are almost unavoidable. Since beta value determines a portion of a stock’s stand-alone risk [12], and the mean of the beta values in 2020 is about 0.900, which means that during the period of the beginning of COVID-19, the performance of the five film companies is basically same as the market. Nevertheless, the mean of alpha values is a weak negative value (-0.000049) which indicates that the average performance of five film industry companies is overrated by the investors. In this case, film industry performed worse than previous years during the outbreak period.
Table 1: CAPM linear regression results of five film companies in 2020.
Value | Warner Bros.Pictures | Walt Disney Studios | Universal Pictures | 20th Century Studios | Sony Pictures Entertainment | Means |
Beta | 0.731 | 1.086 | 0.922 | 0.970 | 0.741 | 0.890 |
Alpha | -0.001 | 0.000 | 0.000 | -0.001 | 0.001 | 0.000 |
R2 | 0.207 | 0.552 | 0.653 | 0.441 | 0.543 | 0.479 |
Regression results of Warner Bros. Pictures can be seen in Table 1, giving the R-square approximately 20.7%. There is a weak negative alpha -0.001 which below average. The beta also shows below the mean of five companies. With both beta and alpha below the average level, performance of Warner Bros.Pictures in 2020 was worse than expected. Walt Disney Studios’s R-square is illustrated in a reasonable result, which is 55.2%. The beta value is the highest among the five film companies, reaching 1.086 in 2020. Alpha value 0.000 is also ranked second in five film companies. The R-square of Universal Pictures shown in Table 1 is about 0.653, higher than others. Both beta and alpha show above average values, which are 0.922 and 0.000 respectively. R-square of 20th Century Studios is slightly lower than the mean of the five film companies. A weak negative value of alpha can be seen in Table 1, but the beta rate is 0.970, ranked second among five companies. Sony Pictures Entertainment holds the highest alpha value, exceeding that of Walt Disney Studios. Nevertheless, the beta value is lower than the mean of five companies.
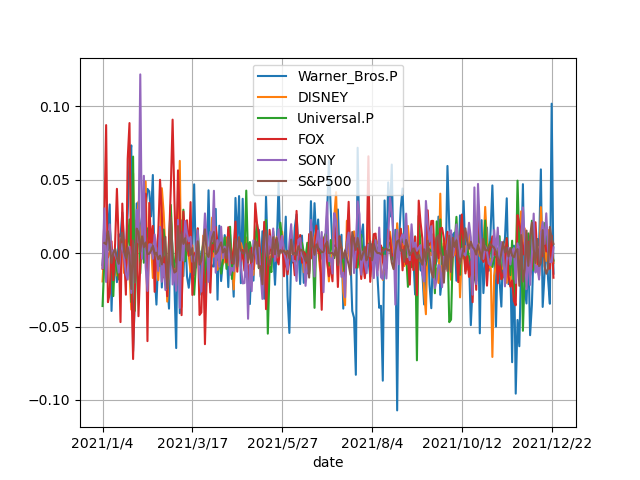
Figure 3: Time series plot of the stock daily returns of five film companies in 2021.
3.2. Regression Results in 2021
The stock daily returns in 2021 are shown in Fig. 3. Compared to that in 2020, though the average fluctuation is lower, it still shows a high fluctuation in particular period. Different from that in 2020, market return had become stable in 2021. However, the five-film industry remained unstable, indicating that there is more uncertainty in film industry than others. Table 2 lists the regression results of five film companies in 2021. R-square is about 0.145. it’s much lower than that in 2020. However, the mean of alpha value decreases compared to that in 2020. The subsequent effect of the pandemic made film industry performed even worse than the beginning phase of COVID-19. The decrease of beta value indicates that the risk of film industry lower in the year 2021.
Table 2: CAPM linear regression results of five film companies in 2021.
Value | Warner Bros.Pictures | Walt Disney Studios | Universal Pictures | 20th Century Studios | Sony Pictures Entertainment | Means |
Beta | 0.135 | 0.919 | 0.857 | 0.463 | 1.085 | 0.692 |
Alpha | -0.001 | -0.001 | -0.001 | 0.001 | 0.000 | 0.000 |
R2 | 0.015 | 0.233 | 0.213 | 0.030 | 0.252 | 0.146 |
According to the results, R-square of Warner Bros.Pictures is about 0.0148, and it has beta and alpha value 0.135 and -0.001 respectively. Walt Disney Studios has R-square approximately 0.233, and beta value 0.919, alpha value -0.001. Universal Pictures’ R-square is about 0.213, and its beta value 0.857, alpha value -0.001. 20th Century Studios has R-square approximately 0.030, beta value 0.463. Alpha value 0.0007, highest among five companies. Sony Pictures Entertainment has R-square 0.232 and beta value 1.085, both are the highest among five companies. In addition, it has a weak negative alpha 0.000.
3.3. Regression Results in 2022
Fig. 4 illustrates the stock daily return in 2022. Both market return and film industry companies’ return became more stable in this year. Nevertheless, a noticeable high fluctuation of Warner Bros.Pictures can be seen in the graph. In general, it seems that film industry gradually recovered from the shock of the pandemic. Regression results in 2022 can be seen in Table 3. The mean of R-square is 0.367, slightly higher than the reasonable range. Beta value increases compared to that in 2021, very close to that in 2020. However, the mean of alpha value still shows a drop trend in 2022, reaching about -0.001.
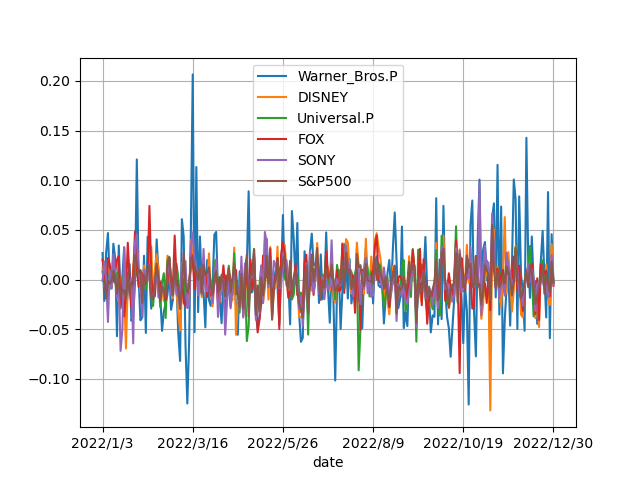
Figure 4: Time series plot of the stock daily returns of five film companies in 2022.
Table 3: CAPM linear regression results of five film companies in 2022.
Value | Warner Bros.Pictures | Walt Disney Studios | Universal Pictures | 20th Century Studios | Sony Pictures Entertainment | Means |
Beta | 0.953 | 1.149 | 0.755 | 0.732 | 0.942 | 0.906 |
Alpha | 0.000 | -0.001 | -0.001 | 0.000 | -0.001 | -0.001 |
R2 | 0.111 | 0.567 | 0.378 | 0.308 | 0.471 | 0.367 |
Based on the results, R-square of Warner Bros.Pictures in 2022 is about 0.111, and it has beta and alpha value 0.953 and 0.000 respectively. Walt Disney Studios has R-square in 2022 approximately 0.567, and beta value 1.149, alpha value -0.001. Universal Pictures’ R-square is about 0.378, and its beta value 0.755, alpha value -0.001. 20th Century Studios has R-square approximately 0.308, beta value 0.732. It has a weak negative alpha value reaching 0.000. Sony Pictures Entertainment has R-square 0.471, beta value 0.942 and alpha -0.001.
3.4. Comparison & Suggestions
Based on the analysis, regression results of five film companies in the years 2020, 2021, 2022 can be seen clearly. Over the three years period, a downward trend of mean of weak negative alpha value indicates that the performance of five film companies acted worse than expected. Besides, film industry received less unavoidable risks from the market since the R-square reached its lowest point in 2021, but it went high again in 2022. The mean of beta value also shows a same trend as that of R-square. In 2020 and 2022, it has the mean of beta of 0.890 and 0.906 respectively, approaching 1, which means that risks of these five film companies are highly associated with the market’s risks and fluctuations.
Alpha of Warner Bros. Pictures in the three years period always shows a weak negative value, presenting a downward trend. This indicates that the performance of Warner Bros. Pictures was getting worse in the past three years. The beta value highly fluctuated, which represent the uncertain system risks during the pandemic. However, the R-squares of Warner Bros. Pictures are quite low, maybe because there’re some others factors are not capture by the CAPM. The performance of Walt Disney Studios is above the average of five film companies, since it had a positive alpha value in 2020. However, its alpha value became negative in 2021 and 2022, lower than the mean of five companies. The beta values are always higher than average, which means that Walt Disney Studios has higher system risks but also will receive higher expected return. In addition, the regression results fit with the model in goo way since R-squares of Walt Disney Studios are quite high. Similar to Walt Disney Studios, Universal Pictures also had a positive alpha in 2020 but turned into negative in the following two years. The decrease of beta values indicates that the expected return decrease though the system risks reduced during the pandemic. It’s worth noting that the R-squares of Universal Pictures are also quite high which means that it had a predictable asset return. During the three years of the pandemic, 20th Century Studios experienced a high fluctuation in alpha value. Under the effect of the outbreak in 2020, 20th Century Studios’ alpha value became negative. However, it turned into positive value in 2021, highest among the five companies. Then the alpha value decreased and showed a weak negative value in 2022. This kind of fluctuation maybe because of different epidemic cycles. However, the data of 2021 maybe inaccurate and by affected by factors can’t be captured by the model since the R-square of 2021 is quite low. In line with the variation of alpha value of Sony Pictures Entertainment (short in Sony), it seems that during the pandemic Sony performed worse and worse. It faced greater system risks since its beta values are always quite high.
4. Limitations & Future outlooks
There are still some limitations in this study. The Capital Asset Pricing Model itself has some limitations so it can’t explain market perfectly. First, the relationship between risk and return described by CAPM is prior to the relationship. This risk-return relationship is predictive, not historical, and should reflect investor expectations [13]. However, it’s difficult to observe expectations, especially those regarding the risk attributes of a security or portfolio’s response rate. Furthermore, attributed to the incompleteness of the Capital Asset Pricing Model, beta coefficient can’t fully explain the capital asset pricing. Some abnormal factors that can affect the capital asset pricing are constantly appearing [14]. Therefore, because of the CAPM’s difficulties in fitting the real market, the results of this study might also have some limitations. For the further investigation, Fama-French model may be a better choice to go, since the R-squares are quite low based on CAPM. Additionally, five film companies are chosen in this study as a typical sample to study the performance of film industry during the pandemic. Whereas, the data retrieved from this sample may be insufficient, as its small size. Moreover, it’s important to note that the film industry is complex and influenced by many factors beyond just risk and return, which are difficult to measure.
After the shock of the COVID-19 pandemic, with millions of workers back to the workforce, film industry is expected to gradually recover. Nevertheless, the pandemic also brings some potential trends for film industry in the future. Some movie released during the outbreak of pandemic chose a hybrid release model, where movies are released simultaneously in theaters and on steaming platforms. Though at that time, this approach did cause a huge objection, it could be a possible trend in future film industry. Alternative release strategies may appear as the traditional distribution channels faced a great challenge in the outbreak period. Multiple plans must be prepared in case another emergency occur in the future.
5. Conclusion
In summary, this study presents an assessment of the impact of the COVID-19 in the film industry based on CAPM. R-squares for each year are calculated and the results indicate that during the pandemic unavoidable risks of the film industry brought by market exceeded the reasonable range. It means that film industry faces a huge challenge caused by the outbreak. Negative alpha values are seen in the years 2020, 2021 and 2022, which means the performance of film industry is worse than expected. Except for 2021, beta values show the related relationship between market and film industry companies. Owing to the CAPM’s limitations caused by its basic assumptions, the study may not very accurate. A better model (e.g., Fama-French model) could be chosen for further investigation. Moreover, the COVID-19 pandemic may bring some changes in future film industry. Some measures could be taken in film industry to prevent the possible risks bring by the sudden events. Film companies can use the finding as a general indication of the impact of the COVID-19 to fix the weakness of the film industry and make an ahead preparation towards unexpected events. Overall, these results offer a guideline for film industry to have a better understand on the risks for sudden events (e.g., pandemic) so as to make a full preparation for it.
References
[1]. Shah, M. H., Yaqoub, M., Wu, Z. J.: Post-pandemic Impacts of COVID-19 on Film Industry Worldwide and in China. Global Media Journal: Pakistan Edition, 13(2) (2020).
[2]. Johnson, M.: Hollywood survival strategies in the post-COVID 19 era. Humanities and Social Sciences Communications, 8(1), 1-8 (2021).
[3]. Höhler, J., Lansink, A. O.: Measuring the impact of COVID‐19 on stock prices and profits in the food supply chain. Agribusiness, 37(1), 171-186 (2021).
[4]. Størdal, S., Lien, G., Trømborg, E.: Impacts of infectious disease outbreaks on firm performance and risk: The forest industries during the COVID-19 pandemic. Journal of Risk and Financial Management, 14(7), 318 (2021).
[5]. Fan, S.: Empirical study of the traditional Chinese medicine industry based on CAPM. China’s collective economy, 17, 66-68 (2021).
[6]. Zou, Z., Wang, X.: Research on the investment value of China’s medical sector in the context of COVID-19. Economic Research-Ekonomska Istraživanja, 36(1), 614-633 (2023).
[7]. Susanti, E., Grace, E., Ervina, N.: The investing decisions during the Covid-19 PANDEMIC by using the capital asset pricing Model (CAPM) method in lq 45 INDEX COMPANIES. International Journal of Science, Technology & Management, 1(4), 409-420 (2020).
[8]. Lintner, J.: Security prices, risk, and maximal gains from diversification. The journal of finance, 20(4), 587-615 (1965).
[9]. Sharpe, W. F.: Capital asset prices: A theory of market equilibrium under conditions of risk. The journal of finance, 19(3), 425-442 (1964).
[10]. Zhang, L.: Empirical research on the constituent stocks of China's Shanghai Stock Exchange 50 Index - Based on the CAPM model and Fama-French three-factor model. Economic Research Navigator, 26, 78-80 (2022).
[11]. Kienitz, J., Wetterau, D.: Financial modelling: Theory, implementation and practice with MATLAB source. John Wiley & Sons, 2013.
[12]. Perold, A. F.: The capital asset pricing model. Journal of economic perspectives, 18(3), 3-24 (2004).
[13]. Roll, R.: A critique of the asset pricing theory's tests Part I: On past and potential testability of the theory. Journal of financial economics, 4(2), 129-176 (1977).
[14]. Zhao, J.: A brief discussion on the role and limitations of β in the CAPM model. Theoretical Studies, 20, 141-142 (2012).
Cite this article
Chen,Y. (2023). The Performance Variation of Film Industry During Different Phases of COVID-19 Based on CAPM. Advances in Economics, Management and Political Sciences,21,45-52.
Data availability
The datasets used and/or analyzed during the current study will be available from the authors upon reasonable request.
Disclaimer/Publisher's Note
The statements, opinions and data contained in all publications are solely those of the individual author(s) and contributor(s) and not of EWA Publishing and/or the editor(s). EWA Publishing and/or the editor(s) disclaim responsibility for any injury to people or property resulting from any ideas, methods, instructions or products referred to in the content.
About volume
Volume title: Proceedings of the 2023 International Conference on Management Research and Economic Development
© 2024 by the author(s). Licensee EWA Publishing, Oxford, UK. This article is an open access article distributed under the terms and
conditions of the Creative Commons Attribution (CC BY) license. Authors who
publish this series agree to the following terms:
1. Authors retain copyright and grant the series right of first publication with the work simultaneously licensed under a Creative Commons
Attribution License that allows others to share the work with an acknowledgment of the work's authorship and initial publication in this
series.
2. Authors are able to enter into separate, additional contractual arrangements for the non-exclusive distribution of the series's published
version of the work (e.g., post it to an institutional repository or publish it in a book), with an acknowledgment of its initial
publication in this series.
3. Authors are permitted and encouraged to post their work online (e.g., in institutional repositories or on their website) prior to and
during the submission process, as it can lead to productive exchanges, as well as earlier and greater citation of published work (See
Open access policy for details).
References
[1]. Shah, M. H., Yaqoub, M., Wu, Z. J.: Post-pandemic Impacts of COVID-19 on Film Industry Worldwide and in China. Global Media Journal: Pakistan Edition, 13(2) (2020).
[2]. Johnson, M.: Hollywood survival strategies in the post-COVID 19 era. Humanities and Social Sciences Communications, 8(1), 1-8 (2021).
[3]. Höhler, J., Lansink, A. O.: Measuring the impact of COVID‐19 on stock prices and profits in the food supply chain. Agribusiness, 37(1), 171-186 (2021).
[4]. Størdal, S., Lien, G., Trømborg, E.: Impacts of infectious disease outbreaks on firm performance and risk: The forest industries during the COVID-19 pandemic. Journal of Risk and Financial Management, 14(7), 318 (2021).
[5]. Fan, S.: Empirical study of the traditional Chinese medicine industry based on CAPM. China’s collective economy, 17, 66-68 (2021).
[6]. Zou, Z., Wang, X.: Research on the investment value of China’s medical sector in the context of COVID-19. Economic Research-Ekonomska Istraživanja, 36(1), 614-633 (2023).
[7]. Susanti, E., Grace, E., Ervina, N.: The investing decisions during the Covid-19 PANDEMIC by using the capital asset pricing Model (CAPM) method in lq 45 INDEX COMPANIES. International Journal of Science, Technology & Management, 1(4), 409-420 (2020).
[8]. Lintner, J.: Security prices, risk, and maximal gains from diversification. The journal of finance, 20(4), 587-615 (1965).
[9]. Sharpe, W. F.: Capital asset prices: A theory of market equilibrium under conditions of risk. The journal of finance, 19(3), 425-442 (1964).
[10]. Zhang, L.: Empirical research on the constituent stocks of China's Shanghai Stock Exchange 50 Index - Based on the CAPM model and Fama-French three-factor model. Economic Research Navigator, 26, 78-80 (2022).
[11]. Kienitz, J., Wetterau, D.: Financial modelling: Theory, implementation and practice with MATLAB source. John Wiley & Sons, 2013.
[12]. Perold, A. F.: The capital asset pricing model. Journal of economic perspectives, 18(3), 3-24 (2004).
[13]. Roll, R.: A critique of the asset pricing theory's tests Part I: On past and potential testability of the theory. Journal of financial economics, 4(2), 129-176 (1977).
[14]. Zhao, J.: A brief discussion on the role and limitations of β in the CAPM model. Theoretical Studies, 20, 141-142 (2012).