


1. Essential Concepts: An Introduction
Contemporarily, the technology industry is one of the most dynamic and lucrative in the world due to technological advancements and innovation shift. The innovation and expansion of the technology sector attracts customers, investors, and analysts. During the 1990s, these investors and analysts have capitalized stock market assets using financial computer systems and artificial intelligence (AI) in the technology business [1]. The importance of stock market price forecasting is based on financial profits and the enormous potential of stock market performance estimates [2]. Since client demand, product innovation, and market competition fluctuate rapidly, investors and analysts utilize stock price forecasts to buy and sell tech stocks. This paper predicts the stock prices of Apple, Microsoft, and Amazon.
Apple, Microsoft, and Amazon are the largest technology companies in market capitalization. iPhone, MacBook, and iOS are the foundations for Apple's success. Windows and Office are produced by Microsoft. Amazon was an early innovator in e-commerce and now provides cloud computing and artificial intelligence. The stock prices of all three corporations have increased due to their solid financial performance. In 2020, Apple's market value and stock price increased by $1 trillion and 81%, respectively, while those of Microsoft and Amazon increased by $480 billion and $710 billion, respectively [3]. Investors have attempted to predict stock price movements to mitigate losses resulting from the unpredictability and volatility of stock prices [4] and the nonlinear, dynamic, and chaotic cost of financial assets [5]. Unfortunately, no such system can precisely predict market patterns, but academics are striving to increase the prediction potential of the model [4]. Programmable forecasting algorithms can make more accurate stock price predictions [6]. AI has revolutionized models for predicting stock prices. Based on historical stock data, artificial intelligence can predict stock market trends. AI can improve its predictions through machine learning. In numerous situations, machine learning may identify complex patterns [5].
Machine learning and deep learning were advised to improve the model's stock price forecasts [4]. According to the projections of twelve of India's largest firms for 2015–2021, the best predictor of stock prices is long-term short-term memory. RMSE, SMAPE, and \( {R^{2}} \) Using an artificial neural network and a random forest, [6] was able to estimate the closing prices of five businesses in distinct industries. RMSE and MAPE data indicate that ANN is superior for predicting stock prices. Random forests are also viable. Frequent usage of random forest categorization in development. Streamlining data collection enhances prediction precision [7]. In contrast, random forest is a classification model. RF. Most accurate [8]. Ref. [7] analyzed free datasets with R. These databases contain statistics for numerous disciplines. For datasets with numerous predictor factors, random forest modeling is beneficial. The experiment decreased computing time and several variables and increased AUC. Scholars also proposed an LSTM and XGBoost-based hybrid time series model [9]. The test set for XGBoost training and prediction consists of the prediction results for each time series column attribute. Changing model parameters continuously produces the most accurate prediction models and results. Emotions influence the stock market. Using StockTwits data from five technology-product companies, researchers examined the impact of sentiment on stock price changes [10]. It employs the Naive Bayes algorithm, SVM, and logistic regression. According to the model, sentiment data increases the precision of stock price predictions.
The organization of this paper is as follows. The Sec. 2 discusses the stock prices of three technological companies during the past five years, the three models utilized, and several methods for evaluating the accuracy of the models' predictions. The Sec. 3 presents the outcomes, examines the outcomes, and compares actual and forecasted data with the diagram. The practical constraints of this prognosis and prospects for the field are discussed in Sec. 4. In Sec. 5, the results of the entire text are summarized, and the significance of this work to the field of research is discussed.
2. Data & Method
This research uses data from Yahoo finance. The three technology companies' data gathering began on January 1, 2018 and ended on February 1, 2023. In this paper, the dependent variable is the 3-day stock price forecast, and the independent variables are the historical transaction price and volume, as well as technical indicators, including relative strength index (RSI), moving average convergence divergence (MACD), and Stochastic (KDJ). These indicators can assist analysts in identifying short-term and long-term price variations and in predicting future price movements. Three models will be utilized in this paper: Ordinary Least Square, Random Forest, and Extreme Gradient Boosting.
Through using ordinary least squares model (OLS), a linear regression model, the line of best fit is determined. The best-fitting line minimizes squared discrepancies between expected and observed values. OLS models determine the slope and intercept of the data-fitting line. The linear OLS model assumes that the dependent and independent variables have a linear relationship. OLS is a straightforward linear regression model suitable for small data sets. Changing input variables also affects projected outcomes. Financial institutions illustrate this model's flaws. The relationship between the stock price and the independent variables that determine it is typically nonlinear. The OLS model allows the performance of more advanced models to be compared. Residual sum of squares is the number obtained by adding the squares of all error values, \( \hat{σ}_{ε}^{2} \) is value being mean square error, which can be given as follows:
\( RSS=\sum _{i=1}^{n}e_{i}^{2}, \hat{σ}_{ε}^{2}=\frac{RSS}{n-2} \) (1)
\( {\hat{β}_{1}}=\frac{\sum ({x_{i}}-\bar{x})({y_{i}}-\bar{y})}{\sum {({x_{i}}-\bar{x})^{2}}} \) , \( {\hat{β}_{0}}=\bar{y}-{\hat{β}_{1}}\bar{x} \) (2)
This denominator is the sample size minus the number of parameters the model is trying to estimate. This regression model has two unknown parameters ( \( {\hat{β}_{1}} and {\hat{β}_{0}} \) ). Random forest models based on ensemble learning are nonlinear regression models. Ensembles of multi-prediction trees are effective. Contrasting random forests, decision trees reveal decision-making from root to leaf. Random forest-based decision tree forecast. Random forest models benefit. The model organizes and picks essential features from high-dimensional and multi-featured data with ease. Many decision trees plan for nonlinear interactions. Random subsets of numerous decision trees and random samples prohibit the random forest model from fitting data to tiny sample sizes. When a sophisticated model performs well on training data but poorly on new data, this is known as overfitting. The random forest is flawed. Without sufficient data, the random forest model may produce inaccurate predictions. Missing node values in a decision tree may result in inaccurate predictions. They can determine the optimum branch for the forest by calculating the difference between each node's projected and actual value using mean square error (MSE). The reduction of MSE improves model performance.
This research uses \( {R^{2}} \) , MAPE, and MSE to evaluate these three models (MSE). The greater the model-data fit, the closer \( {R^{2}} \) is to 1. A high R-squared value is not necessarily indicative of a model's usefulness or quality. It must be evaluated using residual plots, coefficient significance, and performance prediction on fresh data.
\( {R^{2}}=1-\frac{sum squared regression(SSR)}{total sum of squares(SST)}=1-\frac{\sum {({y_{i}}-\hat{{y_{i}}})^{2}}}{\sum {({y_{i}}-\bar{y})^{2}}} \) (3)
MAPE is utilized to evaluate the prediction model since it measures the average percentage deviation between predicted and actual data. MAPE is the relative error between the model's actual value and its projected value, hence the size of the data set has no effect on MAPE. The closer the relative error to zero, the better.
\( MAPE=\frac{1}{n}×\sum |\frac{actual value-forecast value}{actual value}|=\frac{1}{n}×\sum _{t=1}^{n}|\frac{{A_{t}}-{F_{t}}}{{A_{t}}}| \) (4)
MSE measures the actual-predicted mean square error. Hence, it is used to evaluate the precision of regression models. \( {y_{i}} \) is the actual value, \( \hat{{y_{i}}} \) is the prediction made by the model, and n is the sample size. MSE is the square of the error, therefore as the error grows, so does MSE. If MSE is large, the performance of the model is poor, whereas if it is low, the difference between the predicted outcome and the actual value is negligible. Model performance improves as inaccuracy decreases.
\( MSE=\frac{1}{n}×\sum _{i=1}^{n}{({y_{i}}-\hat{{y_{i}}})^{2}} \) (5)
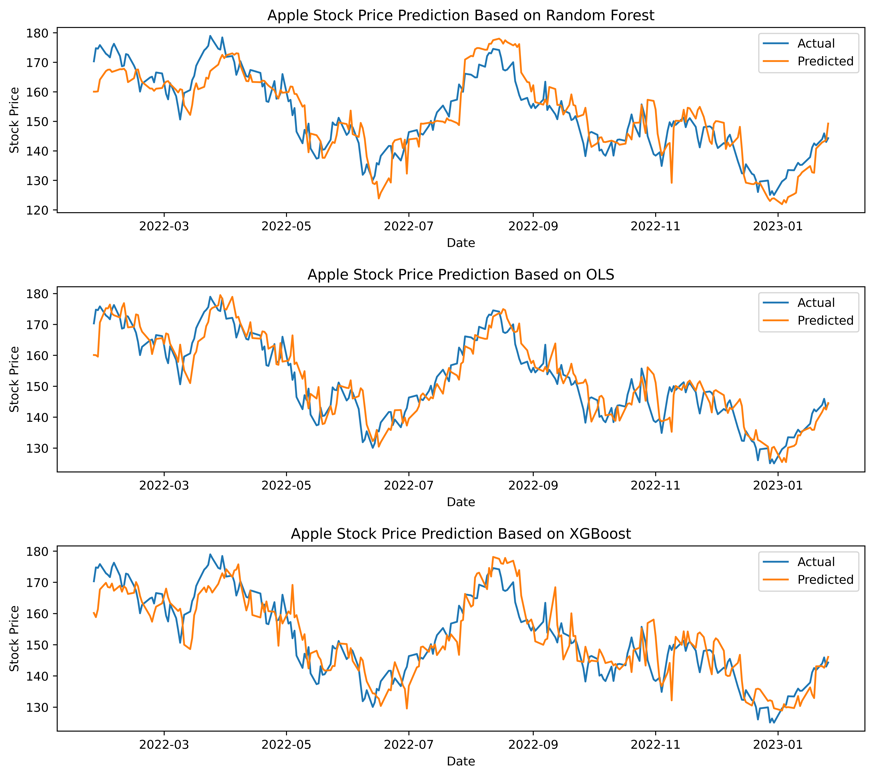
Figure 1: Graphs predicting Apple stock price with OLS, Random Forest and XGBoost.
Table. 1: Metrics for evaluating each Apple stock price prediction model.
Apple Inc. | MSE | \( {R^{2}} \) | MAPE |
OLS | 31.42 | 0.82 | 2.92% |
Random Forest | 43.40 | 0.75 | 3.49% |
XGBoost | 44.77 | 0.74 | 3.52% |
3. Results & Discussion
The projected stock price of the first business, Apple, can be determined by comparing the three expected and actual numbers. The OLS model's prediction results are closer to the real value than those of the random forest model and the XGBoost model. In the peaks around April, June, and August 2022, the predicted value does not match the actual value in the random forest comparison Fig. 1. Even a few excessive differences result in a substantial gap between the two lines. This tendency may also be observed in the comparison graph of XGBoost, albeit the situation appears slightly more favorable than in the random forest graph. According to the Table.1, the MSE value of the OLS model is the smallest, with a value of just 31.42, which is more than ten times smaller than the MSE values of the other two models. Random forest and XGBoost achieved MSE values of 43.40 and 44.77, respectively. The smaller the MSE number, the less the difference between the projected result and the actual value, and the higher the model's performance. Then, the value of the second indicator, \( {R^{2}} \) , reached 0.82, which was roughly 0.7 and 0.8 greater than Random Forest and XGBoost, respectively. The greater the matching degree, the closer the \( {R^{2}} \) value is to 1. In terms of MAPE, the MAPE value of the OLS model is 2.92 percent, while the random forest and XGBoost have MAPE values near 3.5 percent. The closer the MAPE value is to zero, the less the model's error. The evaluation measures provide additional support for the hypotheses drawn from Fig. 1.
Table 2: Metrics for evaluating each Microsoft stock price prediction model.
Microsoft Corporation | MSE | \( {R^{2}} \) | MAPE |
OLS | 95.68 | 0.84 | 3.00% |
Random Forest | 166.39 | 0.72 | 3.94% |
XGBoost | 115.51 | 0.80 | 3.28% |
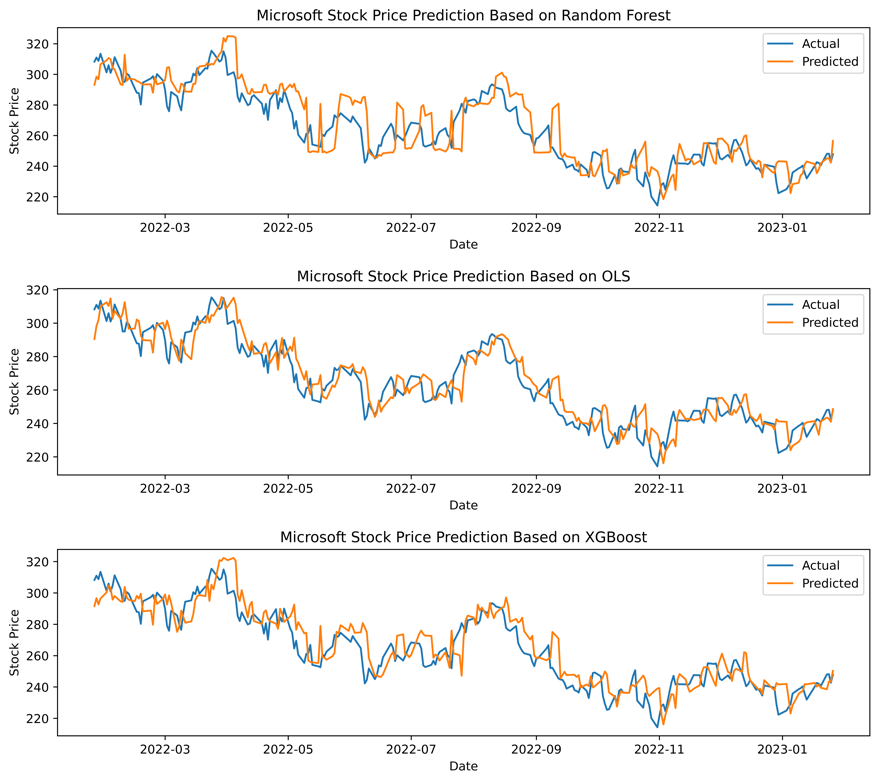
Figure 2: Graphs predicting Microsoft stock price with OLS, Random Forest and XGBoost.
Microsoft, the second-largest technology business by market capitalization, may also observe the distinction between the three comparison graphs from Fig.2. The OLS model fits the data better than random forest and XGBoost. Based on the examination of these three models using the three evaluation markers in the Table.2, it can be shown that OLS has the minimum MSE value, at just 95.68. In contrast, the random forest and XGBoost models both exceeded 110, with the random forest model reaching 166.39. The \( {R^{2}} \) and MAPE values for OLS were 0.84 and 3%, respectively. In predicting the stock price of Microsoft, OLS performs better than the other two models.
Amazon is the final firm, and its three-stock price projection comparison graphs from Fig.3 are distinct from those of the first two corporations. This is exemplified by the fact that comparing the OLS model and the other two companies is straightforward when directly observing and determining which comparison chart model is superior. Uncertainty within the XGBoost model. In this instance, Fig.3 frequently uses the data to convey the solution explicitly. According to the data in Table.3, the value of OLS in the MSE column represents the best performance. In the \( {R^{2}} \) column, the difference in \( {R^{2}} \) values between OLS and XGBoost is only 0.02, while the \( {R^{2}} \) value of OLS is astoundingly 0.91. In the final column of MAPE, the OLS value remains the smallest. The MAPE value of OLS is 4.49 percent, which is only 0.61 percent less than that of XGBoost, which is 5.10 percent. By visualization and data display, the comparison graph from Fig.3 of the predicted value, the actual value, and Table.3 demonstrates that the OLS model is the most accurate in predicting these three technology companies.
This research’s results do not indicate that the OLS model outperforms the random forest and XGBoost models in terms of prediction. Only in this research, based on the assumption of a limited sample size, is the OLS model able to fit the data without introducing excessive complexity. In the case of tiny data sets, ensemble learning techniques such as random forest and XGBoost may overfit, resulting in poor predictions. This is especially true for the data set presented in this research, which is only five years old. In machine learning, deep learning algorithms, and financial stock markets, a large number of data points may be generated daily, and an enormous amount of data is generated every minute and second. The five-year daily data set has fewer than 2,000 data points and is therefore considered a small data set. On the other hand, the sorts of these models also vary. Various models can cause them to behave differently in different scenarios. In general, OLS is a simple linear regression model applicable to linear data and data satisfying the assumption of normal distribution. Random forest and XGBoost are both integrated learning models suited for nonlinear and high-dimensional data. Random forest is more applicable to classification difficulties than XGBoost is to regression problems.
At the conclusion of the discussion portion, the paper will include recommendations for future price forecasting models. First, the dataset should include more relevant characteristics of the data sources, as using more data sources and characteristics will increase the model's prediction performance. Examples include the use of price-related macroeconomic indicators and market data, inflation rates, stock indexes, etc., as well as financial indicators and fundamental data pertaining to a particular company, such as revenue, profit, etc. This information can be utilized to develop more exhaustive and precise models. The selection of alternative models and parameters based on the linearity or nonlinearity of the data set is a second factor to be considered when choosing models. Next, for each model type, several parameter combinations can be tested to determine the optimal prediction outcomes. In machine learning models, random forests, neural networks, etc., can be utilized. In the random forest model, objective and max depth are usable parameters. Then, the integrated learning approach can be employed to enhance the performance of model prediction. This strategy is based on the notion of combining numerous prediction models. Various models have different advantages and downsides. For certain data sets and issues, it may be required to mix many models to achieve the best outcomes. After constructing an appropriate model, the models must then undergo model evaluation and validation to ensure prediction performance and model reliability.
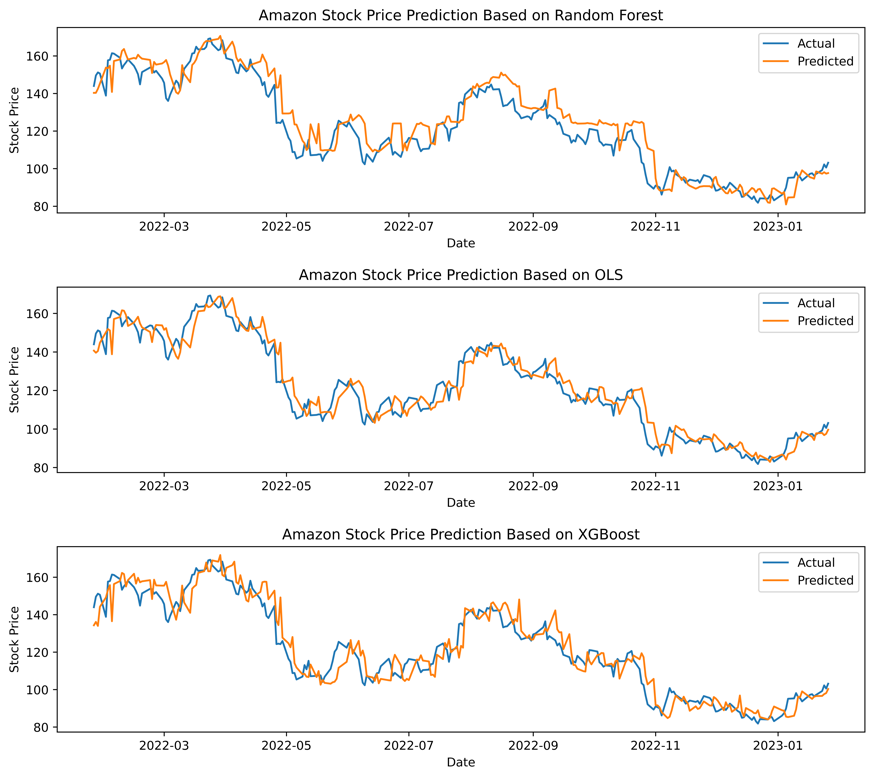
Figure 3: Graphs predicting Amazon stock price with OLS, Random Forest and XGBoost.
Table 3: Metrics for evaluating each Apple stock price prediction model.
Amazon.com, Inc. | MSE | \( {R^{2}} \) | MAPE |
OLS | 47.16 | 0.91 | 4.49% |
Random Forest | 80.08 | 0.86 | 5.94% |
XGBoost | 62.21 | 0.89 | 5.10% |
4. Limitations & Prospects
This research has certain drawbacks. First, the frequency of data utilized in this research is relatively low; only daily stock transaction data is employed. However, for some technology businesses, daily stock price variations may be too frequent, and daily data may not be able to adequately reflect real-time stock price changes; hence, higher-frequency data are required for research purposes. The prediction models utilized in this research are conventional models based on statistical approaches, such as the random forest model and the OLS model of linear regression. Owing to the complexity and high uncertainty of technology company stock prices, however, it is possible that these models do not sufficiently capture the complexity of stock price fluctuations. Future research can utilize advanced models such as deep learning, convolutional neural networks, extended short-term memory networks, etc. to handle this issue more effectively. On the other hand, the stock market is affected by the unpredictability of external factors, e.g., political, environmental, and macroeconomic concerns. In addition, it may entail unclear factors within technology firms. The stock price of technology companies may be influenced by industry competition and internal management. The price of a company's stock may rise due to effective internal management and operations, and vice versa. Decline. Thus, a more comprehensive analysis is necessary during the investigation. In contrast, the extreme volatility of the stock market has led to an unstable market sentiment. Once many investors sell the stock, the price will drop precipitously, which is impossible to foresee.
With the rapid growth of technology firms and the maturation of data science technology, it is likely that more research will be conducted to apply more powerful machine learning and artificial intelligence technology to anticipate the stock price trend of technology companies. For instance, technology such as deep learning and natural language processing can better evaluate and comprehend complicated market conditions and corporate operations, allowing for more accurate forecasts of future stock price movement. In addition, future research can investigate how blockchain technology might be utilized to increase the precision and security of stock price forecasts. Blockchain can guarantee the immutability and traceability of data, thereby enhancing the security and dependability of stock transactions and the veracity and precision of stock price projections.
5. Conclusion
This research predicts the stock prices of three technical industries utilizing three models: OLS, Random Forest, and XGBoost. The research uses the company's daily closing prices over the past five years. OLS outperformed random forest and XGBoost in predicting the stock prices of corporations. Nonetheless, this research has drawbacks. This research is constrained by the frequency of data collection. More than five years of daily data on the stock market may be required to depict its intricate dynamics. More frequent or extensive historical data could increase model precision in future experiments. Model selection is a further limitation of this investigation. The OLS model performed better in this experiment, although deeper learning models may do better. Future studies could analyze a variety of methodologies, such as deep learning algorithms, to determine the optimal stock price prediction model. The accuracy of stock price forecasts may increase with more frequent data or more sophisticated machine learning algorithms. Yet, changes in the stock market and technology will bring new difficulties and opportunities for future research. To better estimate the stock values of technology companies and to provide investors and scholars with more accurate and reliable suggestions, people must continuously explore new research avenues and approaches and exercise caution. Overall, these results offer investors guidance for discovering further stock price predictions in the field of machine learning.
References
[1]. Ferreira, F. G., Gandomi, A. H., Cardoso, R. T.: Artificial intelligence applied to stock market trading: a review. IEEE Access, 9, 30898-30917 (2021).
[2]. Zhang, F.: Extreme learning machine for stock price prediction. The International Journal of Electrical Engineering & Education, 0020720920984675 (2021).
[3]. Official website for academic of NSSD. Retrieved from: https://www.nssd.cn/html/1/156/159/index.html?lngId=JGLLYSJ2022002027, last accessed 2023/2/21.
[4]. Bansal, M., Goyal, A., & Choudhary, A.: Stock Market Prediction with High Accuracy using Machine Learning Techniques. Procedia Computer Science, 215, 247-265 (2022).
[5]. Henrique, B. M., Sobreiro, V. A., Kimura, H.: Literature review: Machine learning techniques applied to financial market prediction. Expert Systems with Applications, 124, 226-251 (2019).
[6]. Vijh, M., Chandola, D., Tikkiwal, V. A., Kumar, A.: Stock closing price prediction using machine learning techniques. Procedia computer science, 167, 599-606 (2020).
[7]. Speiser, J. L., Miller, M. E., Tooze, J., Ip, E.: A comparison of random forest variable selection methods for classification prediction modeling. Expert systems with applications, 134, 93-101 (2019).
[8]. Fernández-Delgado, M., Cernadas, E., Barro, S., Amorim, D.: Do we need hundreds of classifiers to solve real world classification problems? The journal of machine learning research, 15(1), 3133-3181 (2014).
[9]. Yu, S., Tian, L., Liu, Y., Guo, Y.: LSTM-XGBoost Application of the Model to the Prediction of Stock Price. In Artificial Intelligence and Security: 7th International Conference, ICAIS 2021, Dublin, Ireland, July 19–23, 2021, Proceedings, Part I 7 (pp. 86-98). Springer International Publishing, (2021).
[10]. Gupta, R., Chen, M.: Sentiment analysis for stock price prediction. In 2020 IEEE conference on multimedia information processing and retrieval (MIPR) (pp. 213-218). IEEE (2020, August).
Cite this article
Guo,C. (2023). Technology Industry Stock Price Prediction Based on OLS, Random Forest, and Extreme Gradient Boosting. Advances in Economics, Management and Political Sciences,22,1-8.
Data availability
The datasets used and/or analyzed during the current study will be available from the authors upon reasonable request.
Disclaimer/Publisher's Note
The statements, opinions and data contained in all publications are solely those of the individual author(s) and contributor(s) and not of EWA Publishing and/or the editor(s). EWA Publishing and/or the editor(s) disclaim responsibility for any injury to people or property resulting from any ideas, methods, instructions or products referred to in the content.
About volume
Volume title: Proceedings of the 2023 International Conference on Management Research and Economic Development
© 2024 by the author(s). Licensee EWA Publishing, Oxford, UK. This article is an open access article distributed under the terms and
conditions of the Creative Commons Attribution (CC BY) license. Authors who
publish this series agree to the following terms:
1. Authors retain copyright and grant the series right of first publication with the work simultaneously licensed under a Creative Commons
Attribution License that allows others to share the work with an acknowledgment of the work's authorship and initial publication in this
series.
2. Authors are able to enter into separate, additional contractual arrangements for the non-exclusive distribution of the series's published
version of the work (e.g., post it to an institutional repository or publish it in a book), with an acknowledgment of its initial
publication in this series.
3. Authors are permitted and encouraged to post their work online (e.g., in institutional repositories or on their website) prior to and
during the submission process, as it can lead to productive exchanges, as well as earlier and greater citation of published work (See
Open access policy for details).
References
[1]. Ferreira, F. G., Gandomi, A. H., Cardoso, R. T.: Artificial intelligence applied to stock market trading: a review. IEEE Access, 9, 30898-30917 (2021).
[2]. Zhang, F.: Extreme learning machine for stock price prediction. The International Journal of Electrical Engineering & Education, 0020720920984675 (2021).
[3]. Official website for academic of NSSD. Retrieved from: https://www.nssd.cn/html/1/156/159/index.html?lngId=JGLLYSJ2022002027, last accessed 2023/2/21.
[4]. Bansal, M., Goyal, A., & Choudhary, A.: Stock Market Prediction with High Accuracy using Machine Learning Techniques. Procedia Computer Science, 215, 247-265 (2022).
[5]. Henrique, B. M., Sobreiro, V. A., Kimura, H.: Literature review: Machine learning techniques applied to financial market prediction. Expert Systems with Applications, 124, 226-251 (2019).
[6]. Vijh, M., Chandola, D., Tikkiwal, V. A., Kumar, A.: Stock closing price prediction using machine learning techniques. Procedia computer science, 167, 599-606 (2020).
[7]. Speiser, J. L., Miller, M. E., Tooze, J., Ip, E.: A comparison of random forest variable selection methods for classification prediction modeling. Expert systems with applications, 134, 93-101 (2019).
[8]. Fernández-Delgado, M., Cernadas, E., Barro, S., Amorim, D.: Do we need hundreds of classifiers to solve real world classification problems? The journal of machine learning research, 15(1), 3133-3181 (2014).
[9]. Yu, S., Tian, L., Liu, Y., Guo, Y.: LSTM-XGBoost Application of the Model to the Prediction of Stock Price. In Artificial Intelligence and Security: 7th International Conference, ICAIS 2021, Dublin, Ireland, July 19–23, 2021, Proceedings, Part I 7 (pp. 86-98). Springer International Publishing, (2021).
[10]. Gupta, R., Chen, M.: Sentiment analysis for stock price prediction. In 2020 IEEE conference on multimedia information processing and retrieval (MIPR) (pp. 213-218). IEEE (2020, August).