


1. Introduction
BCG’s full title is The Boston Consulting Group. This is a growth share matrix established by Bruce Doolin Henderson for Boston Consulting in 1970 [1]. The matrix provides a very concise but clear tool for the improvement of strategies to run their business profitably and have a balanced output [2]. The BCG Matrix is the process of examining the market share of a product within a company. The market share and market growth rate are its two dimensions. The horizontal axis represents the market share, and the vertical axis represents the market growth rate. The BCG Matrix divides the business products into four quadrants (‘Stars’, ‘Question Marks’, ‘Cash Cows’, ‘Dogs’), plans the products, and ensures the enterprise’s resources can be allocated reasonably and effectively [3]. In previous studies, the authors have described the rise and development of BCG Matrix, the characteristics of each portfolio and the companies they represent, and have compiled data on the impact of BCG on decision-making [4]. The paper combines the basic features of the BCG Matrix and its continuous development and refinement, which will further investigate the application of the matrix in business operations and strategic choices. The goal of the current paper, given the background described above, is to accurately analyze the company's position in relation to its various products and businesses and, in addition, to develop strategies that correspond to those various products and businesses in order to concentrate the company's resources and increase its competitiveness in its industry [5]. The results of the study can help companies allocate resources effectively when developing product management and marketing strategies, taking target market shares and growth rates into account.
2. The Choice of Business Strategies in BCG Matrix
The following options are available to companies with different types of business units in the matrix:
Development. The aim of the strategy is to increase the market share of strategic business units. To achieve this goal, companies even give up near-term revenues. This strategy is particularly applicable to question mark businesses, which must grow their market share significantly if they are to become star businesses. In the case of star categories, they also have to be further developed with increased investment [6].
Maintenance. The objective is to maintain the market share of the strategic business units. This objective applies to strong cash cow businesses, allowing them to continue to generate significant cash flows, maintain a large market share and provide cash flows for other businesses.
Harvest. The objective is to increase the short-term cash generation of strategic business units, regardless of the long-term impact. This strategy is suitable for cash cow businesses that are in a poor position, where the outlook is bleak and the business needs to generate significant cash receipts from them. The harvesting strategy is also suitable for question mark businesses with no growth prospects and for dog businesses.
Abandonment. The objective is to sell or liquidate the business to lighten the load so that resources can be diverted to more profitable areas. It applies to unprofitable dogs and question mark businesses, which are often a drag on the company’s bottom line.
3. Explanation of the BCG Matrix Under the Choice of Strategies
 The specific performance in the companies four portfolio of Question Marks, Stars, Cash Cows, and Dogs specific performance in the company are given as follows [7]:
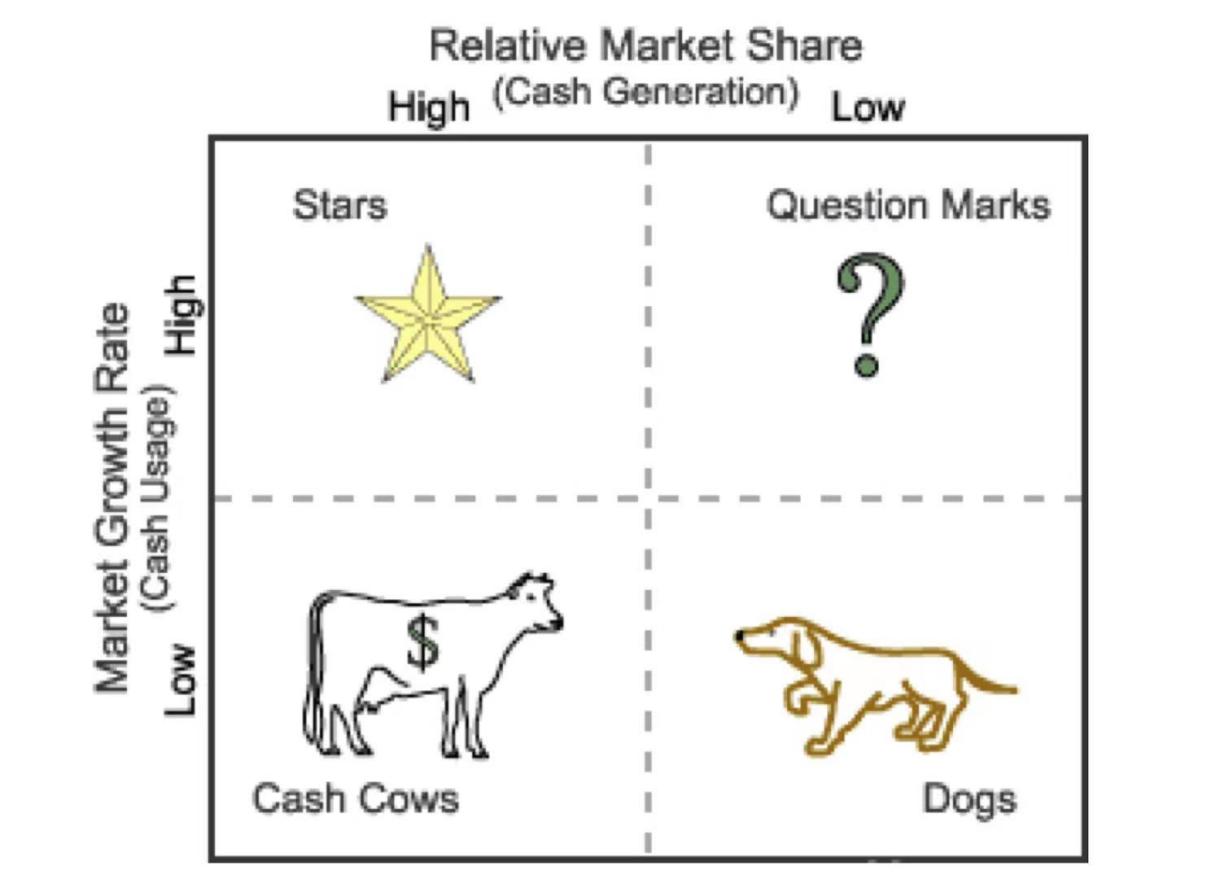
Figure 1: The BCG matrix [2].
Question Marks. Business units or operations with high growth rates and low market shares (Figure 1). The product has a good future, but the market share is relatively low [7]. They require a higher investment of resources to catch up with competitors and keep up with market growth, but their own growth prospects are not sufficiently clear.
If the future of the product is good, but the market share is relatively low, then the company should identify the cause of the problem and make improvements on this basis. At the same time, companies need to identify which products have the most advantages and which products could be improved to become star products. Then the company should invest more in publicity to increase its market share so that the product in question can be further developed into a star product.
If the future of the product is bleak, it may even become a dog business, the company needs to choose their options carefully, then harvest or abandon the product at the right time, avoiding further financial loss.
Stars. It indicates that both the growth markets and market share are in the highest position. The product is in its formative periods and has strong market competitiveness. A successful question mark business will become a star business as it gains market share. Generally, they still require a significant investment of resources from the business to keep up with the growth of the market and to compete in it.
Companies should further increase their investment to help products mature and to gradually move star products toward cash cow products. The development strategy for star products should prioritize long-term gains, expand the product’s market potential and size, and enhance competitive advantage and market share.
Cash cows. The products are in a low growth market with a high market share. The product is maturing and the high margins are generating a steady stream of revenue.
The company no longer needs to invest a large amount of funds to expand its product market. At this point, the cash flow generated by the business can be used to support other businesses that require more investment. Therefore, for the Cash Cow product, a harvesting strategy can be used, companies should reduce the amount of money invested as much as possible and try to make short-term, efficient profits to fund other products.
Dogs. The products that both growth and market share are in low position. It is clear that the product has declined and is not competitive in its target market. Companies should think about phasing out dog items and reducing manufacturing for this product. Products for dogs should employ abandonment techniques. The remaining resources should be diverted to other items, and those with extremely poor sales growth and market share should be abandoned right away.
4. Product Lifecycle Theory in BCG Matrix
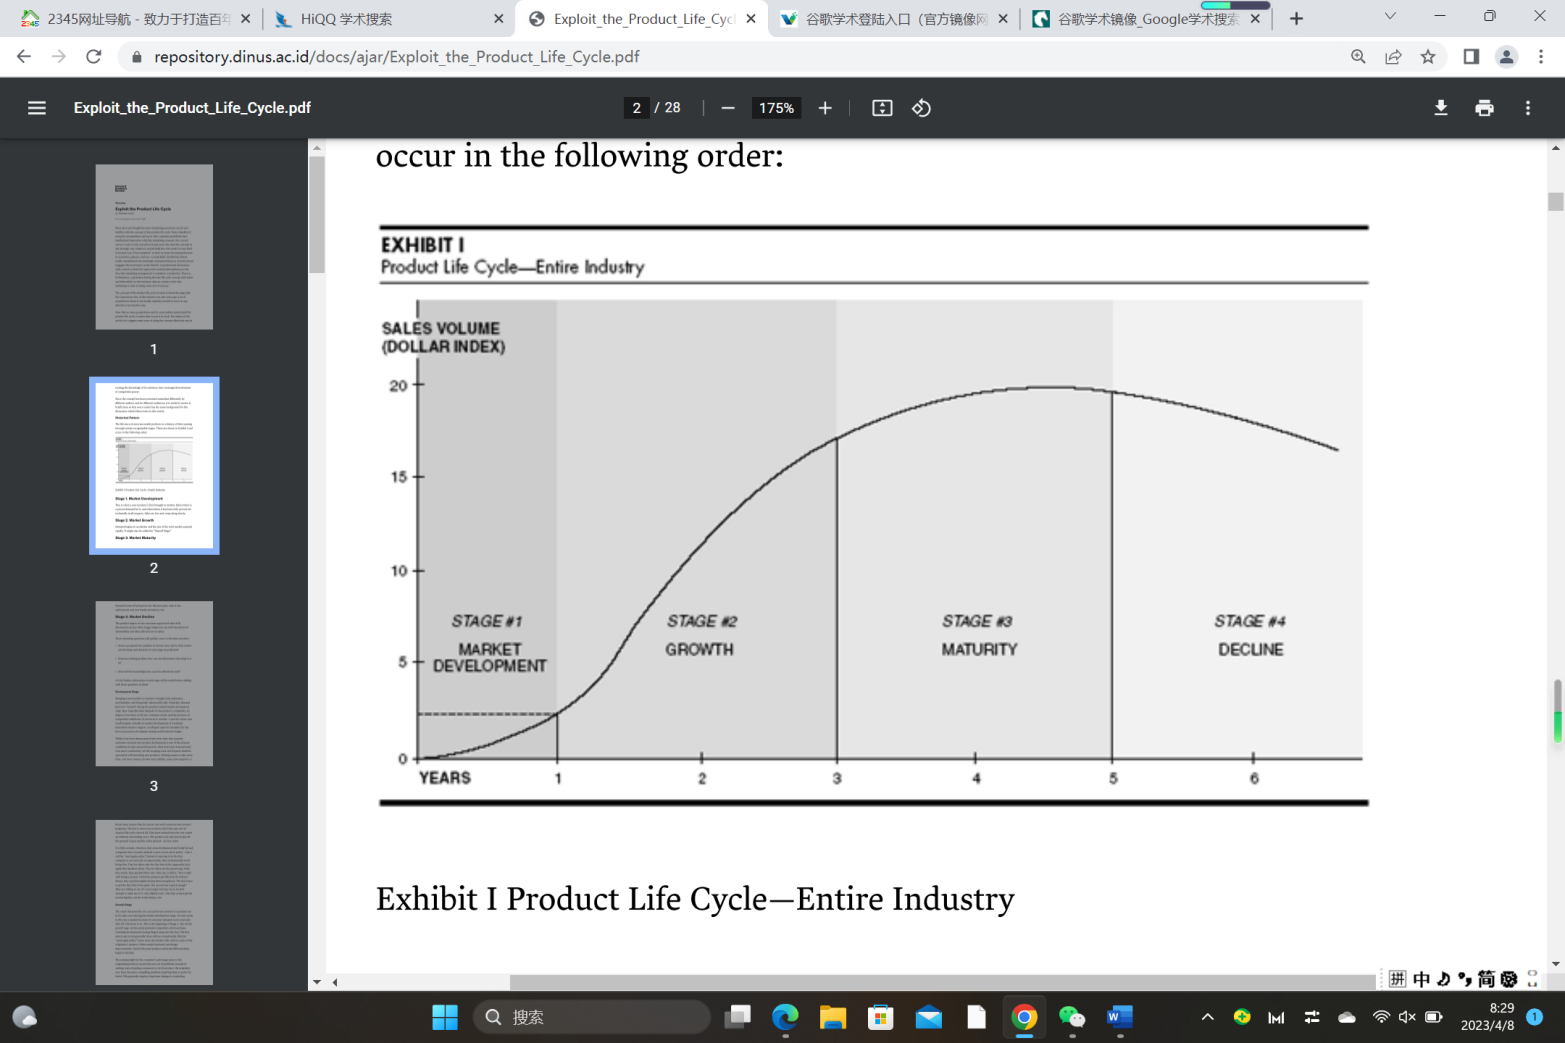
Figure 2: The product lifecycle [8].
Due to changes in the business environment, the position of business units in the matrix changes from time to time (economic cycle or product life cycle) and from space (market) to space. The position of the business unit in the matrix changes from time to time (the economic cycle or product life cycle) and from space (market) to space (market). Even very successful business units have a life cycle, as shown in Figure 2, every product will go through the process from introduction to decline. Similarly, in the BCG matrix, it starts as a question mark business, then becomes a star business, then a cash cow, and finally a dog. Because of this, business operators must not only examine the current position of their businesses in the matrix but also look at them from a dynamic position. The market is changing. Besides focusing on the past of each business, it is also important to look at how it is likely to develop in the future. If a business is found to be developing in a slower than satisfactory manner, the company should ask managers to propose new strategic options. In a rapidly changing market environment, only by observing the product lifecycle and continuously improving the strategy can question mark products be upgraded to star products faster, star products continue to grow, and cash cow products maintain their position in the market and generate more cash flow.
5. Specific Initiatives for the Use of the Boston Matrix
Delineate the business strategy. The BCG Matrix is designed to integrate the business resources of a company’s products and analysis their potential for future product development [9]. At the same time, the division of the strategy needs to be integrated with the market and the product. First of all, it needs to be attuned to market demand and be market-driven. The products produced must also be practical and linked to the main business lines and objectives.
Determine the size of each strategic business unit. Each strategic business unit will be based on the characteristics of its products, the needs of the market, the organization’s structure, and other factors that should be studied to determine the product’s corresponding target market. In case it is detached from reality, contrary to market demand and consumer needs.
This will help to build strategic business units and guide the company’s resources to invest in profitable and high-market products, while reducing the risks brought about by market changes and increasing the competitiveness of core products in the target market [10]. By doing this, the company’s core products will be more competitive and dominant in the target market. Moreover, unnecessary or redundant structural departments are required to be reduced, and internal cohesion will be improved.
Regular review of the implementation of the business strategy is to adjust the strategy timely. The rapid development of the market has brought uncertainty and variability. Only by regularly following up on the implementation of business strategies and providing timely and effective feedback to enterprises can they help them survive in the fierce market. The company should make greater efforts to organize strategic business units to conduct research and analysis of the industry, compile the overall strategic plan of the enterprise, and plan the activities of each strategic management unit while reasonably allocating the internal resources of the enterprise. The focus of each strategic business unit should be adjusted appropriately according to market changes and product life cycles in order to respond to market changes and product declines.
6. Limitation of the BCG Matrix
Although the BCG matrix is a very effective analytical tool when developing different growth strategies for different business units, it still has some limitations [11].
The external environment is changing quickly, and the BCG matrix is built on an experience curve for which a reasonably stable environment is a necessary condition. A company’s cumulative experience can only efficiently cut manufacturing costs in a stable environment, increasing its competitive edge.
However, with the rapid spread of economic globalization and new technologies, the external environment of the company is rapidly changing. These changes pose challenges to the effectiveness of the empirical curve, and therefore the effectiveness of the BCG matrix.
“Cost leadership strategies” are not the only source of competitive advantage for a company. The BCG matrix’s underlying assumption for market share is “cost leadership strategy,” which can be taken into account when a company is ready to implement a cost leadership strategy across all of its businesses but not when it is also ready to implement a differentiation strategy in some of those businesses.
The assumptions of the BCG matrix are primarily based on the experience curve, but in fact the BCG matrix also implicitly assumes that the performance relationships between the business units within the company are uncorrelated. Only if they are uncorrelated is the company free to make decisions about whether to recover or discontinue investments in each business unit. Relationships between business units within a company are often correlated. This phenomenon occurs particularly in companies based on a concentric diversification strategy, where resources such as technology and channels are often shared between business units; internal financing is also often available between business units. The correlation between the performance of the business units within a company makes it difficult for the company to make decisions about each business unit based on the BCG matrix.
7. Conclusion
The paper begins with a basic introduction to the BCG matrix, including its rise and development, as well as the regions and measures of the matrix. Then, it presents the four product types according to the matrix, their suitable strategic models and further analyses the shift in strategy in relation to the future development of the different products. Immediately afterwards, the thesis combines product lifecycle theory with the BCG matrix. Over time, product development, maturity and decline correspond to shifts in product type in the BCG matrix. Further on, the thesis puts the BCG matrix into the context of a company’s strategic planning and selection, and explains how this can help the company. Finally, the thesis discusses the flaws and shortcomings of the BCG matrix, which is not applicable to all companies, and shows that there is still much room for development. With the help of BCG Matrix, corporate strategies and products are closely linked, companies are able to tailor strategies for different businesses to maximize the benefits of the product, in the face of fierce competition. The study certainly has limitations and weaknesses, like all research studies. For example, the study only analyzes the use of the BCG matrices by companies for strategic choices and business plan planning from a macro perspective and does not specifically discuss in detail the differences in application models of BCG matrices in different industries, such as manufacturing and high-tech industries. Therefore, more future research papers that focus on BCG matrix micro-level applications are needed to enrich and elaborate the present study.
References
[1]. Madsen D O. Not dead yet: the rise, fall and persistence of the BCG Matrix [J]. Problems and Perspectives in Management, 15(1): 19-34. (2017).
[2]. Mohajan, H. K.. "An Analysis on BCG Growth Sharing Matrix." MPRA Paper (2017)..
[3]. Reeves M, Moose S, Venema T. The growth share matrix [J]. BCG–The Boston Consulting Group, 2014.
[4]. Armstrong J S, Brodie R J. Effects of portfolio planning methods on decision making: Experimental results [J]. International Journal of Research in Marketing, 11(1): 73-84. (1994).
[5]. Morrison, Alan, and Robin Wensley. “Boxing up or boxed in?: A short history of the Boston Consulting Group share/growth matrix.” Journal of Marketing Management 7(2), 105-129. (1991).
[6]. Song Yixiang. Understanding and application of Boston matrix [J]. China High-Tech Enterprise,(16):13. (2008).
[7]. Wang Chuanji. Product portfolio analysis based on Boston matrix [J]. Business, (35):115. (2015).
[8]. Levitt T. Exploit the product life cycle [M]. Graduate School of Business Administration, Harvard University, 1965.
[9]. Yu Dan. A study of corporate strategy based on Boston matrix [J]. China Collective Economy, (24):39-40. (2021).
[10]. Kuvaeva, T., and E. Urgel. “THE BCG MATRIX.”
[11]. Dai Zhishen. Rethinking the limitations of the Boston Matrix [J]. Business Times, (14):78+53. (2010).
Cite this article
Pan,X. (2023). An Analysis of the Strategies Applied to the Different Strategic Business Units of the BCG Matrix. Advances in Economics, Management and Political Sciences,26,373-378.
Data availability
The datasets used and/or analyzed during the current study will be available from the authors upon reasonable request.
Disclaimer/Publisher's Note
The statements, opinions and data contained in all publications are solely those of the individual author(s) and contributor(s) and not of EWA Publishing and/or the editor(s). EWA Publishing and/or the editor(s) disclaim responsibility for any injury to people or property resulting from any ideas, methods, instructions or products referred to in the content.
About volume
Volume title: Proceedings of the 2023 International Conference on Management Research and Economic Development
© 2024 by the author(s). Licensee EWA Publishing, Oxford, UK. This article is an open access article distributed under the terms and
conditions of the Creative Commons Attribution (CC BY) license. Authors who
publish this series agree to the following terms:
1. Authors retain copyright and grant the series right of first publication with the work simultaneously licensed under a Creative Commons
Attribution License that allows others to share the work with an acknowledgment of the work's authorship and initial publication in this
series.
2. Authors are able to enter into separate, additional contractual arrangements for the non-exclusive distribution of the series's published
version of the work (e.g., post it to an institutional repository or publish it in a book), with an acknowledgment of its initial
publication in this series.
3. Authors are permitted and encouraged to post their work online (e.g., in institutional repositories or on their website) prior to and
during the submission process, as it can lead to productive exchanges, as well as earlier and greater citation of published work (See
Open access policy for details).
References
[1]. Madsen D O. Not dead yet: the rise, fall and persistence of the BCG Matrix [J]. Problems and Perspectives in Management, 15(1): 19-34. (2017).
[2]. Mohajan, H. K.. "An Analysis on BCG Growth Sharing Matrix." MPRA Paper (2017)..
[3]. Reeves M, Moose S, Venema T. The growth share matrix [J]. BCG–The Boston Consulting Group, 2014.
[4]. Armstrong J S, Brodie R J. Effects of portfolio planning methods on decision making: Experimental results [J]. International Journal of Research in Marketing, 11(1): 73-84. (1994).
[5]. Morrison, Alan, and Robin Wensley. “Boxing up or boxed in?: A short history of the Boston Consulting Group share/growth matrix.” Journal of Marketing Management 7(2), 105-129. (1991).
[6]. Song Yixiang. Understanding and application of Boston matrix [J]. China High-Tech Enterprise,(16):13. (2008).
[7]. Wang Chuanji. Product portfolio analysis based on Boston matrix [J]. Business, (35):115. (2015).
[8]. Levitt T. Exploit the product life cycle [M]. Graduate School of Business Administration, Harvard University, 1965.
[9]. Yu Dan. A study of corporate strategy based on Boston matrix [J]. China Collective Economy, (24):39-40. (2021).
[10]. Kuvaeva, T., and E. Urgel. “THE BCG MATRIX.”
[11]. Dai Zhishen. Rethinking the limitations of the Boston Matrix [J]. Business Times, (14):78+53. (2010).