


1. Introduction
A significant rise in the revenue of the video game industry can be seen clearly ever since the COVID-19 pandemic occurred, despite the decline in most of the other industries. The impact sustains even though the marginal effect of the pandemic becomes weak. Industry of video games and related products is of high potential and definitely worth attention due to its rapid-growing market value, wide range of product genre, and most importantly, distinctive characteristics as video game products.
In general, the firms in the industry are in a state of monopolistic competition, where game companies try their best to make their games different and, in some aspects, superior than that of others, and hardware companies aim to give players a full gaming experience with a complete set of devices from console and monitor to controller and headphone. The sale of hardware is in a similar pattern to other technological products, while the sale of software, the video games themselves, is much more diversified. Digitally supplied games are in infinite supply, which is also perfectly price-elastic, while game copies sold in CDs and memory cards involve marginal cost.
Although the research into the market of video games is very limited, a study has looked at the rise of gaming in the COVID-19 outbreak [1]. The changes of the sector have occurred from both the impact of pandemic and internal disruptions. Anyway, this industry is one of a few sectors that has suffered the least from the decrease in economic activity and declining markets, and as a result, it has grown even during the virus outbreak.
The research focus on the following aspects. First, the research identifies the difference between performance of the game industry and that of other general industries during the pandemic, given the hypothesis that they do react differently. Secondly, the analysis assesses effect of the pandemic crisis and related government policies on the behaviour of both hardware and software game companies. Lastly, the evaluation discusses whether there is a common trend or correlation between game market performance and typical macroeconomic policies imposed by the government.
The paper is organized as follows. Section 2 evaluates the performance of game industry by three further divisions. Section 2.1 describes the general background of video game industry, Section 2.2 correlates the impact of COVID-19 pandemic with the industrial performance, and Section 2.3 is the main division that analyses in details. Section 3 concludes the paper and discusses the future prospects of the industry.
2. Evaluation on the Performance of Video Game Industry
2.1. Background Information
A video game is an interactable electronic program that provide users with feedbacks, forming a structured playing process. The program themselves are software that can be downloaded and operated on certain electronic platforms with an input device that gives interactive commands to the game. Under this basic rule of video game operation, the video game industry mainly contains two types of products: software and hardware. In the entire video game industry, some firms specialize on either of these, while several large corporations have separated divisions for both software and hardware. Esports, short for electronic sports, is another business relying on competitive video games that game firms run to make profit.
Hardware producers provide players with personal computers (PCs) or consoles as well as a range of input and output devices such as controller, headphone, monitor, mouse, and keyboard. These equipment enables the running of games on a console or PC with full experience. Hardware is the complement to software as the games cannot be operated without platform and related devices. The consumers may spend more to buy more expensive hardware with better quality, because they seek high level graphics and audio, preferred input response, or distinct design that triggers brand loyalty. Hardware firms tend to behave like technology firms in the common sense as they produce durable personal devices that were designed to reduce substitutability. Video game consoles require a great amount of development funds and consumer preferences to start with, so there is an extremely high barrier to entry. The console market is in a state of oligopoly with three multinational corporations (MNCs): Nintendo, SONY, and Microsoft. All of these firms have invested significantly into research and development of their consoles as well as advertising at the early stage of the sale of each generation of console. Before this oligopoly was formed there was SEGA, which competed with Nintendo for market domination from 1980s to 1990s but was then driven out of market, and other competitors on console production like Atari. However, these producers lost their market share, partially due to the rise of PlayStation by SONY, in 1990s. After this, Microsoft ambitiously invested into their own console, Xbox, at early 2000s and took the last share of console market, forming the long-existing and stable oligopoly. When SONY and Microsoft aim to compete on the quality of consoles with rather similar idea of design at every generation, Nintendo made distinction for their consoles, featuring portability, convenience, unique design, and exclusive games that the others lack of. In comparison, PC producers are now mainly gaming divisions of computer producers, and they compete on a variety of features with different prices. When some firms offer PCs with competitive price and fine performance, high-end producers like Alienware of Dell and ROG of Asus aim at highly aimed gamers with brand loyalty by guaranteed set of configurations, aesthetic design, and after-sale service system. Companies producing gaming peripherals behave in a similar way as PC producers.
Video games themselves are software. Video game publishers in the market are in a state of monopolistic competition as every game generates unique experience and is valued by a player at a level different to all others. Therefore, video game firms use different strategies of running a video game product or service in order to earn profit. Free-to-play games are usually multiplayer and can generate revenue by in-game commodity trade and the operation of e-sport competitions plus additional campaigns. Pay-to-play strategy is necessary for single-player games; the producer receive fixed price for each copy sold, while discounts are regularly given, and the buyers add the game ownership, which includes the ability to download, play, and relate the game to the personal account, into their account wealth. Multiplayer game producers may generate profit by hosting e-sport events as well. E-sport competitions can raise the popularity of a video game, and revenue from online streams can be made in addition to tickets and merchandise.
2.2. Rapid Growth of Video Games During the Pandemic
The COVID-19 pandemic led to a contraction in overall economic activity. The government had imposed health containment policies in response [2], which also discouraged economic activity despite reducing the spread of disease [3].
However, the video game industry experienced a growth since the beginning of pandemic, despite the sharp decline in other entertainment sectors. This growth is a result from advantages on both demand and supply side. At the supply side, game publishing companies have less difficulties when running in a state of remote working as the development of video games online loses relatively less productivity. At the demand side, the average hours spent indoors rose significantly due to the fear of being infected. When most activities can be only done indoors, video games grew popularity as a way of entertainment during the pandemic. It is hypothesized that performance of video game companies reacts differently in the pandemic, compared with general firms. Given the satisfactory performance data of video game companies, the different trends are worth comparing and a pattern may be found.
The government policies also play a vital role on the eventual effect on market performance [4]. The health containment policies aimed to reduce infection by keeping a safe distance between people. This resulted in a side effect that people seek interpersonal interactions in multiplayer games [5], where no risk of infection exists. Multiplayer game may be a possible substitute to real-life socializing. In addition, when the demand for accessible in-door entertainments was stimulated, the video games show significant competitiveness in this domain as the containment policies showed negligible restriction on the trading about video games, which can be easily done online.
Overall, the research objectives worth attention include the difference between performance of the game industry and that of other general industries during the pandemic, the effect of the pandemic crisis and related government policies on the behaviour of both hardware and software game companies, and whether there is a common trend or correlation between game market performance and typical macroeconomic policies imposed by the government.
2.3. Analysis on Behaviour of the Video Game Industry
The overall look at the game industry performance suggests that it has been taking advantage of the rapid-growing modern information network and the commonness of interactive technology to popularize the video game products as a lifestyle in both the general public, which requires high accessibility of game playing, and the traditional gamer community, which demands innovation together with quality and is willing to pay a considerable price for them. The total revenue of global video game industry has been growing consistently since 2019. Statistical data also illustrates the rapid rate of this growth at about 50 billion US dollars per year. It was between 2020 and 2021 that the growth in revenue exceeded 50 billion US dollars, while the revenue increase in other years did not reach this value, including the projected value of the market in 2023. Noticeably, this period overlapped with the COVID-19 outbreak, when industries in general suffer a fall in growth rate [6]. However, an opposite outcome is generated by the industry of video games, proving that it did take advantage of the pandemic to get an above-average growth rate that pushed its market size to a new level of 300 billion US dollars.
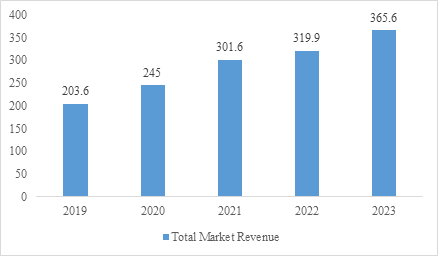
Figure 1: Revenue of Video Game Industry (in billion USD, source of data: https://www.statista.com).
The global figure of revenue from video games shown by Figure 1 concludes that this industry gets better off every year recently. However, whether this overall improvement can be also applied to the individual firms is questionable, because the overall growth may be a result from the sum of slight increases in revenue of most companies. Therefore, given this certain overall improvement, the features of performance of representative individual corporations are to be assessed in order to determine whether the general growth is caused by boosts from leading companies.
Inter-industrial performance comparison is set to compare the performance of major video game companies to that of other industries, including fundamental ones and technological ones, plus a comparison with commonly used company index. The index chosen is the S&P 500 Index (SPX), a widely used and representative index that includes 500 leading firms in a diversity of industries. S&P 500 Index reflects the performance of the overall market conclusively and is considered reliable in the case pandemic impact [7]. Electronic Arts Inc. (EA) and Activision Blizzard, Inc. (ATVI) are chosen to represent the software video game producers because of their significant market share and reputation in both PC and console platform plus their operation of large profit-generating multiplayer games. Game publishers are of the major target of performance analysis, so two firms are chosen and contrasted in order to reduce the effect of firm-specific factors. Nintendo Co., Ltd. (NTDOY) is the only producer chosen to represent the console market, where businesses produce consoles plus their own exclusive games, because the other two console giants, SONY and Microsoft, have a range of electronic products running in the supply chain, so the specific stock price cannot reflect their value in the game market. NVIDIA Corporation (NVDA) is representing the major hardware producer for PC as its main product, graphics processing unit (GPU), is vital for the running of video game graphics on PCs. Apple Inc. (AAPL) is representing the normal leading firm that produces technological products, because its supply of products has a relatively low correlation with video games, and this advantage plus its significant market importance makes it a suitable reference.
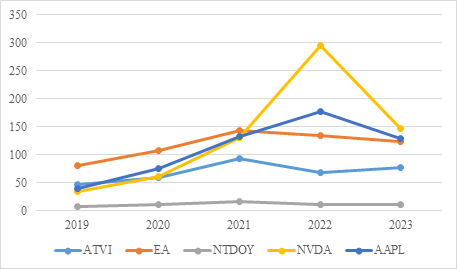
Figure 2: Stock Price Trend Comparison (in USD, source of data: https://finance.yahoo.com).
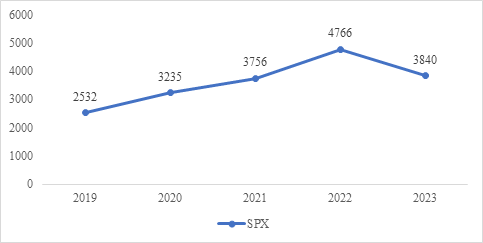
Figure 3: Index Price Trend (in USD, SPX Index only, source of data: https://www.bloomberg.com).
From Figure 2 and Figure 3, it can be seen that the performance of stock AAPL changes in a trend closely related to the trend of the SPX index. Although a clear sign of growth was seen on the total market revenue of video games, the individual firms included in Figure 2 did not obviously outperform the average shown by SPX index in Figure 3 or the leading technology producer AAPL. Among the four leading firms, only NVDA showed an above-average improvement in stock price in 2022, while others’ stock prices experienced a fall in 2022, which shows the opposite trend compared with the average represented by SPX. The distinct trend shown by NVDA may be due to a closer relation of this company, which mainly produces graphic cards that can be used for gaming PCs, to the general technology sector, compared with other firms selected. In addition, the release of NVIDIA’s RTX 40 GPU series could have contributed to the rapid rise of stock price in 2022. In contrast, the growth in stock prices of ATVI, EA, and NTDOY was worse off after 2021, when the marginal impact of the COVID-19 pandemic had already fell at a relatively low level, so this fall was probably due to firm-specific factors rather than the pandemic or the industrial factor, while the market uncertainty could also have influenced the prices and caused this difference. To sum up, the general growth is proved to be not caused by boosts from leading companies, and it was more likely to be the eventual overall result from growth of the majority of firms in a rather insignificant level that cannot be noticed in the most of firms in this majority. This outcome may be further proved, but this is not attempted due to a lack of data and relevant information.
Correlation analysis aims to check similarity in stock behavior, another possible direction of assessing.
Table 1: Price of stocks and index (in USD) from 2019 to 2023.
SPX | ATVI | EA | NTDOY | NVDA | AAPL | |
2019 | 2532 | 46.6 | 80.4 | 6.7 | 33.4 | 39.4 |
2020 | 3235 | 58.9 | 107.3 | 10.1 | 60.0 | 74.4 |
2021 | 3756 | 92.9 | 143.6 | 16.2 | 130.6 | 132.7 |
2022 | 4766 | 67.5 | 135.0 | 11.7 | 294.1 | 177.6 |
2023 | 3840 | 76.9 | 122.8 | 10.5 | 146.1 | 129.6 |
Source: https://finance.yahoo.com
Using the data from Table 1, there are all positive correlations as the stock performances tend to be rather similar when they share similar characteristics and are affected by the market change represented by SPX. To evaluate the significance of a value of correlation, the following standards are defined: no more than 0.35 means weak correlation, from above 0.35 to 0.65 represents mild correlation, and greater than 0.65 means strong correlation.
Table 2: Correlation analysis between stocks and index.
Correlation subjects | Correlation (4 d.p.) | Evaluation |
(ATVI, SPX) | 0.5442 | Mild |
(EA, SPX) | 0.8394 | Strong |
(NTDOY, SP) | 0.5685 | Mild |
(NVDA, SPX) | 0.9661 | Very Strong |
(AAPL, SPX) | 0.9837 | Extremely Strong |
(ATVI, EA) | 0.8954 | Strong |
(NVDA, AAPL) | 0.9411 | Very Strong |
(NTDOY, NVDA) | 0.4211 | Weak |
Although there are differences in individual trends of stock price, all gaming stocks show correlations with SPX that are within or beyond the range of mild correlation defined previously in Table 2, despite the firm-specific factors that may cause coincidence. Stock price of AAPL showed the strongest correlation with SPX, which is an expected outcome. NVDA stock price was in the strongest correlation with SPX among the game firms, which is also suggested in the analysis of the line graph. To make a further proof, correlation between NVDA and AAPL stock prices is investigated, and a very strong correlation of 0.9411, which is expected, is shown, proving that NVDA is rather similar to the general technology sector. The same similarity may be applied to the other PC hardware producers such as Intel and AMD. EA has a higher correlation figure with SPX compared with ATVI, and this could be a proof that firm-specific factors influenced the difference between stock price and market index trend, given that ATVI and EA have a strong correlation between their stock prices as they are similar game publishers. NTDOY has a mild correlation between its stock performance and SPX, but a weak correlation is found when it is compared with the PC hardware corporation NVDA, suggesting that a significant difference occurs between console producers and PC hardware producers.
The Price Earnings Ratio (P/E Ratio) is used to compare the value or profitability of the firms as it standardizes stocks with different prices and earnings into one comparable quantity. P/E Ratio equals stock price per share divided by earnings per share, so it basically means the price investors need to pay per unit earnings of the company. Low P/E Ratio represents a high profitability as a low investment is needed for the firm to generate unit earnings, but the information from the P/E Ratio can only be interpreted when compared with that of other companies or the historical data as it is impossible to determine whether a P/E Ratio value alone reflects considerable profitability [8]. All P/E Ratio values in this analysis are trailing P/E Ratio, because historical data in general is more reliable and sensible than the future predictions when a conclusion is needed to be drawn from the trend of past performance.
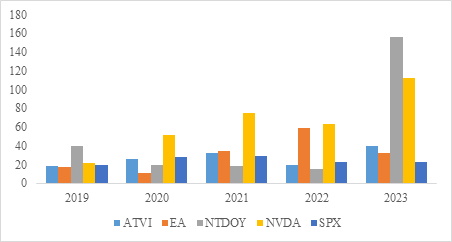
Figure 4: P/E Ratio Comparison (Source of data: https://www.macrotrends.net).
It can be found that the profitability of different game firms fluctuates and changes significantly without a general trend from Figure 4, while that of general index SPX has much less considerable fluctuation. P/E Ratio tends to be more firm-specific than stock prices, so these fluctuations could be associated with distinct features of these corporations themselves. For example, P/E Ratio of NTDOY improved after 2019 and remained satisfactory from 2020 to 2022 with low fluctuation, but it is projected to surge to about ten times of that in the previous year 2022 in 2023, which is a dramatic worse-off that could only be explained by firm-specific information instead of the trend shown by the industry.
To get a deeper insight to the general sale of software video games, Capcom Co., Ltd. (CCOEY) is set as the target of analysis. It is a Japanese game publisher known for its classic action games. Capcom has not been facing any firm-specific affairs that may influence its public preference, and it has been launching new games and trailers consistently, making the correlation between actions and stock prices recognizable.
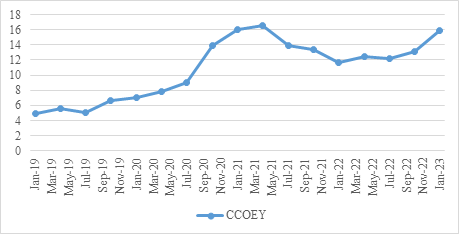
Figure 5: Stock price of Capcom Co., Ltd. (in USD, source of data: https://finance.yahoo.com).
As shown by Figure 5, the Capcom stock price had just a slight degree of improvement in 2019, and after the pandemic outbreak in early 2020, the price grew at an obviously higher rate. The stock price then surged in October 2020, which is deduced to be caused by the participation of Capcom in the Tokyo Game Show (TGS) 2020. At TGS 2020, which has begun on 23rd September 2020, Capcom released new information on a number of game launches, next-generation editions, and major updates. This event is deduced to stimulate speculation that Capcom will soon experience a significant rise in performance, resulting in the subsequent increase in stock price next month. This stimulation remained until a peak is reached in April 2021, and then the price fell to a relatively stable level, which is still about 2 times higher than that before pandemic, until October 2022. The CCOEY stock price rose again in January 2023 mainly due to the recent release of several new game trailers. From this set of data, it can be concluded that although casual new game launches at separate time periods are regarded as general product releases that are only reflected in stock prices by stable increase, a series of new games launched in a short period or forecasting new business plans on official events could cause a much significant reaction from players and result in a stimulation to the stock price, explaining the reason for major game publishers to be active in such events with considerable impact.
Operation of pay-to-play and free-to-play games makes firms to differentiate the revenue-generating strategies on different games. There is a lack of data related to firms’ earnings from pay-to-play and free-to-play games, however, the US market revenue from downloaded and online games had valid historical and projected data. Since downloaded games are usually charged for playing and online games generally offer free playing with in-game digital merchandise, the graph presented below could be a reasonable estimate of the change in market significance occupied by pay-to-play (downloaded) and free-to-play (online) video games.
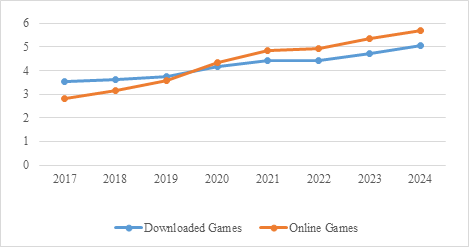
Figure 6: Revenue from downloaded and online games in the US market (in billion USD) (Source: https://www.statista.com).
Figure 6 presents the fact that the revenue from online games gradually exceeds that of downloaded games, and it was in 2020 that free-to-play games started to outperform pay-to-play games in the US market. The reason for this was probably the outbreak of pandemic, which was expected to encourage activity in online games. Another reason may be the changing taste of the general video game consumers, which are causing a possibly undesirable reform of the game market structure. Low-cost mobile games are not considered in the entire analysis mainly due to their rapid change and possible high volatility, which makes the actual potential hard to predict. Looking back to downloaded games, a relatively low and stable growth is shown, so the pay-to-play games are still remaining their market significance. Although under a suitable strategy of operation, free-to-play games are proved to generate relatively more welfare by a study [9], fairness of games under the sale of in-game commodities is still what a publisher should be careful about as gamers will reject those with unhealthy pay-to-win operation strategy, and a variety is still needed in order to satisfy different preferences, protect future potential, and ensure the overall welfare by product diversity in both short and long term.
E-sport events and online streaming of game playing are extra factors in the market that also play a considerable role in the game industry. Livestreaming of video game playing on websites grew popularity as the video games’ influence grew. Although Twitch is the most widely used streaming platform featuring video games, other platforms compete with it. The best known are YouTube, with its YouTube Gaming division, and Facebook Gaming [10]. As the significance of livestreaming grows, its impact on the popularity of video games starts to affect the game publishers, who make use of streaming to promote their multiplayer or newly launched games. A study has shown the positive relationship between game popularity on streaming platform Twitch and stock returns of major video game companies [10], making streaming an extra factor that affects the performance of individual game publishers and the entire video game industry. Streaming of e-sport competitions would theoretically have the similar effect on the publishers running competitive multiplayer games. People usually have free access to streaming websites, while companies benefit from their games being streamed, so livestreaming could be a low-cost approach for publishers to advertise video games.
Lastly, correlation between game market statistics and government policies is checked. The US market, which is a representative and data-sufficient market suitable for investigation, is taken as the target of data research.
Table 3: US game market size and national interest rates.
Market Revenue (bn USD) | Interest Rate (%) | |
2019 | 89.65 | 2.1 |
2020 | 110.58 | 0.9 |
2021 | 114.7 | 1.5 |
2022 | 97.67 | 2.7 |
2023 | 106.82 | 4.7 |
(Source of data: https://www.statista.com; https://www.visualcapitalist.com; https://www.morningstar.com)
The correlation between market revenue and interest rate is calculated in Table 3. As a lower interest rate encourages borrowing and subsequent spending while discouraging saving, the market revenue, which is generated by consumer expenditure, is expected to rise when interest rate falls, giving a negative correlation between the factors. However, the correlation between them is approximately -0.1792 in 4 decimal places, which is a weak negative correlation that suggests the weak impact of interest rates on the spending into video game market. It turns out that government monetary policies cannot cause obvious impacts on the game industry, despite the fact that the basic macroeconomic principles are still followed. The US government has not provided a valid statistical data about its recent budget allocation into different sectors and target of supply-side stimulations, so the effect of fiscal and supply-side policies is to be investigated.
3. Conclusion
Summing up all the key findings, the overall recent behaviour of the video game industry is illustrated. The business model of video games is distinct among the major electronic products in the market. Hardware, software, and media propaganda together forms a completed complementary system of the video game industry, and there are several leading producers in each category. During the COVID-19 pandemic, the industry has taken advantage of the change in environment and was able to grow rapidly, despite the firm-specific disturbances from individual producers. This growth is not resulted from improving performance of leading companies, and it was more likely to be the eventual overall result from growth of the majority of firms in a rather insignificant level. Among these leading firms, software game publishers share similar trend in performance, despite the firm-specific issues. PC hardware producers performed similar to technology companies and the general index, while console producers do not. P/E Ratio of video game corporations fluctuates without an obvious pattern, suggesting the influential distinct factors in individual firms. The industry tends to be mature in the present days as leading firms have complete strategies in the sale and operation of video games such as publishing events, competitive e-sport events and livestreaming, and the co-existence of pay-to-play and free-to-play operation methods maintains balance and diversity of video game products. Government macroeconomics policies have rather small impact on the industry, suggesting its relative independence in the general market.
These results are able to give an insight into an underestimated industry with huge potential in the changing economy. The limitations of the findings are mainly due to the lack of data and further statistics. More samples of game firms can be taken for the correlation between stocks, for example, and more calculated interpretations of data can be done with the graphs and tables.
In future, the government and society may put attention on the fact that the rapid growth has both benefits and drawbacks. Although the video game industry is now no longer a newly formed immature industry, its nature of changing is more obvious than other industries, bringing in much more uncertainty. The extent to which traditional economic principles can be applied to analyse the industry is limited. Such uncertainty may be the future problem during further growth, and it is difficult to determine whether the features in the market such as oligopoly of consoles are unhealthy, as they appear to be maintaining the balance of the industry for now. The video game market would continue to attract investment, partially from speculators, and its future needs more research as a target of economic, financial, and business analysis to be predicted conclusively. Although there are uncertainties, works can be done to discover the video game industry’s future possibilities.
References
[1]. M. Ángeles López-Cabarcos, D. Ribeiro-Soriano, Juan Piñeiro-Chousa, All that glitters is not gold. The rise of gaming in the COVID-19 pandemic, J Innov Knowl, 5 (2020)
[2]. X. Yu, C. Xu, H. Wang, Effective mitigation strategy in early stage of COVID-19 pandemic in China. Infect Dis Poverty 9, 141 (2020).
[3]. M.Famiglietti, F. Leibovici, The impact of health and economic policies on the spread of COVID-19 and economic activity, Eur Econ Rev, 144 (2022)
[4]. J. E. Stiglitz, The proper role of government in the market economy: The case of the post-COVID recovery, Journal of Government and Economics, 1 (2021)
[5]. M. Barr, & A. Copeland-Stewart, Playing Video Games During the COVID-19 Pandemic and Effects on Players’ Well-Being. Games Cult, 17 (2022).
[6]. K. Hoang, M. Arif, C. Nguyen, Corporate investment and government policy during the COVID-19 crisis, Int Rev Econ Financ, 80 (2022)
[7]. F. Lúcio, J. Caiado, COVID-19 and Stock Market Volatility: A Clustering Approach for S&P 500 Industry Indices, Financ Res Lett, 49 (2022)
[8]. P. Fernández, Chapter 3 - Price-Earnings Ratio, Profitability, Cost of Capital, and Growth, Academic Press, (2002)
[9]. J. Manuel Sánchez-Cartas, Welfare and fairness in free-to-play video games, Techno Forecast Soc, 180 (2022)
[10]. J. Piñeiro-Chousa, M. Ángeles López-Cabarcos, Ada M. Pérez-Pico, Jérôme Caby, The influence of Twitch and sustainability on the stock returns of video game companies: Before and after COVID-19, J. Bus. Res., 157(2023)
Cite this article
Fan,N. (2023). Evaluation of the Performance and Behavior of the Video Game Industry. Advances in Economics, Management and Political Sciences,30,54-64.
Data availability
The datasets used and/or analyzed during the current study will be available from the authors upon reasonable request.
Disclaimer/Publisher's Note
The statements, opinions and data contained in all publications are solely those of the individual author(s) and contributor(s) and not of EWA Publishing and/or the editor(s). EWA Publishing and/or the editor(s) disclaim responsibility for any injury to people or property resulting from any ideas, methods, instructions or products referred to in the content.
About volume
Volume title: Proceedings of the 7th International Conference on Economic Management and Green Development
© 2024 by the author(s). Licensee EWA Publishing, Oxford, UK. This article is an open access article distributed under the terms and
conditions of the Creative Commons Attribution (CC BY) license. Authors who
publish this series agree to the following terms:
1. Authors retain copyright and grant the series right of first publication with the work simultaneously licensed under a Creative Commons
Attribution License that allows others to share the work with an acknowledgment of the work's authorship and initial publication in this
series.
2. Authors are able to enter into separate, additional contractual arrangements for the non-exclusive distribution of the series's published
version of the work (e.g., post it to an institutional repository or publish it in a book), with an acknowledgment of its initial
publication in this series.
3. Authors are permitted and encouraged to post their work online (e.g., in institutional repositories or on their website) prior to and
during the submission process, as it can lead to productive exchanges, as well as earlier and greater citation of published work (See
Open access policy for details).
References
[1]. M. Ángeles López-Cabarcos, D. Ribeiro-Soriano, Juan Piñeiro-Chousa, All that glitters is not gold. The rise of gaming in the COVID-19 pandemic, J Innov Knowl, 5 (2020)
[2]. X. Yu, C. Xu, H. Wang, Effective mitigation strategy in early stage of COVID-19 pandemic in China. Infect Dis Poverty 9, 141 (2020).
[3]. M.Famiglietti, F. Leibovici, The impact of health and economic policies on the spread of COVID-19 and economic activity, Eur Econ Rev, 144 (2022)
[4]. J. E. Stiglitz, The proper role of government in the market economy: The case of the post-COVID recovery, Journal of Government and Economics, 1 (2021)
[5]. M. Barr, & A. Copeland-Stewart, Playing Video Games During the COVID-19 Pandemic and Effects on Players’ Well-Being. Games Cult, 17 (2022).
[6]. K. Hoang, M. Arif, C. Nguyen, Corporate investment and government policy during the COVID-19 crisis, Int Rev Econ Financ, 80 (2022)
[7]. F. Lúcio, J. Caiado, COVID-19 and Stock Market Volatility: A Clustering Approach for S&P 500 Industry Indices, Financ Res Lett, 49 (2022)
[8]. P. Fernández, Chapter 3 - Price-Earnings Ratio, Profitability, Cost of Capital, and Growth, Academic Press, (2002)
[9]. J. Manuel Sánchez-Cartas, Welfare and fairness in free-to-play video games, Techno Forecast Soc, 180 (2022)
[10]. J. Piñeiro-Chousa, M. Ángeles López-Cabarcos, Ada M. Pérez-Pico, Jérôme Caby, The influence of Twitch and sustainability on the stock returns of video game companies: Before and after COVID-19, J. Bus. Res., 157(2023)