


1. Introduction
In the context of the just ended epidemic, the situation in various industries has undergone significant changes, and the stock market is constantly changing [1-3]. Therefore, it is of great significance to conduct data evaluation and continuously screen out the most effective factors for stock selection. The previous method of stock selection that allowed individuals to enter may no longer be applicable. It is particularly important to make the right stock selection strategy in the face of significant changes. Some of the stocks are not familiar with the market and company situation, and only randomly choose based on personal experience. Moreover, the stock market environment in China is already uncertain, making it even more difficult to speculate under the impact of the epidemic [4-8]. For investors, making the right stock selection strategy can bring significant advantages. It is necessary to conduct a detailed analysis of financial information and select potential value stocks to increase the probability of obtaining returns. In this era of rapid information dissemination, obtaining information has become more convenient than before, and basic multi factor analysis is also easier to achieve and influence. The combination analysis of multiple factors can reduce the uncertainty brought about by special situations, as the mutual cancellation of risks between factors increases the stability of the model. Choosing more and more effective candidate factors will enhance the model's information capture ability, improve its stability, and be one of the key factors in obtaining excess returns. This study selects effective factors from multiple factors such as valuation, profitability, debt repayment, cost effectiveness, and operational capability [9, 10]. By utilizing the Ricequant platform to conduct back testing and factor selection research, it will enable factors with weak correlation to make different combinations and ultimately construct potential factors with strong correlation. It is hoped that it can serve as a reference for investors.
By constructing a multi factor stock selection model based on industry rotation, empirical analysis found that the investment efficiency obtained by combining industry rotation with market value explanatory factor model is much higher than the market average of the Shanghai and Shenzhen 300 markets, and is superior to the investment formula of simply using industry rotation model to select stocks. It is also found that the multi factor stock selection model of industry rotation is also effective in risk prevention. There are advantages. By obtaining historical data and corresponding factors with good returns during the cycle from the database, understanding the market conditions at that time and selecting advantageous factors corresponding to previous market conditions, conducting back testing calculations, estimating stock values, and selecting stock portfolios with higher returns.
2. Data & Method
In recent years, quantitative investment has gradually emerged in China and investment strategies are becoming more and more abundant. This situation is also the reason why people pay more attention to the choice of stock selection strategies. Stock returns are influenced by many factors, such as market environment, industry development, and investor expectations. The factor in the "multi-factor model" is the influencing factor, and the model is to find the factors that have a significant impact on stock returns. In this paper, we take CSI 300 stocks as the research object and use the RiceQuant quantitative trading platform to backtest different factor combinations and adjustments to collect and compare their returns. The empirical analysis concludes that factors such as the valuation factor, operating factor, and growth factor have significant effects on stock returns.
3. Results & Discussion
3.1. Growth Ability Indicators
The growth ability reflects the company's ability to expand its operations and its future development prospects. Strong growth ability can indicate a high market demand for a company's products, good future development prospects for the industry in which the company is located, and strong business expansion ability of the company. Growth factor refers to an indicator that reflects a company's medium to long-term growth ability. If the growth factor of a stock exceeds that of other stocks in the same class, it can be considered that the stock price of the company has a significant possibility of rising in the future.
The financial indicators reflecting growth ability mainly include the growth rate of total operating revenue, the growth rate of total profit, the growth rate of basic earnings per share, and the growth rate of net assets per share. After multiple back testing, we selected four growth factors and set corresponding numerical ranges to achieve the optimal back testing results. The range of stock selection factors is shown in Table 1. The back testing results are shown in Table 2. The annualized return on the testing was 11.744%, which is relative to the benchmark return of -21.775%, proving that the strategy has a relatively good result (seen from Fig. 1).
Table 1: Stock selection factors.
Growth factors | scope( %) | |
min | max | |
Basic earnings per share (year-on-year growth rate) | 10.00 | 25.00 |
Operating profit (year-on-year growth rate) | 31.00 | 52.00 |
Total assets (relative growth rate at the beginning of the year) | 10.00 | 84.00 |
Total operating revenue (year-on-year growth rate) | 15.00 | 23.00 |
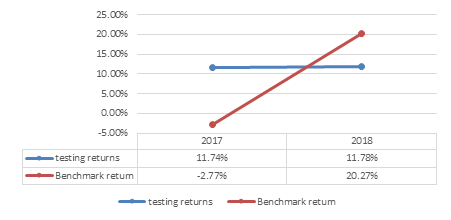
Figure 1: Backtesting results for growth ability.
Table 2: Growth factor testing results.
testing returns | 11.351% |
Retrospective annualized returns | 11.744% |
Benchmark return | -21.775% |
Benchmark annualized income | -22.564% |
Accumulated Net | 1.114 |
Maximum withdrawal rate of excess returns | 2.5564 |
Annual winning rate | 0.2000 |
Quarterly winning rate | 0.2500 |
Monthly winning rate | 0.2500 |
Daily victory rate | 0.4303 |
alpha | 0.0959 |
Beta | -0.0297 |
Sharpe rate | 0.7179 |
Sortino ratio | 1.7010 |
Information ratio | 0.9740 |
Annualized volatility | 0.1275 |
Maximum fallback | 5.024% |
Annualized tracking error | 0.1648 |
Annualized downside volatility | 0.0539 |
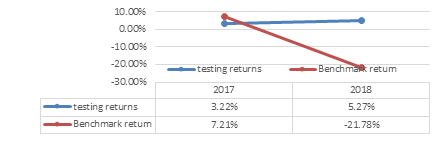
Figure 2: Backtesting results for debt paying ability.
3.2. Debt Paying Ability Indicators
The indicator of a company's debt repayment ability refers to its ability to repay debts. The measurement of a company's debt paying ability mainly depends on whether the company's capital structure is reasonable and stable, as well as the size of the company's long-term profitability. The solvency of a company mainly depends on the ratio between assets and liabilities, especially the capital structure and the profitability of the company. Long term creditors pay particular attention to their long-term solvency in order to assess the safety of their claims. Its indicators include asset liability ratio, equity ratio, contingent liability ratio, interest earned multiple, and interest bearing liability ratio. We selected three indicators: asset liability ratio, working capital, and current ratio to achieve the optimal testing results within a specific range. The range of stock selection factors is shown in Table 3. The relevant testing results are shown in Table 4. The annualized return on the testing is 4.21%, which is relative to the benchmark return of -21.77%, proving that the strategy has relatively good results (given in Fig. 2).
Table 3: Stock selection factors.
Debt paying ability indicators | ||
Option | range | |
Asset liability ratio | Less | 30% |
Working capital | grater | 9million |
Current ratio | grater | 2 |
Table 4: Testing results.
testing revenue | 4.21% |
Testing annualized income | 5.27% |
Benchmark return | -21.775% |
Benchmark annualized income | -22.564% |
Accumulated net value | 1.1920 |
Maximum withdrawal rate of excess returns | 5.1953 |
Annual winning rate | 0.6667 |
Quarterly winning rate | 0.6667 |
Monthly winning rate | 0.5556 |
Daily winning rate | 0.5110 |
Alpha | 0.0855 |
Beta | 1.0758 |
Sharpe rate | 0.2682 |
Sortino ratio | 0.3646 |
Information ratio | 0.2686 |
Table 4: (continued). | |
Annualized volatility | 0.1880 |
Maximum retreat | 47.41% |
Annualized tracking error | 0.1514 |
Annualized downside volatility | 0.1975 |
3.3. Operating Capacity Indicators
Operating capacity refers to the ability of an enterprise to operate, that is, the ability of the enterprise to use each asset to earn profits. The analysis of the enterprise's operating capacity should be calculated and divided by the indicators reflecting the efficiency and effectiveness of the enterprise's asset operation to determine the enterprise's operating capacity in order to clarify the investment plan that can improve economic efficiency.
Financial analysis ratios of enterprise operating capacity are inventory turnover, accounts receivable turnover, business cycle, etc. These ratios reveal the situation of the enterprise's capital operation and turnover, and reflect the efficiency of the enterprise's economic resources management and utilization. The faster the turnover of the enterprise's assets, the higher the liquidity, the stronger the solvency of the enterprise, and the faster the assets can obtain profits. The selection factor is given in Table. 5 and the results are given in Table. 6. The annual returns of the strategy are shown in the Fig. 3.
Figure 3: Backtesting results for operating capacity.
Table 5: Stock selection factor.
Operating Capacity Factor | Range (in %) | |
Minimum | Maximum | |
Total Assets Turnover | 0.5 | 20 |
Accounts Receivable Turnover Ratio | 18 | 20 |
Table 6: Backtest results.
Backtest Earnings | 25.674% |
Back-tested annualized returns | 12.607% |
Benchmark earnings | -25.707% |
Benchmark Annualized Return | -14.307% |
Cumulative net value | 1.257 |
Excess return maximum retracement rate | 2.5821 |
Annual Win Rate | 1.0000 |
Quarterly Winning Percentage | 1.6265 |
Monthly Win Rate | 0.6667 |
Table 6: (continued). | |
Daily Win Rate | 0.7500 |
Alpha | 0.4990 |
Beta | 0.1611 |
Sharpe rate | 0.5184 |
Sortino Ratio | 0.7810 |
Information ratio | 0.7930 |
Annualized Volatility | 0.2340 |
Maximum retracement | 16.907% |
Annualized Tracking Error | 0.2562 |
Annualized Downside Volatility | 0.1553 |
3.4. Valuation Type Indicators
Valuation factor is a very important type of factor. Valuation indicators generally include P/E ratio, P/N ratio, dividend yield, P/S ratio, etc. Valuation factors vary significantly among different industries (10), for example, the P/N ratio, which is generally between 0.8 and 1.2 for the banking sector, will be between 2 and 3 for the manufacturing sector, and is generally high for high-tech companies, which may be more than 5 (seen from Table. 7). This time, three indicators, P/E, P/N and PPC, were selected to achieve the optimal backtest results within a specific range (given in Table. 8).
Table 7: Stock selection for valuation type factors.
Valuation Factor | Range | |
Minimum | Maximum | |
P/E Ratio | 10 | |
P/N Ratio | 1.5 | 2.5 |
Price to Present Ratio | 2 | |
Table 8: Backtest results for valuation type factors.
Backtest Earnings | 29.040% |
Back-tested annualized returns | 30.123% |
Benchmark earnings | 21.775% |
Benchmark Annualized Return | 22.564% |
Cumulative net value | 1.290 |
Excess return maximum retracement rate | 3.0900 |
Annual Win Rate | 1.0000 |
Quarterly Winning Percentage | 0.7500 |
Monthly Win Rate | 0.6667 |
Daily Win Rate | 0.4631 |
Alpha | 0.0953 |
Beta | 1.9005 |
Sharpe rate | 1.8999 |
Sortino Ratio | 2.7305 |
Information ratio | 1.0810 |
Annualized Volatility | 0.1287 |
Table 8: (continued). | |
Maximum retracement | 5.122% |
Annualized Tracking Error | 0.0913 |
Annualized Downside Volatility | 0.0896 |
4. Conclusion
In summary, we use the fundamental multi-factor stock selection strategy to test financial indicators in four aspects: solvency, growth, operating capacity, and valuation, and get four back-testing results with positive returns from 2017 to 2018, which we hope will be useful for investors. Apparently, there are certain risks and timeliness of multi-factor stock selection, and investors need to adjust and update according to their own experience and market conditions, which is the shortage of multi-factor stock selection strategy. However, the multi-factor stock selection is based on financial indicators, and there is value in setting and screening the relevant factor values to obtain a portfolio of stocks with higher returns. Overall, these results offer a guideline for quantitative fundamental analysis.
References
[1]. Zhu, P., Tang, Y., Wei, Y., Lu, T.: Multidimensional risk spillovers among crude oil, the US and Chinese stock markets: Evidence during the COVID-19 epidemic. Energy, 231, 120949 (2021).
[2]. Sui, B., Chang, C. P., Jang, C. L., Gong, Q.: Analyzing causality between epidemics and oil prices: Role of the stock market. Economic Analysis and Policy, 70, 148-158 (2021).
[3]. Czech, K.: Energy commodity price response to covid-19: Impact of epidemic status, government policy, and stock market volatility. International Journal of Energy Economics and Policy (2021).
[4]. Liang, S.: The impact of COVID-19 information disclosure on stock returns of catering industry. Modern Business 30, 41-44 (2022).
[5]. Han, S.: The impact of investor sentiment on Stock Market returns in the context of COVID-19 (Master's Thesis, Shandong Technology and Business University) (2022).
[6]. Wang, X.: Research on the Impact of Return Volatility of European and American Stock Markets under the COVID-19 Epidemic (Master's Thesis, Anhui University of Finance and Economics) (2022).
[7]. Wang, J.: Research on the impact of investor attention on stock returns of pharmaceutical industry under the COVID-19 epidemic (Master's thesis, Shanghai University) (2022).
[8]. Gao, Y., Li, H., Guo, Y.: The impact of COVID-19 on stock investment. Journal of Hubei University of Economics (Humanities and Social Sciences Edition) 12, 48-51 (2021).
[9]. Xie, M. Z.: Multi-factor quantitative stock selection strategy based on machine learning algorithm. Journal of Jilin Institute of Technology and Business 06, 90-97 (2021).
[10]. Cao, W.: Stock Quantization Multi-factor Stock Selection Research based on Boosting Algorithm (Master's thesis, Zhejiang Gongshang University) (2021).
Cite this article
Wu,Y.;Xi,Y. (2023). Analysis of Multifactor Fundamentals Stock Selection Based on Backtesting. Advances in Economics, Management and Political Sciences,34,92-98.
Data availability
The datasets used and/or analyzed during the current study will be available from the authors upon reasonable request.
Disclaimer/Publisher's Note
The statements, opinions and data contained in all publications are solely those of the individual author(s) and contributor(s) and not of EWA Publishing and/or the editor(s). EWA Publishing and/or the editor(s) disclaim responsibility for any injury to people or property resulting from any ideas, methods, instructions or products referred to in the content.
About volume
Volume title: Proceedings of the 7th International Conference on Economic Management and Green Development
© 2024 by the author(s). Licensee EWA Publishing, Oxford, UK. This article is an open access article distributed under the terms and
conditions of the Creative Commons Attribution (CC BY) license. Authors who
publish this series agree to the following terms:
1. Authors retain copyright and grant the series right of first publication with the work simultaneously licensed under a Creative Commons
Attribution License that allows others to share the work with an acknowledgment of the work's authorship and initial publication in this
series.
2. Authors are able to enter into separate, additional contractual arrangements for the non-exclusive distribution of the series's published
version of the work (e.g., post it to an institutional repository or publish it in a book), with an acknowledgment of its initial
publication in this series.
3. Authors are permitted and encouraged to post their work online (e.g., in institutional repositories or on their website) prior to and
during the submission process, as it can lead to productive exchanges, as well as earlier and greater citation of published work (See
Open access policy for details).
References
[1]. Zhu, P., Tang, Y., Wei, Y., Lu, T.: Multidimensional risk spillovers among crude oil, the US and Chinese stock markets: Evidence during the COVID-19 epidemic. Energy, 231, 120949 (2021).
[2]. Sui, B., Chang, C. P., Jang, C. L., Gong, Q.: Analyzing causality between epidemics and oil prices: Role of the stock market. Economic Analysis and Policy, 70, 148-158 (2021).
[3]. Czech, K.: Energy commodity price response to covid-19: Impact of epidemic status, government policy, and stock market volatility. International Journal of Energy Economics and Policy (2021).
[4]. Liang, S.: The impact of COVID-19 information disclosure on stock returns of catering industry. Modern Business 30, 41-44 (2022).
[5]. Han, S.: The impact of investor sentiment on Stock Market returns in the context of COVID-19 (Master's Thesis, Shandong Technology and Business University) (2022).
[6]. Wang, X.: Research on the Impact of Return Volatility of European and American Stock Markets under the COVID-19 Epidemic (Master's Thesis, Anhui University of Finance and Economics) (2022).
[7]. Wang, J.: Research on the impact of investor attention on stock returns of pharmaceutical industry under the COVID-19 epidemic (Master's thesis, Shanghai University) (2022).
[8]. Gao, Y., Li, H., Guo, Y.: The impact of COVID-19 on stock investment. Journal of Hubei University of Economics (Humanities and Social Sciences Edition) 12, 48-51 (2021).
[9]. Xie, M. Z.: Multi-factor quantitative stock selection strategy based on machine learning algorithm. Journal of Jilin Institute of Technology and Business 06, 90-97 (2021).
[10]. Cao, W.: Stock Quantization Multi-factor Stock Selection Research based on Boosting Algorithm (Master's thesis, Zhejiang Gongshang University) (2021).