


1 Introduction
This report believes that the S&P 500 index can effectively justify that the volatility of the U.S. stock market on information impact during the epidemic is at least weakly effective. A recently published academic paper pointed out that although the stocks of natural gases, petroleum, healthcare, and food provisions had high returns during the pandemic, on the other hand, the values of stocks in the real estate, recreations, and hotel industries have drop tremendously during the Covid. In addition, this particular report utilizes many corporations from S&P 500 index to demonstrate that despite those companies responded to the COVID-19 revenue shock in a variety of ways, the macro American stock market exhibits extreme asymmetric volatility, therefore, negatively correlated with stock returns [1].
When it comes to the Chinese Stock market, this professional study indicates that the investment strategy based on the implied volatility of options can obtain excess returns during the severe epidemic period by examining the Shanghai Securities Composite Index [2]. However, when the epidemic is under control, and the stock market gradually resumes smooth operation, the strategy's return is lower than the market's return, making the strategy invalid. The above phenomena prove that the effectiveness of the Chinese stock market will be affected by macro events and change. Finally, the former report concludes that the Chinese stock market during the pandemic was at least not strongly effective [2].
Consequently, from what has been discussed above, the purpose of the paper will be interesting and meaningful. Resulting from the volatility of both markets was not effective during the period of the pandemic, this paper will reexamine the volatility of the stock market of the luxury and budget hospitalities in both countries by using several mathematical approaches to trace the external risks of both financial markets accurately.
Generally speaking, the hotel industry has a business model with high initial investment costs and long financial return periods in the later stages compared to other light asset industries. Because the hotel industry has a very high proportion of fixed operating costs and labor costs, once there is no business for a long period of time, the hotel industry will face long-term losses. Despite the fact that the notorious impact of covid-19 has influenced almost all industries, the hotel industry, a severe disaster area, is one of the major industries that is being harmed the hardest [3]. A recent Deloitte Consulting research report points out that although the new mutant virus has been effectively controlled to some extent, and various industries and companies want to continue to resume growth by increasing production, reducing costs, and completing the transformation of business models, Covid-19 has produced irreversible negative impact on the real estate, recreational, and hotel industries .Consequently, in addition to the internal value of this research itself, the study of stock changing variables of the hotel industry in two counties during the pandemic also plays a vital role in the process of economic recovery[3].
Specifically, the main aim of this research is to demonstrate whether there is a statistically persuasive correlation between the Covid-19 pandemic and the prices of those representative leading stocks in two exotic stock markets by comparing and contrasting their current prices with their previous prices. By setting the Efficient Market Hypothesis as a premise, the paper will examine several estimation windows to preciously conclude the validity of data. Furthermore, the Null hypothesis will be planted to observe the reaction of the volatility of those stocks under the 95-percentile confidence level.
However, we predicted that many controversies might emerge after the publication of this paper as it omits many critical aspects. For example, The Chinese economy is a communism-based economy, and the U.S. economy is a capitalism-based marketplace. Although to stimulate the economy, both counties have had measured interest rate cuts, loans, asset purchases, and changes in institutional regulations, two governments took a different approach to facilitate the economy. Hence, those external factors such as economic structure, governmental regulations, and applied economic methodologies (monetary policy, fiscal policy, and others) will not be discussed in this paper.
2.Hotel Introduction
COVID-19, a typical infectious disease, has attracted extensive attention from people with different occupations. The performance of the financial market could be a relatively solid reflection of economic reality. In order to facilitate the studying of the impact of stock prices on the multinational hotel industry, the paper has chosen representative high-end hotels and budget hotels in China (Shangri La & Jinjiang) and the United States (Choice Hotels International & Marriott).
The following content is the fundamental introduction of those hotels that have been applied by this paper:
Shangri-la is an international brand of a Hong Kong-listed company, which Malaysia's Kwok Group owns. Since the opening of The Shangri-La hotel in 1971, when Singapore was located together, Shangri-La has been well on its way to becoming one of the largest Shihua hotel groups in Asia (n.d.).
Jinjiang International Group is one of the largest comprehensive tourism enterprise groups in China. The group takes hotel, catering service, and tourism passenger transportation as its core industries and has six business divisions: hotel, tourism, passenger logistics, real estate, industry, and Finance. The registered capital of Jinjiang International Group is 2 billion yuan, with total assets of 17 billion yuan (n.d.).
Choice Hotels International, Inc. Founded in 1939, it is headquartered in Yinquan, Maryland. The group owns a number of internationally renowned hotel brands in dry branches. From basic services to high-end entertainment, select hotels national flag hotel companies meet the needs of different consumers (n.d.).
Marriott International Group is a world-famous hotel management company. There are 50,000 colonialists all over the world. Marriott International Group was founded in 1927 and headquartered in Washington State, USA. Marriott International Group has 21 famous hotel brands, more than 4,000 hotels with global business, and an annual turnover of nearly $20 billion. Marriott International Group has been repeatedly named as the best company in the store by the world's famous business magazines and media (n.d.).
According to the above discussion and the strategic layout of the global hotel giants, the national large hotel groups are taking accelerating the industry, improving the market share, and building their own brand image as the business core. Therefore, these four hotels fit the comparison standard of this report.
3.Literature Review
However, despite the perfect brand image of these international hotel groups, their financial statements have been among the worst during the pandemic. For example, according to the financial report of the chosen hotel, the total revenue was USD 774 million in 2020 and USD 1115 million in 2019. The annual net profit was 75.39 million US dollars, up from 223 million US dollars in the previous year; According to Marriott's financial report, Marriott's net loss in the first quarter of 2021 totaled the US $11 million, while the net profit reported in the same period last year was the US $31 million, a year-on-year decrease of 135%; The financial report of Jinjiang Hotel shows that The total revenue at The end of 2019 is about 1.4 times that at The end of 2020. . Therefore, this paper believes that market efficiency during the pandemic for the hotel industries in both countries was at least not strongly effective [4].
Many pieces of literature have provided tons of evidence for the premise of this research. Huang Bin [5] finds that since 2007, China's stock market has gradually shown the characteristics of weak performance, while the US stock market is also weak performance.
Abbas Khan, Muhammad Yar Khan, Abdul qayyum Khan and Majid Jamal Khan [6] verify the EMH weaknesses of Sri and SCI in the United States by considering the daily closing prices from 2010 to 2018. With the premise of efficiency and the premise of the Chinese and American markets, we also have an impact on the stock market in a wide range of literature.
Research conducted by David Carter, Sharif Mazumder, Betty Simkins and Eric sisneros [7] shows the stock market performance of tourism related companies (airlines, restaurants and hotels) in the United States. Covid-19 from the end of February to the late 1920s.
According to Chen Lin and Qu Xiaohui [4] introduction, the study found that the smaller the company size, the higher the financial leverage level, and the more serious the stock return; at the same time, the stock prices of Chinese companies listed in provinces are affected by the epidemic. The epidemic stock prices in pharmaceutical manufacturing, agriculture and food processing industries have increased, while the prevalence of water shortage has increased, while the listed companies are in transportation, tourism and real estate The stock price of the industry suffered a serious fall.
A group with Chinese national leading scientists, Wenmin Wu, Chien-Chiang Lee, Wenwu Xing, and Shan Juhao [8] indicate in a report regarding the impact of stock price movements of China's tourism industry by using an event study method that there is a nonlinear relationship between government intervention and the competition of Chinese tourism stocks. The survey results show that coronavirus disease has a negative impact on travel stocks in 2019, and government intervention measures. The gradual decline of the industry level shows a significant positive correlation with the highest ARS level of tourism units (2021).
All in all, most academic articles have confirmed that the volatility of the hotel industry could be altered by many external factors and thus at least not strongly effective. Since the negative impact of the stock market in hotel industries could be multifactor based, this topic will delve into the impact of the high-end and budget hospitality industry using a number of models.
4.Methodology
The researchers used the S&P500 and the HIS Hang Seng Indexes for comparing the returns of the US market with those of the Hong Kong market (i.e. the Chinese market).
Marriott International, an established tourism and hospitality company founded in 1927, earlier listed on the New York Stock Exchange and changed to NASDAQ in early 2014, acquired Starwood Hotels & Resorts International in 2016, creating the largest hotel chain in the world, and due to its large market capitalization and hotel positioning, qualifies as a US representative of the upscale hotel industry [9]. The thesis research data sample was taken from its past share prices (all data sources are yahoo finance) and analyzed for the period 2018-2021. The main research limitation is that the unpublished data of the company may have some incalculable impact on its stock pricing.
Shangri-La is a Hong Kong-based hotel group whose first hotel was founded in 1971 and is now owned by Shangri-La Limited (Asia). Shangri-La has the largest number of hotels in mainland China and its share price is to some extent very representative of the trend of the high-end hotel industry in China [10]. The research data for the paper is also taken from its past share prices over the period 2018-2021 (all data sources are yahoo finance) and analyzed. The main limitation of the study is that the reliability of the data is somewhat affected by the adverse impact of various events on the share price earlier.
Fig. 1. Room availability in the global hotel market in 2020
Figure 1 shows Figure 1 shows the availability of rooms in the global hotel market by tier in 2020 and is presented in a pie chart [11].
Fig. 2. Market share of hotels in China in 2020
Fig. 3. Market share of hotels in U.S in 2020[12]
This paper also collects data on budget hotels, but since budget hotels are too heterogeneous, there is no strict market regulation, and the number of private companies is much larger than the number of listed companies, it is impossible to make a rigorous inference about the market. Two leading listed budget hotel companies in the Chinese and American markets (see Figure 2 and Figure 3) are selected here as a reference comparison, which is intended to provide more rigorous and reliable data support for the result.
Jin Jiang International (Holdings) Co., Ltd. was chosen for the Chinese market [13] and Choice Hotels International, Inc. was chosen for the US market [14]. Both are well known, widely distributed and listed companies, and the data are used secondary data, which has some empirical significance.
This paper adopts a positivist approach to research. As the hypothesis is tested based on a large amount of rigorous real data, and the hypothesis is confirmed based on known data, there is a causal link between the hypothesis and the phenomenon under study. The advantages of this approach are that the hypothesis is supported by a large amount of real data and its analysis, which is sufficiently reliable and realistic, but the disadvantage is that the data processing process is tedious.
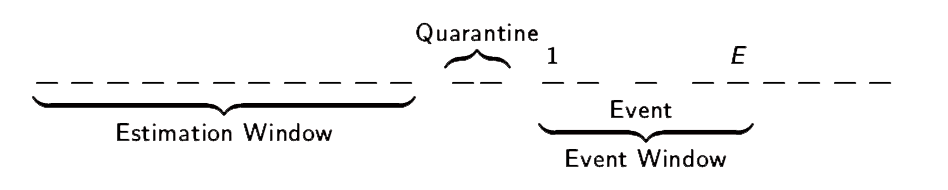
Fig. 4. window selection rule icon
as shown in Figure 4, researchers selected two time nodes for analysis, and we divided the time nodes into two Windows named estimation window and event window:
The regression model calculation process used in Result is shown below:
\( {R_{t}}=α+β{R_{mt}}+{ε_{t}}\ \ \ (1) \)
Bring in the variables, which can be transformed into
\( {R_{x}}={α_{x}}+{β_{x}}{R_{ymt}}+{ε_{x}}\ \ \ (2) \)
Using a longer window to estimate \( {R_{t}}=α+β{R_{mt}}+{ε_{t}} \) , gives \( \hat{α} \) , \( \hat{β} \) and is used to estimate \( {\hat{R}_{t}} \) within the event.
Denoted that:
\( {\hat{R}_{x}} :estimated returns of selected stock X in the window period \)
\( {\hat{α}_{x}} :estimated arbitrage index of selected stock \) X
\( {\hat{β}_{x}} :estimated risk exposure index of selected stock \) X
\( {\hat{R}_{ymt}}:estimated returns of Y {country^{ \prime }}s market by corresponding index in the window period \)
\( {\hat{ε}_{x}} :the estimated the zero mean disturbance term \)
\( A{R_{t}}={R_{t}}-(α+β{R_{mt}})\ \ \ (3) \)
Bring in the variables, which can be transformed into
\( A{R_{x}}={R_{x}}-({α_{x}}+{β_{x}}{R_{ymt}})\ \ \ (4) \)
The standardize abnormal return
\( {AR_{x}}={ε_{x}}~N(0,{σ^{2}})\ \ \ (5) \)
Denoted that:
\( {AR_{x}}:abnormal returns of selected stock X in the window period \)
\( CAR(X)=\sum _{i=1}^{X}{AR_{i}}=\sum _{i=1}^{X}{ε_{i}}~N(0,{Xσ^{2}})\ \ \ (6) \)
\( CAR(X):culmulative abnormal returns of selected stock X in the window period \)
Null hypothesis ( \( {H_{0}} \) ):
\( \sum _{i=1}^{X}{ε_{i}}=0\ \ \ (7) \)
The occurrence of the first continental lockdown in the United States/ the first official lockdown (Wuhan) in China had no impact on the price of selected stock X
Alternative hypothesis ( \( {H_{1}} \) ):
\( \sum _{i=1}^{X}{ε_{i}}≠0\ \ \ (8) \)
The occurrence of the first continental lockdown in the United States/ the first official lockdown (Wuhan) in China had impact on the price of selected stock X
Estimate the \( {σ^{2}} \) from the estimation window:
\( {\hat{σ}^{2}}=\frac{\sum _{i=1}^{X}{{\hat{ε}_{i}}^{2}}}{X}\ \ \ (9) \)
Take it into the normal distribution:
\( \frac{\sum {\hat{ε}_{i}}}{\sqrt[]{X{\hat{σ}^{2}}}}~N(0,1)\ \ \ (10) \)
Then test it with the 95% confidence interval,whether:
\( 0 is included in [\frac{\sum {\hat{ε}_{i}}}{\sqrt[]{X{\hat{σ}^{2}}}}-1.96×\sqrt[]{X{\hat{σ}^{2}}}, \frac{\sum {\hat{ε}_{i}}}{\sqrt[]{X{\hat{σ}^{2}}}} +1.96×\sqrt[]{X{\hat{σ}^{2}}} ]\ \ \ (11) \)
The results were used to determine whether the researcher could reject the \( {H_{0}} \) .
The research methodology of the thesis mainly adopts quantitative research, based on secondary data (i.e. publicly available historical stock prices) provided by yahoo finance for data statistics, establishing regression equations and time window comparisons, using mathematical models to calculate the indicators and their values for the objects of analysis, and conducting hypothesis testing, setting the null hypothesis that time has no effect on individual stock returns, and rejecting the null hypothesis through window estimation to provide real and valid data assurance for the conclusions of the thesis.
This paper began its research on 17 October 2021 with Professor Oliver Linton teaching the mathematical calculation methods and research methodology and providing research ideas. The researcher collected the historical share prices of the companies under study through yahoo finance and other means, and after determining the scope and nature of the study, conducted extensive research on their data, as long as the direction and results of the study were. Informed consent was not issued to the companies interviewed as the data used was publicly available.
5.Result
For the high-end hospitality sector, the researchers chose the following two companies and judged the impact of the epidemic on share prices broadly from a 5-year share price chart.
Company1 name: Marriott International, Inc. MAR, High-end hospitality sector in the US market, Listed on Nasdaq in 2014
Company2 name: Hotel Shangri-la, Inc.2 000069.HK. Asia's high-end hotel industry with the largest number of hotels in China, Listed on 17 January 1993.
This paper compares the magnitude of the impact of COVID-19 on two firms in different markets by reference to individual stock returns versus total market returns.
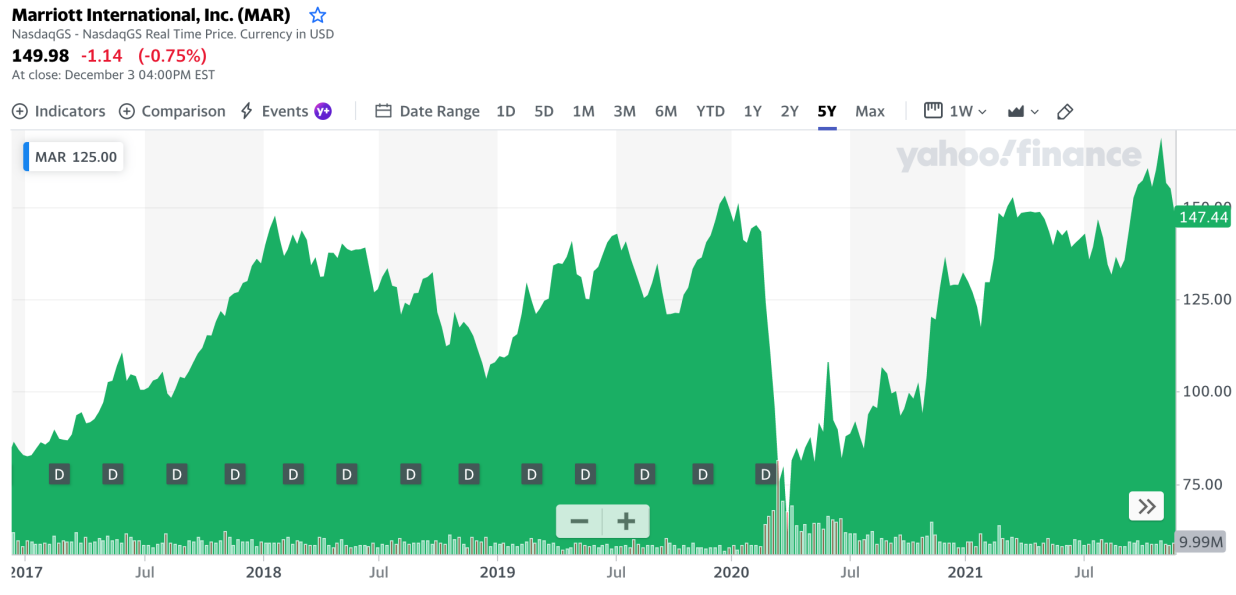
Fig. 5. The five-year stock price fluctuation table of MAR
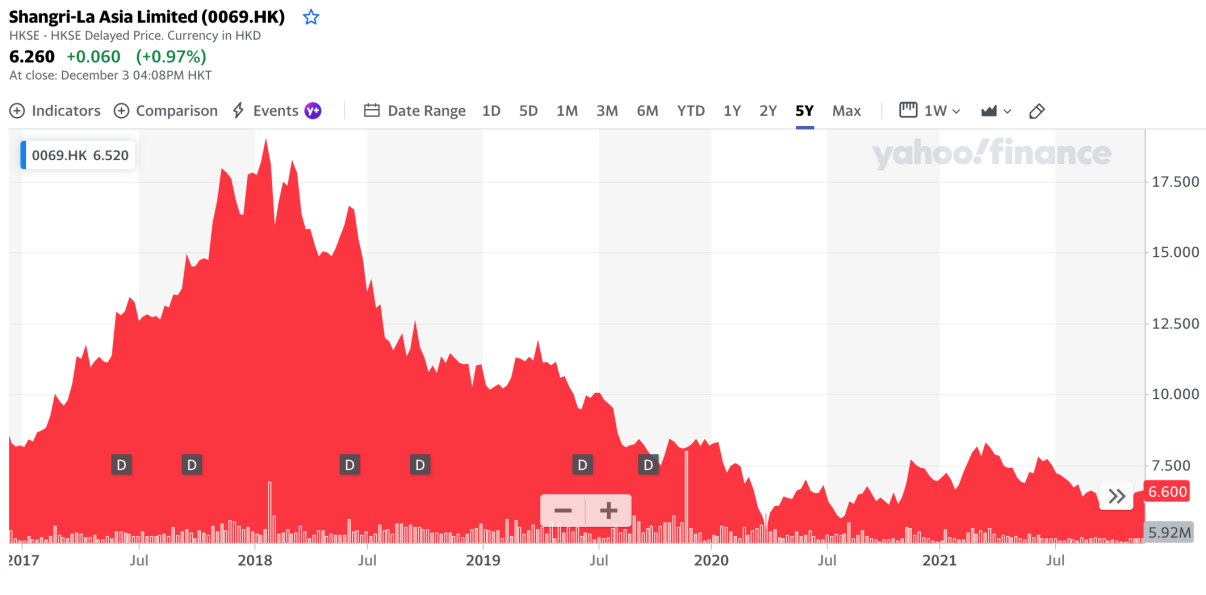
Fig. 6. The five-year stock price fluctuation table of Hotel Shangri-la
Figures 5 and 6 show the stock movements of the two companies selected over a five-year period. A visual analysis of the five-year share price volatility table for both companies shows that there has been a precipitous fall in MAR's share price since the outbreak of COVID-19, with it taking about a year to subsequently return to pre-decline levels. Hotel Shangri-la's share price, on the other hand, has continued to fall since 2018 and has also continued to fall following the outbreak, but not by much.
The researchers compared market normal returns with stock returns after COVID-19 to analyze the difference in returns before and after time, with the following results.
The trendline formula will be displayed in the format y = βx + \( α \) . The system preceding x is the Beta coefficient that we will calculate.
The \( {R^{2}} \) value reflects the degree of correlation between the variance of stock returns and the variance of overall market returns. A large \( {R^{2}} \) value indicates a high degree of variance correlation between the two. Smaller values indicate a low degree of correlation between the two.
The researchers chose two windows for comparison and named them Window 1 (estimation window) and Window 2 (event window), with the event window being the period when the impact of COVID-19 was greatest and most sudden, i.e., the period after the beginning of the outbreak when countries adopted a blockade policy.
For the calculation of the exposure index β, the exposure index β was calculated by analyzing the trend line with the following results:
Fig. 7. MAR's estimation window
As shown in Figure 7, researchers took the estimation window of the occurrence of the first continental lockdown in the United States from 22/01/2019 to 21/01/2020 (252 days).
Using the trend line formula, it is known that in the estimation window, the beta of MAR is 1.1858.
Fig. 8. MAR's event window
As shown in Figure 8, researchers took the event window of the first continental lockdown in the United States (22/03/2020) is 20/02/2020 to 22/04/2020 (44 days).
Using the trend line formula, it is known that in the estimation window, the beta of MAR is 0.8095.
For the estimation window:
\( {\hat{α}_{m}}=0.0002 {\hat{β}_{m}}=1.1858\ \ \ (12) \)
For the event window:
\( {\hat{α}_{m}}=-0.0087 {\hat{β}_{m}}=0.8095\ \ \ (13) \)
After getting \( {\hat{α}_{s}} \) and \( {\hat{β}_{s}} \) , test the validity of the model by:
\( \frac{{\hat{α}_{s}}}{st.err(\hat{α})},\frac{{\hat{β}_{s}}}{st.err(\hat{β})}\ \ \ (14) \)
All the results are not equal to 1, therefore, \( {\hat{α}_{s}} \) and \( {\hat{β}_{s}} \) are valid.
Table 1. MAR's results in the event window
sum of \( {\hat{ε}_{i}} \) | estimated variance \( {\hat{σ}^{2}} \) | lower 95% | upper 95% |
-0.335675867 | 0.003895558 | -1.1471682 | -0.8112153 |
Table1 shows the MAR's results in the event window and integrate the data into a three-line table.
It is found that:
\( [\frac{\sum {\hat{ε}_{i}}}{\sqrt[]{m{\hat{σ}^{2}}}}-1.96×\sqrt[]{m{\hat{σ}^{2}}}, \frac{\sum {\hat{ε}_{i}}}{\sqrt[]{m{\hat{σ}^{2}}}} +1.96×\sqrt[]{m{\hat{σ}^{2}}} ] \)
\( =[-1.1471682, -0.8112153]\ \ \ (15) \)
Which is not included 0. Therefore, reject the \( {H_{0}} \) in the significance level of 95%.
Fig. 9. Hotel Shangri-la 's estimation window
As shown in Figure 9, researchers took the estimation window of the first continental lockdown (Wuhan) in China from 13/11/2018 to 20/11/2019 (252 days).
Using the trend line formula, it is known that in the estimation window, the beta of MAR is 0.8376.
Fig. 10. Hotel Shangri-la 's event window
As shown in Figure 10, researchers took the event window of the first continental lockdown (Wuhan) in China from 20/12/2019 to 26/02/2020 (44 days). (Length of periods are the same as the previous event’s)
Using the trend line formula, it is known that in the estimation window, the beta of MAR is 1.0055.
Using the same calculation procedure as before, it follows that
For the estimation window:
\( {\hat{α}_{s}}=-0.0011 {\hat{β}_{s}}=0.837\ \ \ (16) \)
For the event window:
\( {\hat{α}_{s}}=-0.0024 {\hat{β}_{s}}=1.0055\ \ \ (17) \)
After getting \( {\hat{α}_{s}} \) and \( {\hat{β}_{s}} \) , test the validity of the model by:
\( \frac{{\hat{α}_{s}}}{st.err(\hat{α})},\frac{{\hat{β}_{s}}}{st.err(\hat{β})}\ \ \ (18) \)
All the results are not equal to 1, therefore, \( {\hat{α}_{s}} \) and \( {\hat{β}_{s}} \) are valid.
Table 2. Hotel Shangri-la 's results in the event window
sum of \( {\hat{ε}_{i}} \) | estimated variance \( {\hat{σ}^{2}} \) | lower 95% | upper 95% |
-0.062250248 | 0.000160552 | -4.4128934 | -4.39904735 |
Table2 shows the Hotel Shangri-la 's results in the event window and integrate the data into a three-line table.
It is found that:
\( [\frac{\sum {\hat{ε}_{i}}}{\sqrt[]{m{\hat{σ}^{2}}}}-1.96×\sqrt[]{m{\hat{σ}^{2}}}, \frac{\sum {\hat{ε}_{i}}}{\sqrt[]{m{\hat{σ}^{2}}}} +1.96×\sqrt[]{m{\hat{σ}^{2}}} ] \)
\( =[-4.4128934, -4.39904735]\ \ \ (19) \)
Which is not included 0. Therefore, reject the \( {H_{0}} \) in the significance level of 95%.
Similarly, the researchers selected two hotel companies catering to the lower and mid-range users and conducted the same event analysis with the following results.
The estimation periods of CHH and 600754.SS were 22/01/2019 to 21/01/2020 and 08/11/2018 to 20/11/2019, respectively, which were different from the MAR and 0069. H.K.'s but with the same window lengths (252 days). Also, the event windows of CHH and 600754.SS were 20/02/2020 to 22/04/2020 and 19/12/2019 to 27/02/2020, respectively, with the same window lengths of MAR and 0069. H.K. (44 days).
The data treatment of budget hotels in the U.S. and China is shown here.
Choice Hotel International (CHH)
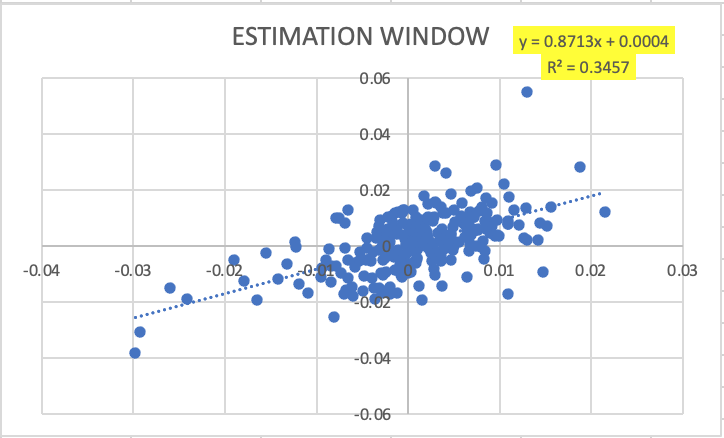
Fig. 11. CHH's estimation window
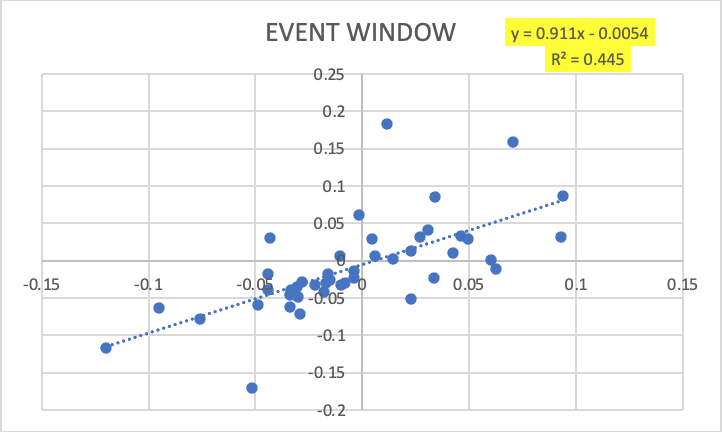
Fig. 12. CHH's event window
Figure 11 shows the CHH's estimation window and Figure 12 shows the CHH's event window,
For the estimation window:
\( {\hat{α}_{c}}=0.0004 {\hat{β}_{c}}=0.8713\ \ \ (20) \)
For the event window:
\( {\hat{α}_{c}}=-0.0054 {\hat{β}_{c}}=0.9110\ \ \ (21) \)
After getting \( {\hat{α}_{c}} \) and \( {\hat{β}_{c}} \) , test the validity of the model by:
\( \frac{{\hat{α}_{c}}}{st.err(\hat{α})}, \frac{{\hat{β}_{c}}}{st.err(\hat{β})}\ \ \ (22) \)
All the results are not equal to 1. Therefore, \( {\hat{α}_{c}} \) and \( {\hat{β}_{c}} \) are valid.
Jinjiang International (600754.SS)
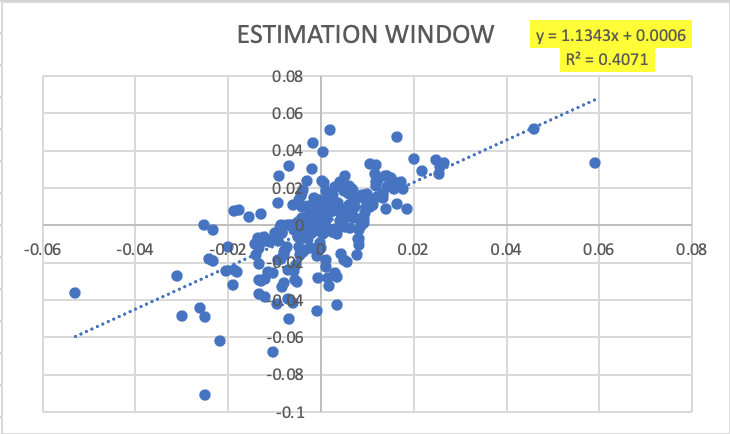
Fig. 13. Jinjiang International's estimation window
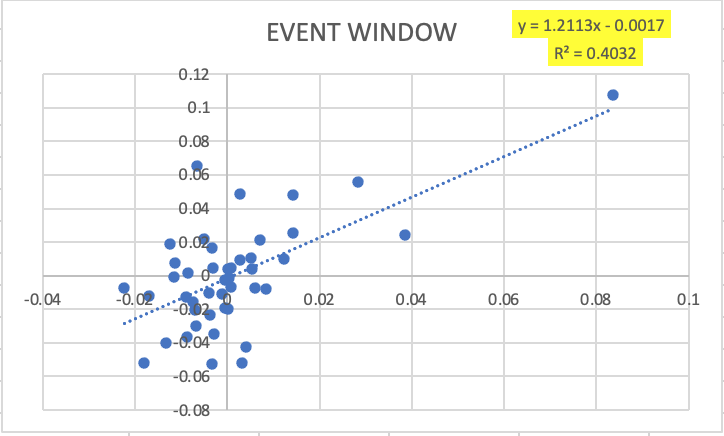
Fig. 14. Jinjiang International's event window
Figure 13 shows the Jinjiang International's estimation window and Figure 14 shows the Jinjiang International's event window.
For the estimation window:
\( {\hat{α}_{j}}=0.0006 {\hat{β}_{j}}=1.1343\ \ \ (23) \)
For the event window:
\( {\hat{α}_{j}}=-0.0017 {\hat{β}_{j}}=1.2113\ \ \ (24) \)
After getting \( {\hat{α}_{j}} \) and \( {\hat{β}_{j}} \) , test the validity of the model by:
\( \frac{{\hat{α}_{j}}}{st.err(\hat{α})},\frac{{\hat{β}_{j}}}{st.err(\hat{β})}\ \ \ (25) \)
All the results are not equal to 1. Therefore, \( {\hat{α}_{j}} \) and \( {\hat{β}_{j}} \) are valid.
Company1 name: Choice Hotel International (CHH)
Choice Hotels International, Inc. is a hotel franchisor based in Rockville, Maryland, USA. The company is one of the largest hotel chains in the world, and its budget hotels are widely distributed and well known, so CHH was chosen as the source of data on budget hotels Company2 name: Jinjiang International (600754.SS)
JinJiang International (Holdings) Limited is a Chinese state-owned travel and hotel company headquartered in Shanghai, China. The group operates a number of budget hotel chains including JinJiang Star and Bastille Express and Magnotel, which account for a large share of the market in all provinces of China and are therefore used as a source of market data for budget hotels in China.
Table 3. Summary table of data for the four hotels
Name | Country | Type | Esti window alpha | Esti window beta | Event window alpha | Event window beta | Diff \( α \) | Diff \( β \) |
MAR | US | Lux | 0.0002 | 1.1858 | -0.0087 | 0.8095 | -0.0089 | -0.3763 |
0069. HK | CHN | Lux | -0.0011 | 0.8376 | -0.0024 | 1.0055 | -0.0013 | 0.1679 |
CHH | US | Bud | 0.0004 | 0.8713 | -0.0054 | 0.911 | -0.0058 | 0.0397 |
600754.SS | CHN | Bud | 0.0006 | 1.1343 | -0.0017 | 1.2113 | -0.0023 | 0.077 |
Table3 calculates the data for all the selected hotels and sums them up in a three-line table. From the results, the experimental results are largely in line with the expected conjectures.
6. Discussion
If investors want to put in stocks in the hotel sector, the applicability of the study's findings may not be very high as the massive city closures in both countries have ended. However, returns on risk-free investments in the U.S. have fallen more than in China during the epidemic in both countries. For both luxury and budget hotels, it is the luxury hotels that are more correlated with changes in market indices, whether beta is up or down due to market changes. So, we think it is safer to invest in budget hotels in China even during the recovery phase of the epidemic.
The reason for such differences, we suspect, is the difference in policy between the U.S. and China in response to the outbreak. For example, China has a 14-day imposed quarantine policy, which will commandeer hotels as quarantine sites, and the government will give appropriate subsidies, so allowing for a certain level of usage and profitability of hotel rooms. According to the regulation, once it becomes a segregated hotel, it cannot be opened to the public, and given the economic factors, segregated services are not available in high-end hotels.
Examining only a single first lockdown event would not be sufficient if one wanted to clarify better the impact of the full-time period of the new crown epidemic on Chinese and the U.S. hospitality sector stocks and to try to predict some future price direction.
7.Conclusion
The research found that although all the arbitrage indexes ( \( α \) ) of the hospitality stocks are lower in the first lockdown time than the estimation period, the magnitudes of the U.S. stocks' drops are more significant. These \( α \) indexes reflect the fact that all hotel sectors went from having more profitable alpha returns by taking unsystematic risks to the less profitable returns during the city closure.
For the risk exposure indexes (β), only one of the U.S. stock's β was lower in the first continental lockdown time than the estimation period and was dropped from above 1 to between 0 and 1. The β index reflects the fact that luxury hotel sectors in the U.S. went from having greater share price volatility than the market index to less volatility than the market index during the closure periods. However, stocks in the Chinese market have increased in their responsiveness to market share price, whether they are in luxury or budget hotel sectors.
As the four stocks are of different types and regions, a direct comparison of the indices does not show the changes; making a differential comparison of the absolute changes in the indices around the time of the event can look for some similarities and differences. By investigating the magnitudes of the indexes in two stock markets, we find that the change in the arbitrage index is greater for U.S. equities than for Chinese equities. At least twice as much as the change in the same type of Chinese hotel index. In terms of the change in risk exposure indexes, while the differential in U.S. stocks is also relatively greater than that in Chinese stocks, it is more evident that the change in high-end hotel stocks is much greater than the change in economy hotels.
In terms of the study's findings, the entire hotel industry in China and the United States, whether luxury or budget hotels, were negatively affected by the first lockdown of the outbreak. To be specific, differences in hotel-type compared to differences in location had a greater impact on the stock price of hotels.
References
[1]. Lento, C., & Gradojevic, N. (2021). S&P 500 Index Price Spillovers around the STR. 2020. Trend Report - Country: Country Tract: Submarket., http://www.str.com
[2]. Khan, K., Han, Z., & Muhammad Haroon, S. (2020). The Impact of COVID-19 Pandemic on Stock Markets: An Empirical Analysis of World Major Stock Indices -The Journal of Asian Finance, Economics and Business | Korea Science., https://www.koreascience.or.kr/article/JAKO202020952022559.page
[3]. Deloitte Research Center. (2020). China Real Estate Innovation and Development Report (No. 19). Deloitte Consulting Group.
[4]. Chen L, Qv X.H., Market Response to Contagious Public Health Events—A Research Based on COVID-19’s Impact on Chinese Stock Market. Financial Forum (07),25-33+65.
[5]. Huang B. (2011). Research on the weak effectiveness of Chinese stock market and American stock market. Times Finance (21),163.
[6]. Khan, A., Khan, M. Y., Khan, A. Q., Khan, M. J., & Rahman, Z. U. (2021). Testing the weak form of efficient market hypothesis for socially responsible and Shariah indexes in the USA. Journal of Islamic Accounting and Business Research, 12(5), 625-645.
[7]. Carter, D. A., Mazumder, S., Simkins, B. J., & Sisneros, E. (2021). The stock price reaction of the COVID-19 pandemic on the airline, Hotel, and Tourism Industries. SSRN Electronic Journal.
[8]. Wu, W., Lee, C., Xing, W., & Ho, S. (2021). The impact of the COVID-19 outbreaks on Chinese-listed tourism stocks. Financial Innovation, 7(1).
[9]. Marriott International Group. (n.d.). Hotels & Resorts | Book your hotel directly with Marriott Bonvoy. Marriott International., https://www.marriott.com
[10]. Shangri-la Group. (n.d.). Shangri-la Group., https://www.shangri-la.com/cn/
[11]. Data source STR Global and CITIC Securities Research STR Global, Ltd. (2020). Trend Report - Country: Country Tract: Submarket. STR. Retrieved 2020, from http;//www.str. Com
[12]. STR Global, Ltd. (2020). Trend Report - Country: Country Tract: Submarket. STR., https://www.str.com
[13]. Jin Jiang International (Holdings) Co., Ltd. (n.d.). Jiang International (Holdings) Co., Ltd., http://www.jinjiang.com/hq/en
[14]. Choice Hotels International, Inc. (n.d.). Choice Hotels International, Inc., https://www.choicehotels.com/
Cite this article
Gui,Y.;Han,Y.;Zhou,H.;Chen,X. (2023). Market Volatility of the Chinese and U.S Stock Based Hospitality Industry during the Pandemic. Advances in Economics, Management and Political Sciences,3,106-121.
Data availability
The datasets used and/or analyzed during the current study will be available from the authors upon reasonable request.
Disclaimer/Publisher's Note
The statements, opinions and data contained in all publications are solely those of the individual author(s) and contributor(s) and not of EWA Publishing and/or the editor(s). EWA Publishing and/or the editor(s) disclaim responsibility for any injury to people or property resulting from any ideas, methods, instructions or products referred to in the content.
About volume
Volume title: Proceedings of the 6th International Conference on Economic Management and Green Development (ICEMGD 2022), Part Ⅰ
© 2024 by the author(s). Licensee EWA Publishing, Oxford, UK. This article is an open access article distributed under the terms and
conditions of the Creative Commons Attribution (CC BY) license. Authors who
publish this series agree to the following terms:
1. Authors retain copyright and grant the series right of first publication with the work simultaneously licensed under a Creative Commons
Attribution License that allows others to share the work with an acknowledgment of the work's authorship and initial publication in this
series.
2. Authors are able to enter into separate, additional contractual arrangements for the non-exclusive distribution of the series's published
version of the work (e.g., post it to an institutional repository or publish it in a book), with an acknowledgment of its initial
publication in this series.
3. Authors are permitted and encouraged to post their work online (e.g., in institutional repositories or on their website) prior to and
during the submission process, as it can lead to productive exchanges, as well as earlier and greater citation of published work (See
Open access policy for details).
References
[1]. Lento, C., & Gradojevic, N. (2021). S&P 500 Index Price Spillovers around the STR. 2020. Trend Report - Country: Country Tract: Submarket., http://www.str.com
[2]. Khan, K., Han, Z., & Muhammad Haroon, S. (2020). The Impact of COVID-19 Pandemic on Stock Markets: An Empirical Analysis of World Major Stock Indices -The Journal of Asian Finance, Economics and Business | Korea Science., https://www.koreascience.or.kr/article/JAKO202020952022559.page
[3]. Deloitte Research Center. (2020). China Real Estate Innovation and Development Report (No. 19). Deloitte Consulting Group.
[4]. Chen L, Qv X.H., Market Response to Contagious Public Health Events—A Research Based on COVID-19’s Impact on Chinese Stock Market. Financial Forum (07),25-33+65.
[5]. Huang B. (2011). Research on the weak effectiveness of Chinese stock market and American stock market. Times Finance (21),163.
[6]. Khan, A., Khan, M. Y., Khan, A. Q., Khan, M. J., & Rahman, Z. U. (2021). Testing the weak form of efficient market hypothesis for socially responsible and Shariah indexes in the USA. Journal of Islamic Accounting and Business Research, 12(5), 625-645.
[7]. Carter, D. A., Mazumder, S., Simkins, B. J., & Sisneros, E. (2021). The stock price reaction of the COVID-19 pandemic on the airline, Hotel, and Tourism Industries. SSRN Electronic Journal.
[8]. Wu, W., Lee, C., Xing, W., & Ho, S. (2021). The impact of the COVID-19 outbreaks on Chinese-listed tourism stocks. Financial Innovation, 7(1).
[9]. Marriott International Group. (n.d.). Hotels & Resorts | Book your hotel directly with Marriott Bonvoy. Marriott International., https://www.marriott.com
[10]. Shangri-la Group. (n.d.). Shangri-la Group., https://www.shangri-la.com/cn/
[11]. Data source STR Global and CITIC Securities Research STR Global, Ltd. (2020). Trend Report - Country: Country Tract: Submarket. STR. Retrieved 2020, from http;//www.str. Com
[12]. STR Global, Ltd. (2020). Trend Report - Country: Country Tract: Submarket. STR., https://www.str.com
[13]. Jin Jiang International (Holdings) Co., Ltd. (n.d.). Jiang International (Holdings) Co., Ltd., http://www.jinjiang.com/hq/en
[14]. Choice Hotels International, Inc. (n.d.). Choice Hotels International, Inc., https://www.choicehotels.com/