


1. Introduction
The impact of technological innovation on economic growth has always been the focus of research in the field of economics. It is widely established in the economic literature, both theoretically and empirically, that scientific and technological innovation play a key role in promoting a country’s or region’s economic progress. As early as 1766, Adam Smith proposed in “The Wealth of Nations” that the division of labor, capital accumulation and technological innovation are the three driving forces for economic growth [1]. Solow separated technological innovation from the Cobb-Douglas production function and further revealed the relationship between scientific and technical innovation and economic growth [2]. Wan combined the panel data from 30 Chinese provinces from 1997 to 2006 to verify the positive influence of regional technical innovation capacity on economic growth [3]. Li & XV conducted empirical research on the relationship between regional technological innovation and economic growth in 30 provinces. The research results show that regional technological innovation has a significant positive impact on economic growth, and there is significant regional heterogeneity in this impact [4]. There is a positive correlation between technological innovation capability and economic development. However, regional technological innovation capabilities and economic progress are not entirely positively correlated. This was discovered by Wang, XV, Yang and Tao in their research [5]. There are relatively few research literature on the differences between China’s economic growth and scientific and technological innovation among regions. Even though many scholars have discussed this topic, few existing studies have applied two-way fixed effects models. Since China is a relatively big region with evident divisions and uneven resource distribution among provinces, using two-way fixed effects models can enhance the validity of the results. Therefore, this article selects 30 provinces and autonomous regions in China from 2011 to 2020 as the research objects. A bidirectional fixed effects model is used in the study to analyze the impact of technological innovation on economic development. The statistics are from the National Bureau of Statistics of China (NBSC) [6].
2. Econometric Model
In order to study the impact of technological innovation on economic development, the author sets three control variables. They are the total amount of technology contract transactions, year-end resident population, total investment of foreign-invested enterprises, and marketization indicators, and then establish a basic model:
\( ln{GDP_{it}}={β_{0}}+{β_{1}}ln{PT_{it}}+{θ_{1}}ln{MI_{it}}+{θ_{2}}ln{POP_{it}}+{θ_{3}}ln{TIF_{it}}+{θ_{4}}ln{TCT_{it}}+{α_{i}}+{γ_{t}}+{μ_{it}} \) (1)
Where, \( i=1,2,…,30 \) and \( t=1,2,…,10 \) ; \( {α_{i}} \) and \( {γ_{t}} \) are province and time fixed effects, respectively. Province-specific (but time-invariant) and time-specific (but province-invariant) unobserved confounders are both flexibley accounted for by the inclusion of province and time fixed effects.
3. Data Sources and Variable Selection
3.1. Data Sources
This paper’s empirical sample uses balanced panel data from 30 Chinese provinces and autonomous areas from 2011 to 2020. Data of GDP, authorized patent applications, total amount of technical contract transactions, permanent resident population at the ending of the year, total investment of foreign-invested enterprises and market-oriented indicators of provinces and municipalities were obtained from the National Bureau of Statistics of China (NBSC) [6].
3.2. Variable Selection
To investigate whether scientific and technical innovation contributes to economic growth, In the paper, the author takes economic development as the dependent variable, and then reflects the economic development level of each region through the GDP of each province and autonomous region.
Patents are one of the essential indicators of scientific and technical innovation output and an important benchmark for measuring the innovation capacity and technology protection level of a region or unit [7][8]. Also, Sun, Zhao, and Zhang, thought that the patent as a unique perspective to evaluate the regional scientific and technical innovation capability has greater advantages [8]. Therefore, the number of authorized patent applications is used as an explanatory variable in this paper.
There are many other factors affecting economic growth. In order to control these factors, the following control variables are added into the regression referring to related researchers Rodriguez-Pose and Wan: 1. Total amount of technical contract transactions; 2. Permanent resident population at the ending of the year; 3. Total investment of foreign-invested enterprises; 4. Market-oriented indicators. Given the possible large fluctuations and heteroscedasticity between data, all variables are taken as logarithms [3][9].
4. Descriptive Statistics of Variables
Table 1: Variables used to quantify the relation between economic development and technological innovation.
Variable Name | Explanation; |
lnGDP | Logarithmic value of GDP in hundred million Yuan; |
lnPT | Logarithmic value of annual number of authorized patents; |
lnMI | Logarithmic value of market-oriented indicators; |
lnPOP | Logarithmic value of permanent resident population at the end of the year in hundred thousand; |
lnTIF | Logarithmic value of total investment of foreign-invested enterprises in million dollars; |
lnTCT | Logarithmic value of total amount of technical contract transactions in ten million; |
The definitions of all variables are shown in Table1.
Table 2: Evaluation of variables.
Variable Name | Observed Value | Mean | Standard Deviation | Min | Max |
lnGDP | 300 | 9.784 | 0.884 | 7.223 | 11.62 |
lnPT | 300 | 10.11 | 1.439 | 6.219 | 13.47 |
lnMI | 300 | 7.941 | 1.892 | 3.359 | 11.93 |
lnPOP | 300 | 8.206 | 0.741 | 6.342 | 9.443 |
lnTIF | 300 | 11.28 | 1.401 | 7.948 | 14.82 |
lnTCT | 300 | 13.94 | 1.790 | 8.642 | 17.96 |
Table 2 shows descriptive statistics for the variables taken.
Table 3: Correlation analysis.
lnGDP | lnPT | lnMI | lnPOP | lnTIF | lnTCT | |
lnGDP | 1 | |||||
lnPT | 0.934*** | 1 | ||||
lnMI | 0.756*** | 0.863*** | 1 | |||
lnPOP | 0.869*** | 0.715*** | 0.460*** | 1 | ||
lnTIF | 0.813*** | 0.867*** | 0.887*** | 0.505*** | 1 | |
lnTCT | 0.679*** | 0.774*** | 0.703*** | 0.427*** | 0.713*** | 1 |
t statistics in parentheses, * p < 0.10, ** p < 0.05, *** p < 0.01
The multicollinearity test is then used in Table 4. Variance Inflation Factor (VIF) is used to determine the multicollinearity of explanatory variables. According to the test results, the Variance Inflation Factor of all variables does not exceed 10, there is no serious multicollinearity problem among variables in the previous model.
Table 4: Multicollinearity test.
Variable | VIF | 1/VIF |
lnTIF | 5.29 | 0.188942 |
lnMI | 4.94 | 0.202341 |
lnTCT | 2.16 | 0.463006 |
lnPOP | 1.36 | 0.735559 |
Mean VIF | 3.44 |
5. Empirical Test and Result Analysis
5.1. Hausman Test
A fixed effect model and a random effect model are used for estimation and analysis, respectively. However, Hausmann test results strongly reject the random effect model, so the fixed effect model is used for regression analysis of the selected full sample data.
5.2. Analysis on the Impact of Technological Innovation on Economic Development
5.2.1. Basic Regression Analysis
From Table 5, technological innovation has a significant positive correlation with economic development at a significance level of 1%. After a series of control variables, the coefficient of technological innovation on economic development is 0.234. From the perspective of control variables, marketization indicators have a significant positive impact on economic development. The significance level is 5%. This number indicates that the higher the marketization index, the better the level of economic development. Permanent resident population, total amount of technical contract transactions and total amount of foreign-invested enterprises all significantly affect economic development at the significance level of 1%, indicating that the higher the permanent resident population, total amount of technical contract transactions and total amount of foreign-invested enterprises, the higher the level of economic development.
Table 5: The results of FEM.
(1) | (2) | |
'lnGDP' | 'lnGDP' | |
lnPT | 0.410*** | 0.234*** |
(35.33) | (11.55) | |
lnMI | 0.027** | |
(2.30) | ||
lnPOP | 1.530*** | |
(7.06) | ||
lnTIF | 0.069*** | |
(3.89) | ||
lnTCT | 0.048*** | |
(4.48) | ||
_cons | 5.644*** | -6.796*** |
(48.09) | (-3.94) | |
R2 | 0.823 | 0.884 |
F | 1248.042 | 404.777 |
N | 300 | 300 |
t statistics in parentheses, * p < 0.10, ** p < 0.05, *** p < 0.01
5.2.2. Analysis of Heterogeneity
China’s economic growth has been extremely uneven [5]. Therefore, various variables in the eastern and western regions of the economic growth pattern may be different. To verify the difference in magnitude between the variables, a time series plot of the different variables for the East and West regions is drawn (0 for the West region and 1 for the East region).
Figure 1 (lnGDP) shows that the eastern region has a significantly higher order of magnitude of GDP than the western region and that the two regions show significantly different trends, confirming the different economic development situations in the east and west. Figure 2 (lnPT) shows that the number of patents in the eastern region is of a higher order of magnitude than in the western region and that the trends in the two regions are also different. Figures 3-5 show that the magnitude and trends of the control variables also differ between the two regions. The regression analysis has been done to determine whether there are variations in the drivers of GDP development between the two regions, specifically in relation to the key leverage factors.
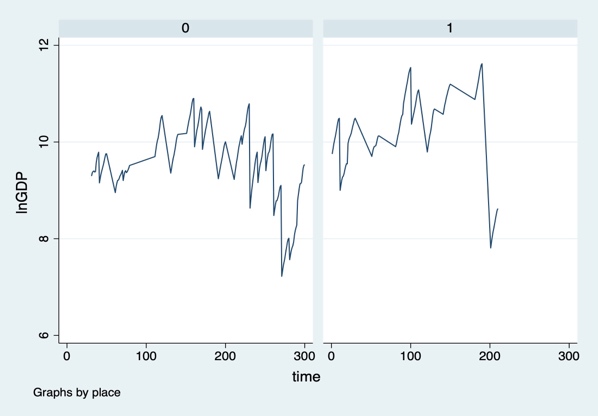
Figure 1: lnGDP by place.
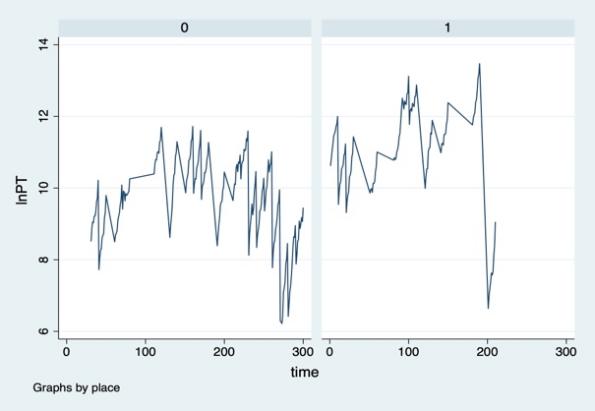
Figure 2: lnPT by place.
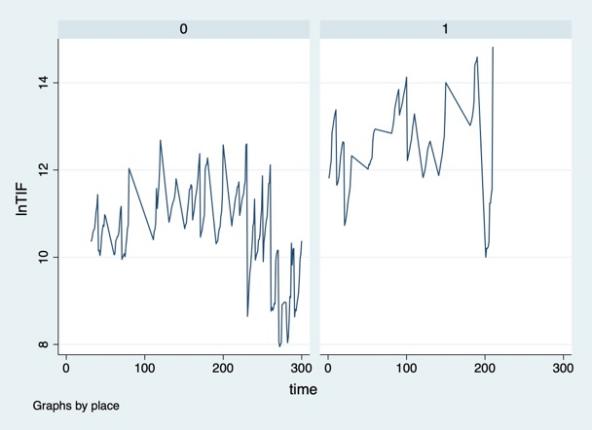
Figure 3: lnTIF by place.
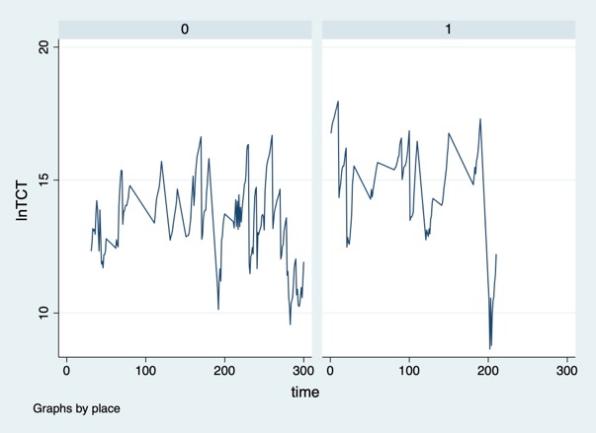
Figure 4: lnTCT by place.
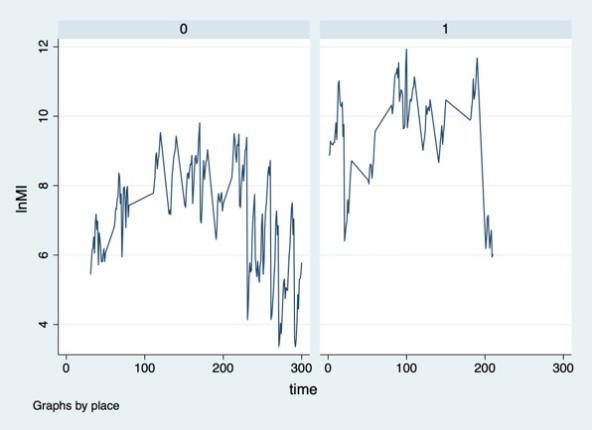
Figure 5: lnMI by place.
From Table 6, the coefficients of technological innovation in the eastern and western regions are almost identical, and both have a significantly positive impact on economic development. The role of foreign investment (lnTIF) differs between the two regions, with foreign investment playing a greater role in the west and having a positive impact on economic development, probably because investment in the east is saturated and the marginal effect is reduced, resulting in a negative correlation between investment and economic development. The role of population (lnPOP) is also different between the two regions. This indicates that for the eastern region, the labor-driven GDP is stronger than that in the western region, which is also consistent with China’s labor force demographic trends. Thus, the proportion of highly educated people will be higher, which will drive technological innovation.
Table 6: Regional heterogeneity.
(1) | (2) | |
Eastern | Western | |
lnPT | 0.247*** | 0.225*** |
(5.50) | (10.45) | |
lnMI | 0.003 | 0.012 |
(0.13) | (0.77) | |
lnPOP | 2.728*** | 1.304*** |
(6.28) | (5.06) | |
lnTIF | -0.012 | 0.121*** |
(-0.37) | (5.47) | |
lnTCT | 0.054*** | 0.043*** |
(2.37) | (3.66) | |
_cons | -15.829*** | -5.194** |
(-4.67) | (-2.51) | |
R2 | 0.873 | 0.804 |
F | 129.358 | 312.044 |
N | 110 | 190 |
t statistics in parentheses, * p < 0.10, ** p < 0.05, *** p < 0.01
5.3. Robustness Test
In order to eliminate some of the possible endogeneity in the model, this paper will use two-stage least squares to run the regression again. The instrumental variable chosen in the regression is the lagged first order of the core explanatory variable (technological innovation). This instrumental variable has been tested and has passed the correlation test and the weak instrumental variable test.
The World Health Organization (WHO) Director General proclaimed COVID-19 a worldwide pandemic on March 11, 2020. According to Oxford’s research, the outbreak significantly impacted China’s manufacturing industry and caused an economic slump (Shretta) [10]. Considering that the model may be affected by COVID-19, this paper will remove the data of 2020 and conduct regression again, named “Redu”.
From Table 7, the coefficients of technological innovation (lnPT) are 0.262, 0.298, and 0.217, respectively, and are significant at the significance level of 1% and almost identical to the previous research. Also, the coefficient of technological innovation in “Redu” indicates that the model is less affected by COVID-19. Therefore, the regression results of technical innovation on economic development are robust and reliable.
Table 7: Robustness test.
(1) | (2) | (3) | |
'ols' | '2sls' | 'Redu' | |
lnPT | 0.262*** | 0.298*** | 0.217*** |
(10.39) | (9.74) | (10.10) | |
lnMI | -0.024 | -0.032 | -0.003 |
(-1.08) | (-1.52) | (-0.24) | |
lnPOP | 0.544*** | 0.527*** | 1.369*** |
(24.40) | (23.04) | (5.95) | |
lnTIF | 0.158*** | 0.145*** | 0.164*** |
(4.01) | (3.56) | (7.29) | |
lnTCT | 0.006 | -0.001 | 0.048*** |
(0.64) | (-0.13) | (4.48) | |
_cons | 1.002*** | 1.092*** | -6.130*** |
(6.84) | (6.92) | (-3.38) | |
R2 | 0.767 | 0.766 | 0.697 |
F | 2570.655 | / | 407.262 |
N | 300 | 270 | 270 |
t statistics in parentheses, * p < 0.10, ** p < 0.05, *** p < 0.01
6. Conclusion
This paper selected the relevant data of 30 regions in China from 2011 to 2020 as the research object and used the two-way fixed model to empirically analyze the impact of technological innovation on economic development. The results showed that under the conditions of market-oriented indicators, permanent resident population, total amount of technical contract transactions, total amount of foreign-invested enterprises, and other control variables, technological innovation had a significant positive impact on economic development, and the more patent applications and authorizations, the better the economic development. All control variables had a significant positive impact on economic development. Economic trends differ between the East and the West, as do economic development orientations. The following recommendations for policy are given in light of the conclusions mentioned above:Government spending and policy support for scientific and technology innovation should be increased. The government should also introduce and train new science and technology talent, as well as boost financial and tax assistance for emerging science and technology firms. The recommendations made in this paper based on the empirical results are specific to the selected regions only. The economic development orientations of the eastern and western regions are different and therefore the general applicability of the recommendations needs to be further explored.
Acknowledgement
First and foremost, I would like to express my sincere gratitude to the professors in my research workshop who have provided me with invaluable support during the composition of my thesis. In addition, I want to thank all my friends and parents for their inspiration and support. I couldn’t have finished my thesis without their insightful advice and exemplary politeness.
References
[1]. Smith, A. The Wealth of Nations. Ixia Press. (1776).
[2]. Solow, R. M. A Contribution to the Theory of Economic Growth. The Quarterl Journal of Economics, 70(1), 65–94. (1956).
[3]. Wan, Y. Research On Regional Technological Innovation and Economic Growth. Xiamen University. (2009).
[4]. Li, Z., & Xv, W. Regional Science and Technology Innovation and Economic Growth: An Empirical Analysis Based on Panel Data of Provinces. Science&Technology and Economy, pp. 20-24. (2011).
[5]. Wang, W., Xv, Y., Yang, W., & Tao, X. THE INFLUENCE OF REGIONAL ECONOMIC DEVELOPMENT BASED ON SCIENTIFIC AND TECHNOLOGICAL INNOVATION CAPACITY. Journal of Shandong Normal University (Natural Science), pp. 126-131+136. (2017).
[6]. Statistical Data. National Bureau of Statistics of China. http://www.stats.gov.cn/english/
[7]. Tian, Y., Yang, Z., Fang, S., Chen, et al. The Innovation Ability of Western Region Observed from Invention Patent Quantitative Analysis. Journal of Information, pp. 91-93. (2008).
[8]. Sun, B., Zhao, W., & Zhang, X. Research on the Applicability of Patent Indicators in Evaluating Regional Science and Technology Innovation. Journal of Modern Information, pp. 138-143. (2017).
[9]. Rodríguez‐Pose, A. Innovation prone and innovation averse societies: Economic performance in Europe. Growth and change, 30(1), 75-105. (1999).
[10]. Shretta, R. The economic impact of covid-19. (2020, April 7). Retrieved from https://www.research.ox.ac.uk/article/2020-04-07-the-economic-impact-of-covid-19.
Cite this article
Chen,H. (2023). A Study of How Technological Innovation Affects China's Economic Development. Advances in Economics, Management and Political Sciences,38,70-78.
Data availability
The datasets used and/or analyzed during the current study will be available from the authors upon reasonable request.
Disclaimer/Publisher's Note
The statements, opinions and data contained in all publications are solely those of the individual author(s) and contributor(s) and not of EWA Publishing and/or the editor(s). EWA Publishing and/or the editor(s) disclaim responsibility for any injury to people or property resulting from any ideas, methods, instructions or products referred to in the content.
About volume
Volume title: Proceedings of the 7th International Conference on Economic Management and Green Development
© 2024 by the author(s). Licensee EWA Publishing, Oxford, UK. This article is an open access article distributed under the terms and
conditions of the Creative Commons Attribution (CC BY) license. Authors who
publish this series agree to the following terms:
1. Authors retain copyright and grant the series right of first publication with the work simultaneously licensed under a Creative Commons
Attribution License that allows others to share the work with an acknowledgment of the work's authorship and initial publication in this
series.
2. Authors are able to enter into separate, additional contractual arrangements for the non-exclusive distribution of the series's published
version of the work (e.g., post it to an institutional repository or publish it in a book), with an acknowledgment of its initial
publication in this series.
3. Authors are permitted and encouraged to post their work online (e.g., in institutional repositories or on their website) prior to and
during the submission process, as it can lead to productive exchanges, as well as earlier and greater citation of published work (See
Open access policy for details).
References
[1]. Smith, A. The Wealth of Nations. Ixia Press. (1776).
[2]. Solow, R. M. A Contribution to the Theory of Economic Growth. The Quarterl Journal of Economics, 70(1), 65–94. (1956).
[3]. Wan, Y. Research On Regional Technological Innovation and Economic Growth. Xiamen University. (2009).
[4]. Li, Z., & Xv, W. Regional Science and Technology Innovation and Economic Growth: An Empirical Analysis Based on Panel Data of Provinces. Science&Technology and Economy, pp. 20-24. (2011).
[5]. Wang, W., Xv, Y., Yang, W., & Tao, X. THE INFLUENCE OF REGIONAL ECONOMIC DEVELOPMENT BASED ON SCIENTIFIC AND TECHNOLOGICAL INNOVATION CAPACITY. Journal of Shandong Normal University (Natural Science), pp. 126-131+136. (2017).
[6]. Statistical Data. National Bureau of Statistics of China. http://www.stats.gov.cn/english/
[7]. Tian, Y., Yang, Z., Fang, S., Chen, et al. The Innovation Ability of Western Region Observed from Invention Patent Quantitative Analysis. Journal of Information, pp. 91-93. (2008).
[8]. Sun, B., Zhao, W., & Zhang, X. Research on the Applicability of Patent Indicators in Evaluating Regional Science and Technology Innovation. Journal of Modern Information, pp. 138-143. (2017).
[9]. Rodríguez‐Pose, A. Innovation prone and innovation averse societies: Economic performance in Europe. Growth and change, 30(1), 75-105. (1999).
[10]. Shretta, R. The economic impact of covid-19. (2020, April 7). Retrieved from https://www.research.ox.ac.uk/article/2020-04-07-the-economic-impact-of-covid-19.