


1. Introduction
ESG refers to Environmental, social, and corporate governance. It is a framework that considers environmental and social aspects in the corporate structure. Today, ESG is becoming more and more widely known and there are many researches and analyses of ESG in different companies and regions. Investors may consider ESG factors of different cooperates when making decisions. Many studies have proved that ESG has different influences on stocks in different aspects. First, there is research about the impact of ESG and the market value of listed companies, it points out when companies encounter unfavorable circumstances, their market value tends to decline by approximately 0.1%, while positive announcements generally do not result in any significant average gain for the firms [1]. There is also research confirming the factors that affect the expected returns of high ESG companies, that is investor preferences and risk [2]. There are also research and analysis of the Chinese capital market that enhanced ESG performance diminishes the vulnerability of stock prices [3]. Not only these listed research above, there are also researches about the response of stock markets to the mandatory disclosure of ESG information and research that examine the impact of ESG practices among Chinese listed firms on their likelihood of default [4, 5]. These studies above all prove the connection between ESG and stock market.
This research means to demonstrate and analyze the correlation between ESG and stock price in specific markets and industries through equations and images. In this paper, the company's stock price, ESG score and market value will be used for modeling through logger pro, and by using the stock price and ESG score of companies in different industries and countries, we will be able to analyze the correlation and find out the connection behind. The research aims to use the data to construct equations to try to find out the correlation between ESG and stock price in the same industry, the same region and similar market capitalization companies, and how the correlation is different. This paper also aims to explain questions such as whether investors are more inclined to invest in companies with better ESG scores in regions with more extensive ESG development and research, or whether companies with higher market capitalization have higher ESG scores, such questions about ESG scores’ correlation with company stock prices.
Based on past research, or the stereotype of some investors, we may believe that in regions where ESG is more widely used and studied, investors may be more willing to invest in companies with higher ESG scores; The idea that companies with higher market capitalization may have higher ESG scores, and that companies in the technology industry often have better ESG scores, those questions will be tested with mathematical models and relevant data in the following articles. There are stereotypes that Technology companies may have higher ESG scores because their corporate objective is likely to focus more on environmental impact, but previous papers have pointed out that IT companies do not hold the top positions in terms of ESG ratings [6]. The following article will use a more scientific and visual method to show the relationship between ESG scores and stock prices of different types and regions.
2. Methodology
The research ESG score is collected from Refinitiv ESG company scores. The ESG scores evaluate a company's ESG performance, dedication, and impact across 10 key areas using publicly accessible and verifiable information, ensuring transparency and objectivity [7]. From the description, 75-100 range of the ESG score shows an excellent job of company in ESG area and has high degree of transparency in displaying the data publicly, which 0-25 score range shows the company does a bad job in ESG aspect. Market capitalization and ranking data for companies by region and industry come from companiesmarketcap.com. The site will use and display real-time stock price and market capitalization rankings of companies in different regions and industries, as stated on the site that the availability of stock prices may experience delays, varying from a few minutes to several hours [8]. There might be a small delay or error corresponding to that.
The research framework of this study is mainly divided into two aspects. First, the research will use the market value of companies in three industries (car manufacturing industry, financial service industry and semiconductors industry) to rank those top 30 companies in their industry. Then the research will use the stock price of the top 30 companies in market value and the corresponding ESG score of the company. It will be used to build a Y = ax + b model with the stock price of the company on that day as the independent variable X and the corresponding ESG score of the company as the dependent variable Y. Obtain and analyze the correlation and intercept of ESG scores and company stock prices across different industries or within the same industry. Second, the research will use the market value of companies in three countries (USA, China and Japan) to rank those top 30 companies in their countries. Similar to the method above, the research will collect the stock price of the top 30 companies in those three countries and their ESG scores. It will also be presented by creating the linear fit line through independent variable, stock price, and dependent variable, ESG score. Then the correlation and intercept would be used to analyze and compare the connection between stock prices and ESG scores in different. Both framework uses the stock price and market value data is collected on May 11th 2023 through websites introduced above.
Through simple observation and the use of line charts to analyze the ESG scores and stock prices of different industries and countries, it is clear to find out that the ESG scores of some companies are significantly separated from their stock prices. First of all, although the correlation between the company's ESG score and stock price cannot be seen directly through the line chart, it can be found that the separation between the stock price and the ESG score of Ferrari is relatively obvious, which is 292.18 USD per share and 63 ESG score respectively. Among companies with similar ESG scores, their stock prices are more prominent. Therefore, in the following analysis, we choose to exclude the data of Ferrari to better analyze the correlation between stock prices and ESG scores. In the financial services industry, the large gap between stock price and ESG score in the line chart is even more obvious. While the overall ESG score trend has been flat, companies such as MasterCard, which has a high stock price of $382.54, and Postal Savings Bank of China, which has a low stock price of $0.8, This may be due to the fact that the Stock exchanges of listed companies may be located in different countries, resulting in the need for translation through exchange rates, which also affects the correlation research to a certain extent. Some large separation between stock price and ESG score also appears in the semiconductor industry, and is also reflected in the data of China, the United States and Japan. This is more likely due to the large difference between ESG score and stock price in a country containing too many different industries, but on the whole, the distribution of ESG score is relatively smooth. There is no large fluctuation in the line chart, which is more conducive to analysis.
3. Results
First part will analyze and compare the correlation between companies in different industries and different companies in the same industry. First, it analyzes the relationship between the stock prices of the world's top 30 companies by market capitalization and ESG scores in the car manufacturing industry, as Figure 1 below shows.
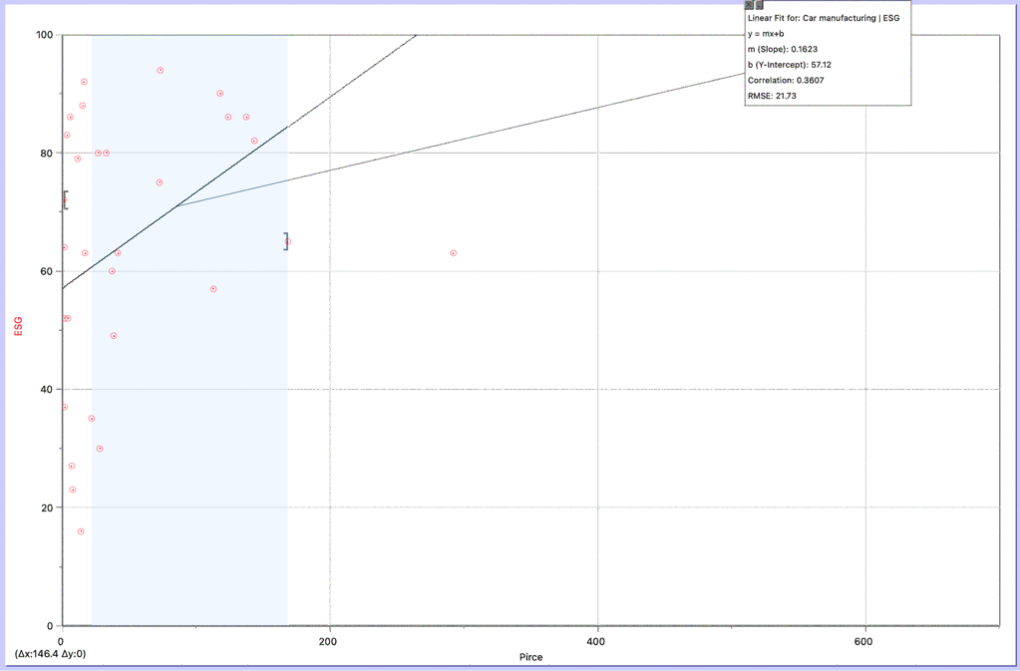
Figure 1: Model of car manufacturing.
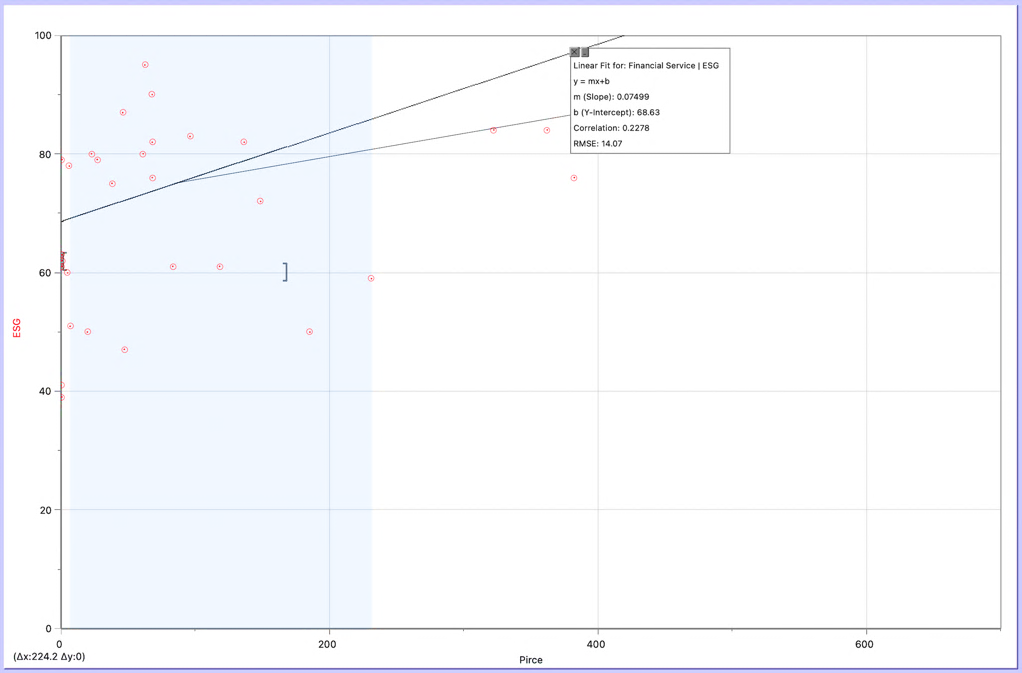
Figure 2: Model of financial service.
As mentioned above, data of Ferrari was removed to better estimate the equation. The correlation of the equation is 0.1623. It shows that in the car manufacturing industry, the company's stock price and ESG score are positively correlated, and the higher the stock price usually means the higher the ESG score. The intercept of the model is 57.12, indicating that the top 30 companies in the car manufacturing industry have an ESG score of at least 57, even if the company's stock price is low (eg. $5 per share). This means that overall, among the top 30 car manufacturers by market capitalization, the ESG level of the better companies in the overall industry is at a relatively good level. Secondly, Figure 2 below shows the linear fir equation for financial service industry. It has been found that there is a large score difference between the stock price of some companies and their ESG scores, which can also be proved by the correlation of the model, because there is a large deviation, resulting in the correlation between the stock price and ESG scores of the top 30 financial services companies is only 0.0749, but it is also positive. Still, higher stock prices also mean higher ESG scores, and vice versa. Not only that, the intercept of 68.63 is a very high level, meaning that the top financial services companies are excellent in ESG and have a high level of transparency.
The models for the semiconductor industry and the financial services industry in the are similar, and Figure 3 also shows that there are some companies with a large gap between their stock prices and ESG scores (stock prices are too high). As a result, the model correlation for the semiconductor industry is only 0.06408, indicating that an increase in stock price has little effect on ESG scores. Of course, this is due in large part to the fact that some companies have a stock price of several hundred dollars per share, so a dollar increase has little effect on ESG scores. However, through the intercept, it can be seen that even if the stock price is very low, the ESG score of the leading companies in the semiconductor industry has reached about 69 points, which is very similar to the intercept of the financial service industry model. It also shows that the top companies in the high-end manufacturing semiconductor industry have excellent performance in ESG and related transparency.
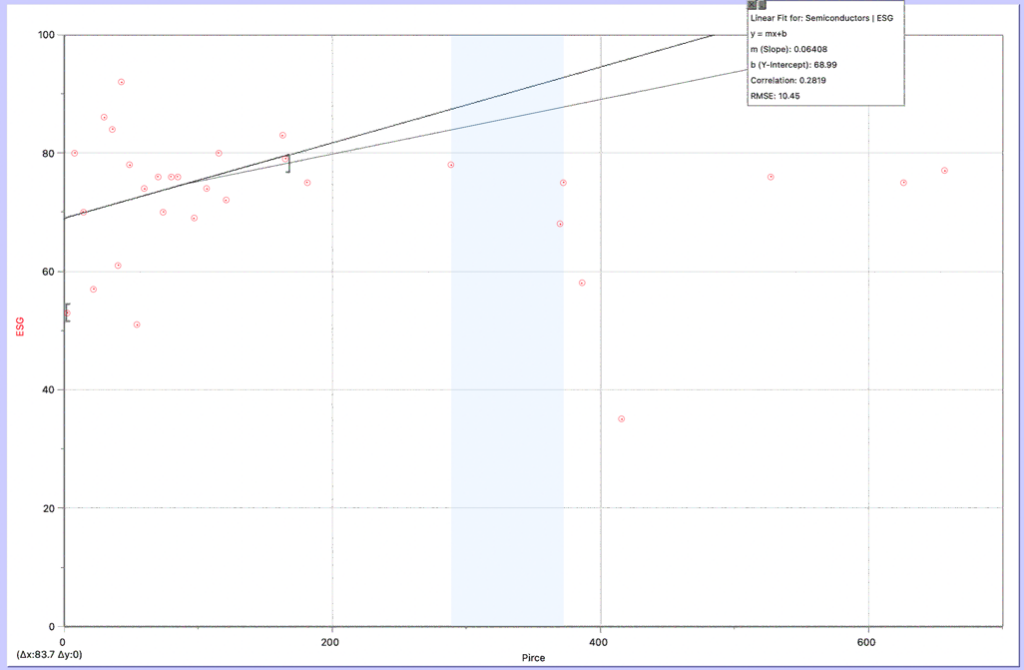
Figure 3: Model of semiconductors.
In the second part, this paper will analyze and compare the correlation between companies in different countries and different companies in the same country. We chose the United States, China and Japan not only because the GDP of these three countries is the top three in the world, but also because they are among the countries with the best ESG penetration.
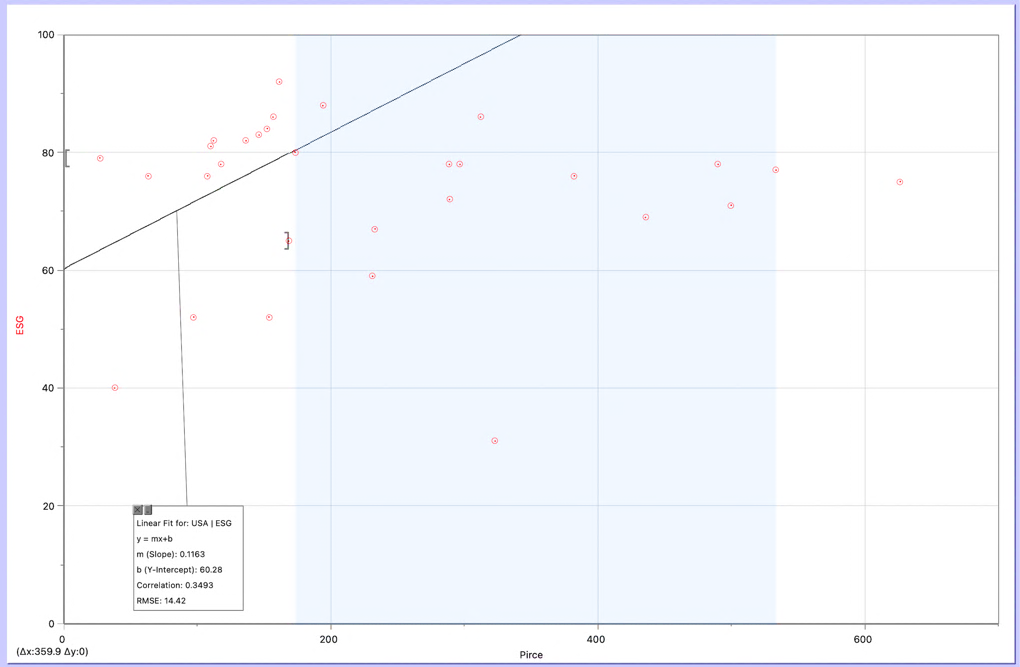
Figure 4: Model of the United States.
As Figure 4 shows, 0.1163 is a high correlation, which proves that among the top 30 companies in United States, stock price is positively correlated with ESG score. An increase in the stock price of $10 per share also represents an increase in ESG score of 1 point. Meanwhile, 60.28 is also an excellent data as the intercept. Proves that the ESG performance of the best and largest companies in the United States is generally superior. At the same time, we can also find from the figure that even though the stock price range is large, the ESG score is mostly concentrated in the range of 60-90 points, which also proves that American companies with larger market values pay more attention to and have better ESG development.
As Figure 5 shows, 2.018 represents a high positive correlation, which also indicates that the growing of stock price of the top 30 companies in China also represents the growth of ESG score. Since many companies are listed on the stock exchanges in China, the stock price is generally lower than that in the United States (each share requires exchange rate conversion). This is also reflected in the fact that the stock prices of Chinese companies are relatively concentrated in Figure 5, but it can be found that the overall ESG score ranges from 40 to 80 points. The intercept of 54.57 also proves that China's leading enterprises have a good performance in ESG, even if some enterprises have a low stock price.
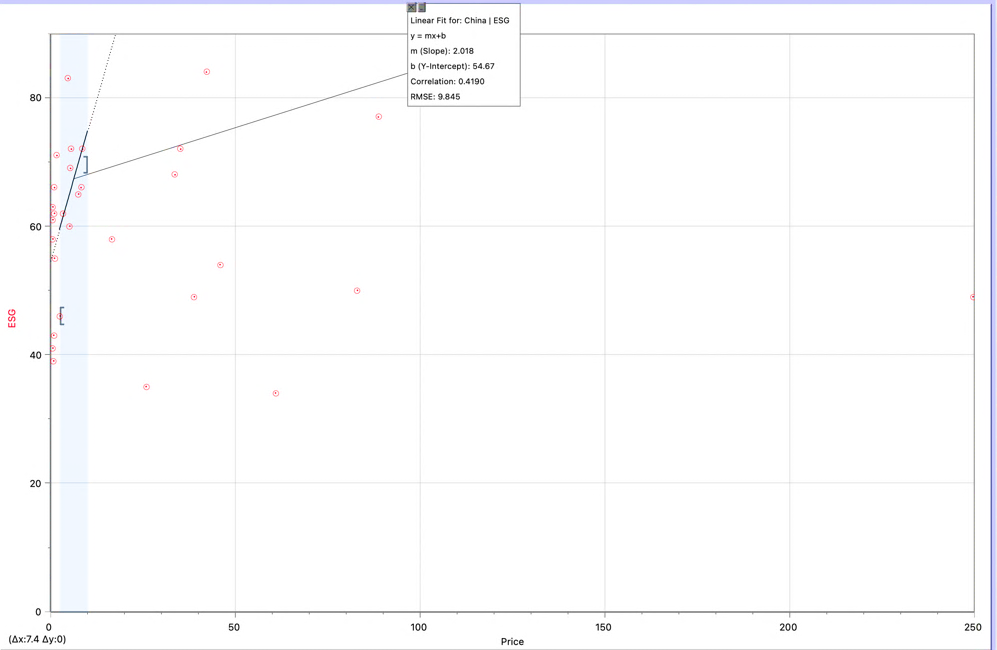
Figure5: Model of China.
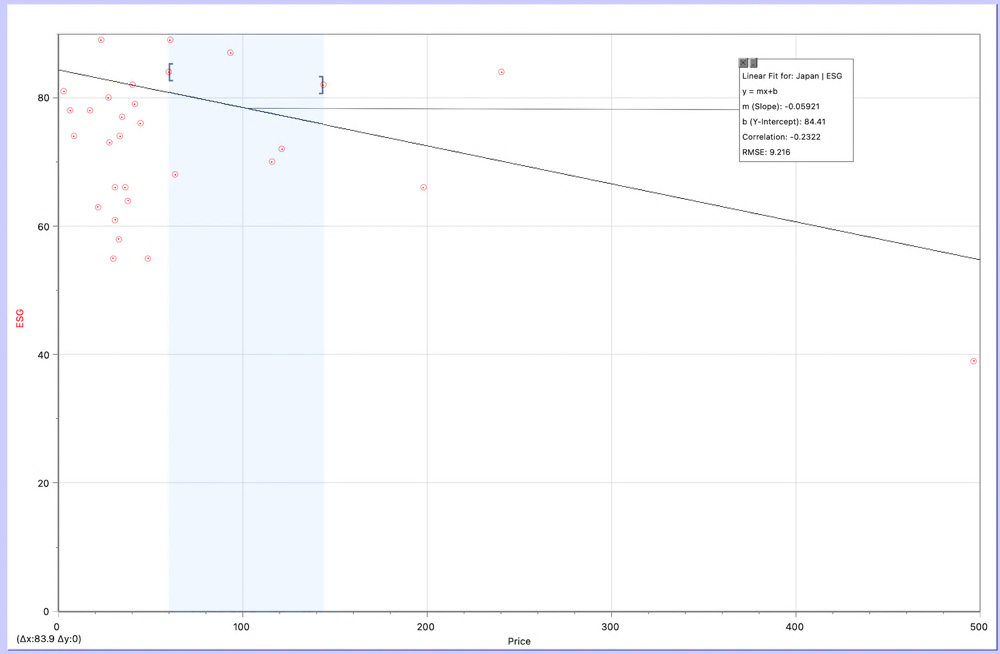
Figure 6: Model of Japan.
As Figure 6 shows, the Japanese model is more interesting, because the correlation is -0.05921, which means that the increase of stock price will lead to a slight decrease in ESG score. However, we can find in the figure that the ESG score of Japanese companies is generally concentrated around 50-85 points, which is also a relatively good level. The correlation is negative because Keyence , the second largest company by market capitalization, has a stock price of 496.32 but only an ESG score of 38, which pulls down the correlation. The high intercept of 84.41 proves that companies with higher market capitalization in Japan generally have better ESG levels.
4. Discussion
In recent years, China has more and more regulations and requirements on environmental emissions and other aspects of enterprises, and the capital market has a higher demand for environmental indicators such as the emission level of enterprises, which is also the reason why the ESG scores of many companies have gradually increased. Not only that, some studies have shown that the stock returns of Chinese companies listed on the A-shares market are notably influenced by their ESG performance. Multiple rigorous tests confirm that this finding remains essentially unchanged [9]. This indicates that Chinese investors may also use ESG scores to evaluate whether it is worthwhile to invest in an enterprise, or investors' investment preferences for an enterprise are similar to ESG data processing in some aspects. In different industries, such as the IT industry, many studies have proved that ESG has different impacts on companies. A high ESG score as a significant influencing factor on how investors respond to new positive information and impact equity prices [10]. From this, it can be found that more investors are inclined to use ESG score tools to help them analyze related stocks, trade or invest.
In the above study, it can be found that the positive correlation of the cars manufacturing industry is larger than that of the semiconductor industry and the financial service industry, which may be because the car manufacturing industry has a lot of emissions and related environmental indicators to require enterprises, which also explains why the correlation is stronger. By analyzing the intercept, the semiconductor industry and financial services industry have a larger intercept, which may also confirm the view that the financial industry or high-end manufacturing industry pays more attention to or has a higher ESG score. In different countries, through the existing data analysis, the leading enterprises in countries with higher GDP may indeed have better ESG performance.
5. Conclusion
In conclusion, in semiconductor, financial services and cars manufacturing industries, ESG scores and stock prices are positively correlated, indicating that higher ESG scores tend to mean higher stock prices, and high-end industries such as semiconductor and financial services have higher intercepts for ESG scores. This means that the leading companies in these industries are often more focused on ESG transparency and implementation. In the developed economies of the world, such as the United States, China and Japan, the equation of ESG score and stock price can be analyzed with a higher intercept, which means that economically more developed regions tend to pay more attention to ESG requirements, or enterprises pay more attention to environmental, social and other protection measures, resulting in a higher ESG score.
In this paper, research only uses limited data, and the factors taken into account in constructing the equation are only share price and ESG score, which is too simple. In addition, since the data used are the stock price and market value of the company in one day, these data may fluctuate and change in the long run, and it is easy to have extreme situations. At the same time, different countries in the same industry are affected by different exchange rates, and the stock prices of different companies may have greater deviations, which may also affect the performance of the company or the construction of the equation. In the future, as the economies of different regions develop, ESG scores may have a closer relationship with stock prices, same as the differences in model intercepts between China and the United States, better economic development may lead companies to pay more attention to ESG implementation and strategy construction, or governments to pay more attention to environmental impacts. With the upgrading of more industries, such as the transformation of the cars manufacturing industry into more robots for assembly line car production, the intercept of the ESG score and the stock price equation of the car manufacturing industry may also continue to increase, and continue to approach as the intercept of the high-end industrial. All in all, with the increase of social level, ESG will be more closely related to the capital market.
References
[1]. Capelle-Blancard, G., & Petit, A.: Every Little Helps? ESG News and Stock Market Reaction. Journal of Business Ethics, 157(2), 543-565 (2019).
[2]. Berg, F., Koelbel, J. F., & Rigobon, R.: Aggregate confusion: The divergence of ESG ratings (Working paper). MIT (2019).
[3]. Wang, H., Shen, H., & Li, S.: ESG performance and stock price fragility. Finance Research Letters, 104101 (2023).
[4]. Wang, J., Hu, X., & Zhong, A.: Stock market reaction to mandatory ESG disclosure. Finance Research Letters, 53, 103402 (2023).
[5]. Li, H., Zhang, X., & Zhao, Y.: ESG and Firm's Default Risk. Finance Research Letters, 47(Part B), 102713 (2022).
[6]. Egorova, A. A., Grishunin, S. V., & Karminsky, A. M.: The Impact of ESG factors on the performance of Information Technology Companies. Procedia Computer Science, 199, 339-345 (2022).
[7]. Sustainable Finance - ESG scores. Refinitiv. https://www.refinitiv.com/en/sustainable-finance/esg-scores, last accessed 2023/6/11.
[8]. Companiesmarketcap. https://companiesmarketcap.com/, last accessed 2023/6/11.
[9]. Yin, X., Li, J., & Su, C.: How does ESG performance affect stock returns? Empirical evidence from listed companies in China. Heliyon, 9(5), e16320 (2023).
[10]. Leite, B.J., Uysal, V.B.: Does ESG matter to investors? ESG scores and the stock price response to new information. Global Finance Journal, 57 (2023).
Cite this article
Sun,Y. (2023). An Empirical Research of the Relationship Between ESG Performance and Firm Value. Advances in Economics, Management and Political Sciences,41,1-8.
Data availability
The datasets used and/or analyzed during the current study will be available from the authors upon reasonable request.
Disclaimer/Publisher's Note
The statements, opinions and data contained in all publications are solely those of the individual author(s) and contributor(s) and not of EWA Publishing and/or the editor(s). EWA Publishing and/or the editor(s) disclaim responsibility for any injury to people or property resulting from any ideas, methods, instructions or products referred to in the content.
About volume
Volume title: Proceedings of the 7th International Conference on Economic Management and Green Development
© 2024 by the author(s). Licensee EWA Publishing, Oxford, UK. This article is an open access article distributed under the terms and
conditions of the Creative Commons Attribution (CC BY) license. Authors who
publish this series agree to the following terms:
1. Authors retain copyright and grant the series right of first publication with the work simultaneously licensed under a Creative Commons
Attribution License that allows others to share the work with an acknowledgment of the work's authorship and initial publication in this
series.
2. Authors are able to enter into separate, additional contractual arrangements for the non-exclusive distribution of the series's published
version of the work (e.g., post it to an institutional repository or publish it in a book), with an acknowledgment of its initial
publication in this series.
3. Authors are permitted and encouraged to post their work online (e.g., in institutional repositories or on their website) prior to and
during the submission process, as it can lead to productive exchanges, as well as earlier and greater citation of published work (See
Open access policy for details).
References
[1]. Capelle-Blancard, G., & Petit, A.: Every Little Helps? ESG News and Stock Market Reaction. Journal of Business Ethics, 157(2), 543-565 (2019).
[2]. Berg, F., Koelbel, J. F., & Rigobon, R.: Aggregate confusion: The divergence of ESG ratings (Working paper). MIT (2019).
[3]. Wang, H., Shen, H., & Li, S.: ESG performance and stock price fragility. Finance Research Letters, 104101 (2023).
[4]. Wang, J., Hu, X., & Zhong, A.: Stock market reaction to mandatory ESG disclosure. Finance Research Letters, 53, 103402 (2023).
[5]. Li, H., Zhang, X., & Zhao, Y.: ESG and Firm's Default Risk. Finance Research Letters, 47(Part B), 102713 (2022).
[6]. Egorova, A. A., Grishunin, S. V., & Karminsky, A. M.: The Impact of ESG factors on the performance of Information Technology Companies. Procedia Computer Science, 199, 339-345 (2022).
[7]. Sustainable Finance - ESG scores. Refinitiv. https://www.refinitiv.com/en/sustainable-finance/esg-scores, last accessed 2023/6/11.
[8]. Companiesmarketcap. https://companiesmarketcap.com/, last accessed 2023/6/11.
[9]. Yin, X., Li, J., & Su, C.: How does ESG performance affect stock returns? Empirical evidence from listed companies in China. Heliyon, 9(5), e16320 (2023).
[10]. Leite, B.J., Uysal, V.B.: Does ESG matter to investors? ESG scores and the stock price response to new information. Global Finance Journal, 57 (2023).