


1. Introduction
Money holds great value, often driving individuals to take extreme risks in pursuit of wealth. In such moments of desperation, people may willingly jeopardize their life savings or pensions, all in the name of a glimmering chance at riches. However, the sophisticated framework of portfolio optimization and the application of the Markowitz Model not only captivates the attention of seasoned investors, but also beckons a broader audience, including the general public. By concentrating on prominent companies and mitigating substantial risks, the study strikes a chord with both regular investors and the wider populace.
This research paper intricately examines a carefully curated selection of prominent stocks, spanning an extensive 20-year period from 2001 to 2021. Within this diverse array of stocks, a multitude of major companies representing various sectors is meticulously explored, presenting an expansive range of choices to the public. These options encompass colossal tech giants such as NVIDIA, Cisco Systems, and Intel Corporation, esteemed financial institutions including Goldman Sachs, TD Bank, Allstate Corporation, and US Bancorp, as well as renowned consumer goods enterprises like McDonald’s, Colgate-Palmolive, and Procter & Gamble. Furthermore, the data delves into the business of pharmaceuticals, highlighting entities such as Johnson & Johnson.
Markowitz’s work emphasized the importance of considering both expected returns and asset covariance [1]. Extensive research has since focused on refining the Markowitz Model, exploring diversification and portfolio optimization to minimize risk and maximize returns [2]. Scholars have incorporated real-world complexities such as transaction costs, liquidity constraints, and portfolio weight restrictions [3]. Advanced algorithms and alternative risk measures have been explored, surpassing the limitations of traditional methods [1]. These advancements aim to achieve superior portfolio allocations and capture nuanced aspects of investment risk [4]. The exploration of alternative approaches has expanded portfolio theory beyond Markowitz’s framework, enhancing our understanding of optimal risk-return trade-offs.
The Markowitz Model, while widely applied, is not without its limitations. One significant drawback lies in its assumption of a static correlation structure, which fails to adequately capture the dynamic nature of markets, especially during periods of financial turmoil or rapid market shifts [5]. This limitation can potentially lead to suboptimal portfolio allocations, as the model’s static correlations may not align with real-time market dynamics. Additionally, the absence of comparative analyses with other investment models hinders the assessment of the Markowitz Model’s relative strengths and weaknesses in relation to alternative approaches.
The primary aim of this study is to elucidate two exemplary portfolios of efficient and variance frontiers while contrasting the Markowitz with the naïve portfolio. These portfolios encompass the Minimum Risk Portfolio, which prioritizes risk mitigation and the Maximum Portfolio Return, which endeavors to achieve the highest returns within predetermined risk parameters. Through a meticulous examination of 20 years’ worth of raw data juxtaposed against predictions generated by the Markowitz model, index model, and naïve model, this research endeavors to provide international investors with the means to select an ideal portfolio tailored to their risk tolerance while simultaneously maximizing potential returns.
2. The Markowitz Model
The Markowitz model, also known as Modern Portfolio Theory, represents a sophisticated mathematical framework devised by economist Harry Markowitz in 1952 to construct optimal investment portfolios that effectively balance risk and return [6]. This influential model found wide applications in the field of finance.
At its core, the Markowitz model operates on the premise that investors can mitigate risk and enhance returns by diversifying their investments across assets that exhibit imperfect correlation [7]. By spreading investments across various asset classes and industries, the model enables investors to diminish portfolio risk while preserving the potential for higher returns [8]. This approach significantly diverges from the conventional strategy of relying solely on index portfolios or the practice of consolidating all investments into a single asset class [9]. It transcends the notion of identifying the most promising individual securities or bonds, as well as the notion of allocating a fixed percentage across a wide array of investments.
The Markowitz model harnesses a diverse array of mathematical and investment concepts, necessitating the resolution and definition of key parameters to achieve the desired outcomes [10]. These calculations encompass the rate of return, expected return, variance (a measure of risk), correlation (indicating the relationship between assets), and the Sharpe ratio (which assesses risk-adjusted returns).
2.1. Rate of Return
The rate of return is expressed in the equation below where C is the current value and I is the initial value.
\( RoR=R=(\frac{C-I}{I})×100 \) (1)
2.2. Expected Rate of Return
The expected rate of return is expressed in the summation equation below where R is the return for scenario i, n is the number of scenarios, and P is the probability for the return of R in scenario i.
\( E(R)=\sum _{i=1}^{n}R(i)P(i) \) (2)
2.3. Variance
The variance is expressed in the equation below where sigma represents the standard deviation, E(R) is the expected return, R is the return for scenario i, n is the number of scenarios, and P is the probability for the return of R in scenario i.
\( {σ^{2}}= \sum _{i=1}^{n}P(i){[R(i)-E(R)]^{2}} \) (3)
2.4. Correlation and Covariance
The correlation between the stocks is expressed in the matrix equation below.
\( {Ω_{n×n}}=(\begin{matrix}σ_{1}^{2} & ⋯ & {σ_{1n}} \\ ⋮ & ⋱ & ⋮ \\ {σ_{n1}} & ⋯ & σ_{n}^{2} \\ \end{matrix}) \) (4)
The sigma in the matrix above is expressed in equation below where it is the covariance of the rate of return of two selected stocks, R.
\( {σ_{ij}}= \frac{\sum _{t=1}^{m}(R_{t}^{i}-{μ_{i}})(R_{t}^{j}-{μ_{j}})}{m}=Cov({R^{i}}, {R^{j}} \) )(5)
2.5. Sharpe Ratio
The Shape Ratio is expressed in the equation below where E(R) is the expected return and σ is the standard deviation.
\( SR= \frac{Expected Return}{Standard deviation}=\frac{E(R)}{σ} \) (6)
2.6. Predictions and Output Graphs
Through the application of various portfolio weight combinations, Markowitz’s model effectively derives an efficient frontier, constituting an assortment of portfolios that present the utmost anticipated return relative to a designated level of risk, or conversely, the least amount of risk for a predetermined expected return. Subsequently, the investor gains the freedom to select the portfolio that most harmoniously aligns with their individual risk tolerance and return objectives from the comprehensive array along the efficient frontier. It is also worth noting that the minimum variance frontier, within this framework, encompasses portfolios comprised of risky assets, where the primary aim is to attain the lowest possible variance or standard deviation among all conceivable portfolio options.
3. Data
For the purpose of utilizing the Markowitz Model, an extensive dataset spanning 20 years (2001-2021) was meticulously sourced from Yahoo Finance, encompassing a diverse array of companies. This rich dataset enabled the extraction of key parameters necessary for constructing efficient portfolios. Specifically, the annualized average return and annualized standard deviation were computed, serving as vital inputs for gauging the risk and return characteristics of each stock (see Table 1). Additionally, the beta coefficient, a measure of market volatility with an average value of 1, was calculated to assess the sensitivity of each stock to overall market movements (see Table 1). Furthermore, the correlation coefficients between the stocks were diligently determined to discern the relationships and interdependencies among the assets (see Table 2). With this comprehensive set of data, the Markowitz Model can be effectively employed to identify optimal portfolio allocations that balance risk and return, taking into account the historical performance, volatility, and correlation structure of the individual stocks.
Table 1: Statistics of the selected stocks.
Stocks | Annualized Average Return | Annualized Standard Deviation | Beta Coefficient |
NVDA | 32.802% | 55.774% | 1.979 |
CSCO | 9.714% | 30.809% | 1.321 |
INTC | 8.905% | 30.503% | 1.188 |
GS | 10.825% | 29.572% | 1.410 |
USB | 9.878% | 23.680% | 0.971 |
TDCN | 11.010% | 18.134% | 0.787 |
ALL | 10.080% | 24.884% | 1.056 |
PG | 9.437% | 14.587% | 0.405 |
JNJ | 8.464% | 14.785% | 0.540 |
CL | 7.108% | 15.350% | 0.454 |
MCD | 13.454% | 18.666% | 0.675 |
Table 2: Correlations matrix of the selected stocks.
Stocks | NVDA | CSGO | INTC | GS | USB | |
NVDA | 1 | 0.4872 | 0.5238 | 0.3431 | 0.1598 | |
CSGO | 0.4872 | 1 | 0.6142 | 0.4875 | 0.3281 | |
INTC | 0.5238 | 0.6142 | 1 | 0.4107 | 0.2796 | |
GS | 0.3431 | 0.4875 | 0.4107 | 1 | 0.4717 | |
USB | 0.1598 | 0.3281 | 0.2796 | 0.4717 | 1 | |
TDCN | 0.3380 | 0.4100 | 0.4115 | 0.4938 | 0.5392 | |
ALL | 0.1569 | 0.2973 | 0.2857 | 0.4174 | 0.5401 | |
PG | 0.0596 | 0.2202 | 0.1364 | 0.1731 | 0.3358 | |
JNJ | 0.1653 | 0.2388 | 0.3249 | 0.2955 | 0.2341 | |
CL | 0.0694 | 0.1650 | 0.1101 | 0.2031 | 0.2178 | |
MCD | 0.5373 | 0.2725 | 0.2459 | 0.3132 | 0.2342 | |
Stocks | TDCN | ALL | PG | JNJ | CL | MCD |
NVDA | 0.3380 | 0.1569 | 0.0596 | 0.1653 | 0.0694 | 0.5373 |
CSGO | 0.4100 | 0.2973 | 0.2202 | 0.2388 | 0.1650 | 0.2725 |
INTC | 0.4115 | 0.2857 | 0.1364 | 0.3249 | 0.1101 | 0.2459 |
GS | 0.4938 | 0.4174 | 0.1731 | 0.2955 | 0.2031 | 0.3132 |
USB | 0.5392 | 0.5401 | 0.3358 | 0.2341 | 0.2178 | 0.2342 |
TDCN | 1 | 0.4167 | 0.2310 | 0.2727 | 0.2117 | 0.2923 |
ALL | 0.4167 | 1 | 0.3463 | 0.4518 | 0.4066 | 0.3770 |
PG | 0.2310 | 0.3463 | 1 | 0.4937 | 0.4833 | 0.3502 |
JNJ | 0.2727 | 0.4518 | 0.4937 | 1 | 0.5268 | 0.3567 |
CL | 0.2117 | 0.4066 | 0.4833 | 0.5268 | 1 | 0.4992 |
MCD | 0.2923 | 0.3770 | 0.3502 | 0.3567 | 0.4992 | 1 |
The Markowitz Model, when applied to investment portfolio research using a 20-year span of stock data, yields a multitude of sophisticated advantages. By leveraging a long-term perspective, this approach provides a comprehensive view of market performance over various cycles and economic conditions. This extended timeframe enhances the statistical significance of findings, enabling researchers to discern reliable trends and patterns while mitigating the influence of short-term fluctuations. Moreover, the analysis of diversified portfolios constructed using the Markowitz Model over this extended duration facilitates the evaluation of long-term investment strategies and their efficacy in different market environments. It also allows for the examination of historical events and their impact on portfolio performance, fostering a deeper understanding of risk management, diversification, and the relationship between macroeconomic factors and asset returns. Through the validation and refinement of investment theories and models, including the Markowitz Model itself, this research framework empowers investors with insights for constructing optimized portfolios that balance risk and return effectively.
4. Analysis and Discussion of Results
4.1. Markowitz Model vs. Index Model
The Markowitz Model is a sophisticated framework based on diversification, aiming to maximize expected returns while managing risk. In contrast, the Index model seeks to replicate the performance of a benchmark index, assuming market efficiency and minimizing tracking error. Regarding investment returns, the Markowitz Model holds the potential to yield superior outcomes when compared to the Index model. Through the careful selection of a diversified portfolio comprising assets with elevated expected returns and low correlation, the Markowitz Model can generate returns surpassing those of the benchmark index. However, it is important to note that the pursuit of higher returns within the Markowitz Model necessitates assuming increased risk. Nevertheless, the model adeptly facilitates the creation of low-variance portfolios by presenting a diverse range of investment options that can effectively balance risk and return considerations.
4.1.1. Potential Investment Portfolios
In broad terms, when comparing the Markowitz model to the index model, the former presents a more refined and resilient investment portfolio. Undoubtedly, the index model does provide more assertive alternatives, yet these selections entail variance levels exceeding 2.5, indicating a substantial risk of investment failure (see Fig.1 and Fig.2). These observations distinctly highlight the discernible disparities between the two models.
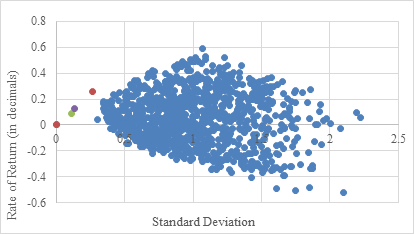
Figure 1: Scatter plot of the potential investment portfolios using Markowitz Model.
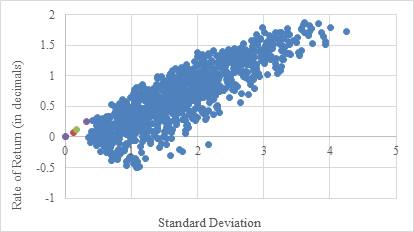
Figure 2: Scatter Plot of the potential investment portfolios using Index Model.
4.1.2. Minimum Variance Frontier
The Markowitz Model surpasses the index model in the construction of the minimum variance frontier, a pivotal concept that delineates portfolios exhibiting the most minimal variance or risk for a designated level of expected return. The Markowitz Model, with its inherent capacity to account for inter-asset correlations, provides a more precise and reliable approach in discerning portfolios comprising multiple data points characterized by lower variance compared to the Index Model (see Fig.3 and Fig.4). This further amplifies the potential stability that the Markowitz Model can bestow upon the average investor when navigating major company stocks.
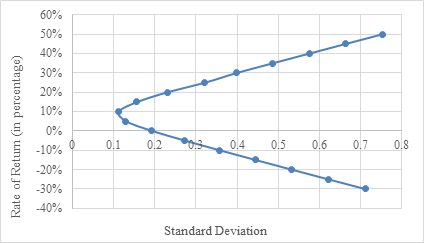
Figure 3: Minimum variance frontier using Markowitz Model.
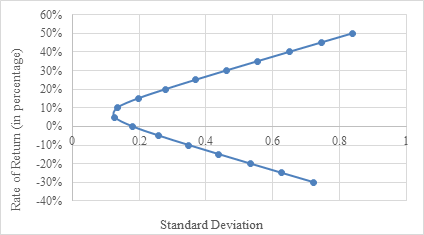
Figure 4: Minimum variance frontier using Index Model.
4.1.3. Efficient Frontier
The Markowitz Model exhibits a heightened level of flexibility and sophistication in the construction of the efficient frontier, which aims to achieve the highest possible return given a certain level of risk or variance. By leveraging its inherent capabilities, the Markowitz Model bests the index model by identifying a more expansive selection of optimal portfolios that offer superior risk-return trade-offs [11]. Remarkably, at nearly every standard deviation interval, the Markowitz model yields a rate of return that surpasses the index model by a noteworthy margin of 3% to 5% points (see Fig.5 and Fig.6). In contrast to the index model’s narrow focus on replicating the performance of a specific market index, the Markowitz Model embraces a comprehensive approach to available assets. This encompassing methodology takes into account the diverse risk-return profiles and correlations of these assets. Consequently, it becomes evident that the Markowitz model not only enables the construction of investment portfolios with lower levels of risk but also outperforms the index model in terms of achieving superior investment outcomes within the lower-risk domain.
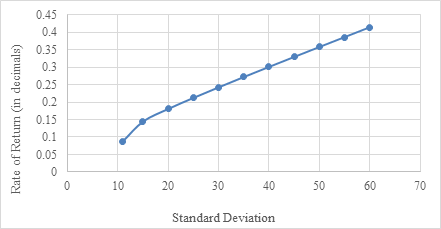
Figure 5: Efficient frontier using Markowitz Model.
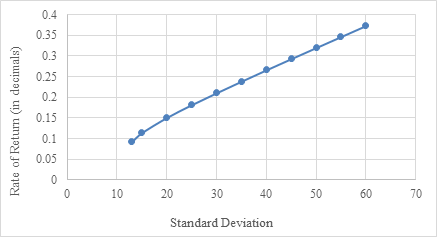
Figure 6: Efficient frontier using Index Model.
4.2. Markowitz Model vs. Naïve Portfolio
The Markowitz Model offers distinct advantages over the naive portfolio approach, establishing its superiority in portfolio optimization. Firstly, the Markowitz Model explicitly considers the delicate balance between risk and return, enabling investors to construct portfolios that optimize this trade-off. By incorporating statistical analysis and mathematical techniques such as mean-variance optimization, the model leverages historical data and risk-return parameters to determine optimal portfolio allocations. In contrast, the naive portfolio approach lacks such rigor, relying on simplistic allocation strategies that overlook risk diversification and fail to maximize returns for a given level of risk. The Markowitz Model’s emphasis on diversification is another key advantage, as it takes into account the covariance structure of assets. By considering the interrelationships between assets, the model identifies combinations that offer improved risk-reward profiles.
In addition, the naive portfolio approach does not account for these interdependencies and, as a result, fails to provide the same level of diversification benefits. Moreover, the Markowitz Model enables customization, allowing investors to tailor their portfolios to their specific risk preferences, return objectives, and constraints. It provides a systematic framework that incorporates individual investment goals and risk tolerances into the portfolio optimization process. Conversely, the naive portfolio approach offers limited customization options and lacks the sophistication required to address the diverse needs of individual investors effectively. Overall, the Markowitz Model’s statistical precision, diversification benefits, and customization options make it a superior choice for portfolio optimization compared to the simplistic and less sophisticated naive portfolio approach. Its robustness in handling various investment scenarios and market conditions further solidifies its position as a reliable and effective method for constructing portfolios aligned with investors’ objectives.
5. Conclusion
The study successfully demonstrated the practical application of the Markowitz Model in establishing optimal portfolios comprising high-end companies. Through careful analysis and consideration of covariance and correlation between assets, the Markowitz Model outperformed both the index model and the naive portfolio approach. The efficient portfolios formed using the Markowitz Model consistently outclassed the index model in the study’s timeframe, enabling investors to achieve maximum returns for a given level of risk, optimize the return rate, or minimize risk. This highlights the power of Markowitz’s diversification principle, emphasizing the importance of considering asset interdependencies. Consequently, average investors in high-end companies can significantly enhance their investment performance by appropriately applying the Markowitz Model.
The study’s reliance on historical data introduces limitations as past performance may not accurately predict future outcomes due to changing market conditions and company-specific factors. Additionally, the evaluation of the Markowitz Model may not capture the full complexity of real-world investment scenarios, as practical factors like transaction costs and liquidity constraints are not fully considered. Moreover, the study’s focus on certain companies restricts the generalizability of findings to other regions and markets with differing economic, regulatory, and industry dynamics, requiring further research for a broader evaluation of the model’s effectiveness.
References
[1]. Hali, N. A., Yuliati, A.: Markowitz Model Investment Portfolio Optimization: A Review Theory. International Journal of Research in Community Services, 1(3), pp.14–18. (2020).
[2]. Mangram, M. E.: A Simplified Perspective of the Markowitz Portfolio Theory. Global Journal of Business Research, 7(1), pp.59-70. (2013).
[3]. Pogue, G. A.: An Extension of the Markowitz Portfolio Selection Model to Include Variable Transactions’ Costs, Short Sales, Leverage Policies and Taxes. The Journal of Finance, 25(5), pp.1005–1027. (1970).
[4]. Engels, M.: Portfolio Optimization: Beyond Markowitz. Universiteit Leiden. (2004).
[5]. Shadabfar, M., Cheng, L.: Probabilistic approach for optimal portfolio selection using a hybrid Monte Carlo simulation and Markowitz model. Alexandria Engineering Journal, 59(5), pp.3381-3393. (2020).
[6]. Markowitz, H.: Portfolio Selection. The Journal of Finance, 7(1), pp.77–91. (1952).
[7]. Beste, A., Leventhal, D., Williams, J., Lu, Q.: The Markowitz Model Selecting an Efficient Investment Portfolio. Lafayette College, Mathematics REU Program. (2002).
[8]. Ivanova, M., Dospatliev, L.: Application of Markowitz Portfolio Optimization on Bulgarian Stock Market from 2013 to 2016. International Journal of Pure and Applied Mathematics, 117(2). (2018).
[9]. Marling, H., Emanuelsson, S.: The Markowitz Portfolio Theory. (2012).
[10]. Witt, S.F., Dobbins, R.: The Markowitz Contribution to Portfolio Theory, Managerial Finance, Vol. 5 No. 1, pp. 3-17. (1979).
[11]. Širůček, M., Křen, L.: Application of Markowitz Portfolio Theory by Building Optimal Portfolio on the US Stock Market. In Tools and Techniques for Economic Decision Analysis. pp.24-42. (2017).
Cite this article
Chai,T. (2023). The Application of the Markowitz Model for Portfolio Optimization in High-End Companies. Advances in Economics, Management and Political Sciences,44,107-115.
Data availability
The datasets used and/or analyzed during the current study will be available from the authors upon reasonable request.
Disclaimer/Publisher's Note
The statements, opinions and data contained in all publications are solely those of the individual author(s) and contributor(s) and not of EWA Publishing and/or the editor(s). EWA Publishing and/or the editor(s) disclaim responsibility for any injury to people or property resulting from any ideas, methods, instructions or products referred to in the content.
About volume
Volume title: Proceedings of the 7th International Conference on Economic Management and Green Development
© 2024 by the author(s). Licensee EWA Publishing, Oxford, UK. This article is an open access article distributed under the terms and
conditions of the Creative Commons Attribution (CC BY) license. Authors who
publish this series agree to the following terms:
1. Authors retain copyright and grant the series right of first publication with the work simultaneously licensed under a Creative Commons
Attribution License that allows others to share the work with an acknowledgment of the work's authorship and initial publication in this
series.
2. Authors are able to enter into separate, additional contractual arrangements for the non-exclusive distribution of the series's published
version of the work (e.g., post it to an institutional repository or publish it in a book), with an acknowledgment of its initial
publication in this series.
3. Authors are permitted and encouraged to post their work online (e.g., in institutional repositories or on their website) prior to and
during the submission process, as it can lead to productive exchanges, as well as earlier and greater citation of published work (See
Open access policy for details).
References
[1]. Hali, N. A., Yuliati, A.: Markowitz Model Investment Portfolio Optimization: A Review Theory. International Journal of Research in Community Services, 1(3), pp.14–18. (2020).
[2]. Mangram, M. E.: A Simplified Perspective of the Markowitz Portfolio Theory. Global Journal of Business Research, 7(1), pp.59-70. (2013).
[3]. Pogue, G. A.: An Extension of the Markowitz Portfolio Selection Model to Include Variable Transactions’ Costs, Short Sales, Leverage Policies and Taxes. The Journal of Finance, 25(5), pp.1005–1027. (1970).
[4]. Engels, M.: Portfolio Optimization: Beyond Markowitz. Universiteit Leiden. (2004).
[5]. Shadabfar, M., Cheng, L.: Probabilistic approach for optimal portfolio selection using a hybrid Monte Carlo simulation and Markowitz model. Alexandria Engineering Journal, 59(5), pp.3381-3393. (2020).
[6]. Markowitz, H.: Portfolio Selection. The Journal of Finance, 7(1), pp.77–91. (1952).
[7]. Beste, A., Leventhal, D., Williams, J., Lu, Q.: The Markowitz Model Selecting an Efficient Investment Portfolio. Lafayette College, Mathematics REU Program. (2002).
[8]. Ivanova, M., Dospatliev, L.: Application of Markowitz Portfolio Optimization on Bulgarian Stock Market from 2013 to 2016. International Journal of Pure and Applied Mathematics, 117(2). (2018).
[9]. Marling, H., Emanuelsson, S.: The Markowitz Portfolio Theory. (2012).
[10]. Witt, S.F., Dobbins, R.: The Markowitz Contribution to Portfolio Theory, Managerial Finance, Vol. 5 No. 1, pp. 3-17. (1979).
[11]. Širůček, M., Křen, L.: Application of Markowitz Portfolio Theory by Building Optimal Portfolio on the US Stock Market. In Tools and Techniques for Economic Decision Analysis. pp.24-42. (2017).