


1. Introduction
Robo-advisor, also known as automated advisors, refers to providing financial management and investment services for consumers through securities companies to set models and computer algorithms on the network platform in the form of artificial intelligence according to customer risk tolerance and their own needs. Less manpower is used in operation. In operation, customers need to go through three stages: suitability assessment, asset allocation, and investment portfolio rebalancing. Open-end funds are the fund product managed by fund managers. Fund managers manage the daily operation and make the investment decisions of funds according to their own professional knowledge and investment philosophy.
Fund robo-advisor products occupy a certain market as an emerging area in China; open-end funds are one of the basic forms of fund operation around the world and the mainstream variety of fund markets. Among them, a robo-advisor is a machine system decision-making, and open-end funds are manual decision-making. Therefore, this article will explore the gap between the investment income of funds robo-advisor and open-end funds managed by fund managers, including the impact of manual decision-making on the rate of return in the investment process.
For this research problem, this paper selects four different types of products in the China Securities robo-advisor platform " Qingting Butler " and the open-end fund products of China Securities. After the preliminary processing of the collected data, calculate the average rate of return and the overall variance to initially judge the profitability of the product, and then compare the adjusted R-square of each product and the Shanghai Composite Index to judge the fitting and the fluctuation of the product and the market. After that, a unary linear analysis is carried out to intuitively show the yield during the term. It is expected to get the specific gap between robo-advisor products and open-end fund products, as well as the suitable period for investment, and finally look forward to China's robo-advisor market.
2. Backgrounds
2.1. Robo-Advisor
As a major achievement of the rise of the field of Fintech, robo-advisor became an important part of the field of intelligent financial management after its emergence in the United States in 2005. Since then, a large number of robo-advisor platforms have emerged, such as Wealthfront, Betterment, Personal Capital, etc. As of the end of 2016, the asset management scale of the robo-advisor industry in the United States has reached $300 billion①. In China, the first batch of intelligent investment products was born in third-party Internet institutions. In 2016, China Merchants Bank launched Capricorn Intelligent Investment as the first batch of bank robo-advisor products. As of 2022, the platform has served more than 200,000 customers, with a cumulative sales scale of more than 14 billion yuan②. In 2017, The State Council of the People's Republic of China issued the New Generation Artificial Intelligence Development Plan, affirming the role of artificial intelligence in economic development and accelerating the cultivation of artificial intelligence applications and industrial development.
In 2021, the Asset Management Association of China issued the Survey Report on the Situation of Investors in the National Mutual Fund Market (2020), which shows that individual investors are enthusiastic about mutual funds and that their investment decisions are more rational [1]. The report shows that in the national mutual fund market, the total number of over-the-counter investors is 671.029 million, the total number of exchange investors is 25.242 million, and the number of over-the-counter investors is much larger than exchange investors. For fund options, more than 40% of investors hold less than 5 and hold more than 50% for more than 1 year. Customers are willing to invest in financial management simply, therefore, the fund's intelligent investment automation and low-manual intervention have broad development prospects.
2.2. China Securities
China Securities was founded in 2005 and has accumulated a good industry reputation for providing high-quality financial services. Since 2010, it has been rated as the highest-level Class AA securities company in the industry for 12 consecutive years. The company has more than 10 million customers and the market value of managed securities exceeds 5.5 trillion yuan. It is highly representative of the securities market. In 2020, the online fund intelligent investment service brand "Qingting Butler" became the fourth company of fund investment products. Qingting Butler is consistent with the industry strategy, customizes the portfolio according to customer risk tolerance and target needs, and provides four types of products: pursuit of liquidity, value preservation, value-added, and income. The investment threshold is 1,000 yuan③.
2.3. Review of The Literature
The robo-advisor industry has shown blowout development in recent years [2]. Robo-advisor business is mainly divided into two parts: the early stage and the later stage. The early stage includes customer risk appetite measurement and investor suitability assessment. In the investor suitability assessment, the assessment ignores the relationship between customers and groups. The teams of Xue J and Zhu E have designed an intelligent investment recommendation model based on financial social networks, which makes up for the cold start and sparseness problems, making the model superior to most market algorithm models [3]. Later robo-advisor is based on Modern Portfolio Theory and uses computer programs to invest according to customer needs. From a market perspective, the smart investment business in the United States is also very different from that in China. The U.S. market gives high permission to intelligent investment, so in the face of fluctuations in the securities market, intelligent algorithms can track customer accounts in real-time and make timely adjustments. But this is prohibited in China [4].
Open-end funds have developed rapidly in China. By the end of 2021, the total scale of open-end funds in China ranked fourth in the world④. The rate of return for open-end funds is influenced by various factors, including macroeconomic policies, natural disasters, and the competence of fund managers. The team of Wang H and Li S also found that investor sentiment can be related to the fund collapse, and the level of fund managers and market liquidity will affect the impact of investor sentiment on the fund collapse [5].
Whether consumers have different preferences between manual and intelligent investment? A study by Pentina I and Zhang L, et al investigated the differences in customers' trust, return expectations, and willingness to invest in different levels of artificial investment consultants and intelligent investment [6]. After group experiments, it was concluded that customers were more inclined to artificial investment advisers. In other experiments, customers would be more inclined to communicate with Intelligent investment robots for customers to establish communication[7].
It can be found that most of the existing research focuses on in-depth research in a certain aspect, exploring the comparison of intelligent investment algorithms, customer selection, development, or different intelligent investment platforms. There is less research on the return on intelligent investment products and manual investment, which is of important reference significance for the investment of market participants.
3. Methodology
3.1. Data
In the research sample of this study, the products of artificial investment fun are selected from China Securities stock/index fund, hybrid fund, and bond fund, and robo-advisor Qingting Butler product selection pursues liquidity (Anxintianyi), pursuit of value preservation (Chenxinjunheng), value-added (Bubuweiying), and pursuit of income (Quanmingxinjunheng).
The fund data comes from Tiantian Fund Network(https://fund.eastmoney.com). It is a fund platform under Eastmoney Network. As the first licensed third-party fund sales agency, it provides customers with comprehensive, timely, and accurate fund information. Many kinds of fund products cover a wide range.
First, preprocess the collected data. In terms of operating hours, for fund products invested by China Securities Fund Manager, ensure that they have been in business for more than two years; for Qingting Butler investment products, the investment platform to go live in 2020, with three of the four products established in 2020, and the pursuit of value preservation products will be established in August 2021. In terms of business conditions, select products that can be purchased in the market, remove suspended and closed products, and ensure the universality of fund data [8]. In terms of data integrity, collecting all data in the past month, nearly one year, and three years (under three years from the founding year) ensure the completeness of the Fund's data. Selected data ends in August 2022.
For ease of viewing, various products in the Qingting Butler are replaced with symbols.
Table 1: Symbols for each product.
Symbols | Fund digital code | Types | Symbols | Product |
S1 | 006440 | stock/index fund | C1 | pursuit of liquidity-Anxintianyi |
S2 | 003978 | bond fund | C2 | pursuit of value preservation-Chenxinjunheng(year-year-year profit) |
S3 | 001809 | hybrid fund | C3 | pursuit of value added-Bubuweiying |
S4 | 010282 | hybrid fund | C4 | pursuit of income-Quanmingxinjunheng |
S5 | 006441 | stock/index fund |
3.2. Method
In order to explore the relationship between the cumulative rate of return during the period of products and the cumulative rate of return of the Shanghai Securities Composite Index, it uses the Adjusted R-square as the indicator, excluding the impact of different periods and the number of data on the results.
In order to further compare the four products of Qingting Butler and the fund products invested by fund managers, the average and total variance of daily yield are used as indicators for comparison, supplemented by charts.
| (1) |
| (2) |


In formula (1), SSR is the sum of squares of the regression, SST is the total sum of squares, and SSE is the sum of squares due to error.
In formula (2), n represents the number of samples and k represents the number of independent variables.
Table 2: Adjusted R-square of product corresponding to Shanghai Securities Composite Index.
Products | Periods | Adjusted R-square | Products | Periods | Adjusted R-square |
S1 | Nearly one month | 0.2735 | C1 | Nearly one month | 0.1040 |
Nearly one year | 0.9653 | Nearly one year | 0.5380 | ||
Nearly three years | 0.5010 | Nearly three years | 0.0353 | ||
S2 | Nearly one month | 0.2735 | C2 | Nearly one month | -0.0291 |
Nearly one year | 0.5636 | Nearly one year | 0.0193 | ||
Nearly three years | 0.2704 | Nearly three years | 0.0674 | ||
S3 | Nearly one month | -0.0037 | C3 | Nearly one month | 0.8735 |
Nearly one year | 0.4599 | Nearly one year | 0.9077 | ||
Nearly three years | 0.5393 | Nearly three years | 0.7616 | ||
S4 | Nearly one month | 0.0479 | C4 | Nearly one month | 0.6827 |
Nearly one year | 0.5616 | Nearly one year | 0.8788 | ||
Nearly three years | 0.0726 | Nearly three years | 0.7916 | ||
S5 | Nearly one month | 0.4912 | |||
Nearly one year | 0.9651 | ||||
Nearly three years | 0.5107 | ||||
Table 3: Average and population standard deviation of product daily rate of return.
Products | Periods | Average |
| Products | Periods | Average |
|
S1 | Nearly one month | 0.145 | 1.165 | C1 | Nearly one month | 0.008 | 0.007 |
Nearly one year | -0.028 | 1.189 | Nearly one year | 0.054 | 0.023 | ||
Nearly three years | 0.190 | 2.492 | Nearly three years | 0.187 | 0.051 | ||
S2 | Nearly one month | 0.038 | 0.031 | C2 | Nearly one month | 0.023 | 0.118 |
Nearly one year | 0.018 | 0.032 | Nearly one year | 0.047 | 0.233 | ||
Nearly three years | 0.056 | 0.109 | Nearly three years | 0.214 | 0.391 | ||
S3 | Nearly one month | 0.334 | 2.129 | C3 | Nearly one month | 0.0105 | 0.556 |
Nearly one year | 0.040 | 2.448 | Nearly one year | -0.164 | 1.323 | ||
Nearly three years | 0.900 | 9.321 | Nearly three years | -0.036 | 2.410 | ||
S4 | Nearly one month | 0.270 | 1.593 | C4 | Nearly one month | 0.0348 | 0.911 |
Nearly one year | 0.022 | 2.314 | Nearly one year | -0.331 | 2.655 | ||
Nearly three years | 0.150 | 3.658 | Nearly three years | 0.173 | 5.134 | ||
S5 | Nearly one month | 0.144 | 1.166 | ||||
Nearly one year | -0.029 | 1.187 | |||||
Nearly three years | 0.187 | 2.484 | |||||


In order to further explore the change in the return rate of each product with the date, a linear regression analysis method is used for analysis. Due to the low representativeness of the data in the past month, the results of linear regression analysis were not shown. The model of the unitary linear regression analysis method is:
| (3) |

Where xt represents the value of the independent variable in period t, and Yt represents the value of the dependent variable in period t; a,b represents the parameters of the linear regression equation with one variable.
Table 4: Unary linear regression equation of cumulative rate of return during the period of products(continued).
Products | Periods | Unary linear regression equation | Products | Periods | Unary linear regression equation |
S1 | Nearly one year | y = -0.0417x + 1855.2 | C1 | Nearly one year | y = 0.0065x - 288.13 |
Nearly three years | y = 0.0481x - 2090.4 | Nearly three years | y = 0.0067x - 294.27 | ||
S2 | Nearly one year | y = 0.0115x - 513.14 | C2 | Nearly one year | y = 0.0043x - 188.87 |
Nearly three years | y = 0.0114x - 497.83 | Nearly three years | y = 0.0057x - 253.14 | ||
S3 | Nearly one year | y = -0.0283x + 1261.2 | C3 | Nearly one year | y = -0.0258x + 1148.2 |
Nearly three years | y = 0.1709x - 7444.9 | Nearly three years | y = -0.0044x + 197.99 | ||
S4 | Nearly one year | y = -0.0367x + 1636.5 | C4 | Nearly one year | y = -0.0569x + 2529.1 |
Nearly three years | y = 0.0442x - 1950.2 | Nearly three years | y = -0.0114x + 516.9 | ||
S5 | Nearly one year | y = -0.0417x + 1854.8 | |||
Nearly three years | y = 0.0468x - 2035 | ||||
3.3. Graphs of Results
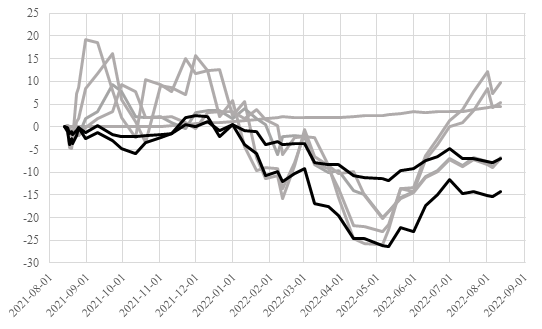
Figure 1: C3 and C4 cumulative income in the past year compared with other products.
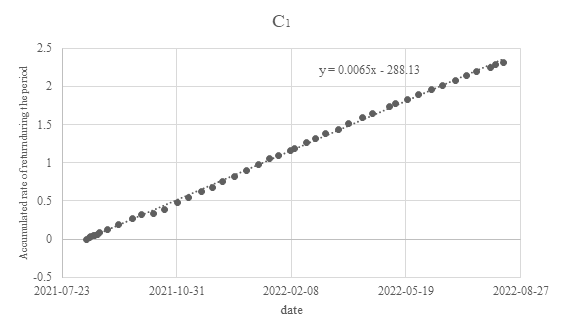
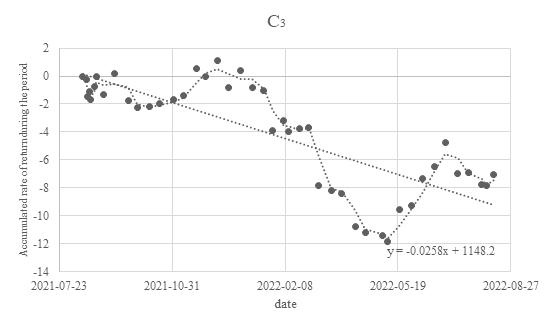
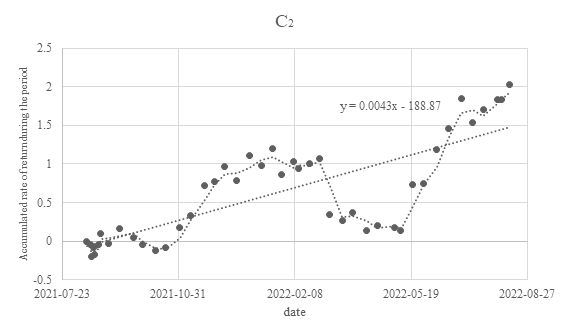
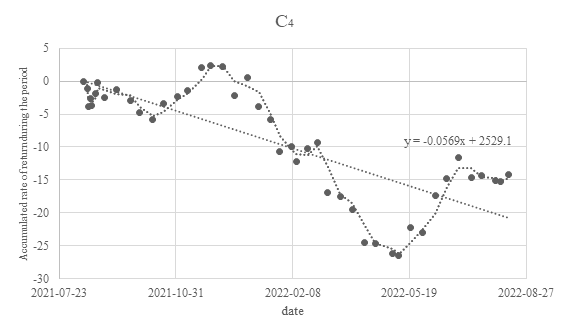
Figure 2: Scatterplot and unary linear regression equation of accumulated return rate during the nearly one year of robo-advisor products.
4. Practical Implications
Robo-advisor can reduce human decision-making errors and deviations in the investment process, including over-trading, overconfidence, etc. And some research results show that robo-advisor has a positive effect on reducing human decision-making errors and deviations in the investment process [9]. Similarly, low rates and low thresholds for intelligent investment products are also advantages to attract customers.
This paper focuses on the China Securities fund robo-advisor service brand 'Qingting Butler' as the research subject. When investors use Qingting Butler, the system only uses simple questionnaires and individual customer investment goals and risk levels, which is slightly insufficient in risk measurement. At the same time, due to the insufficient development of domestic robo-advisor businesses and non-compliance, there are only minorities in the robo-advisor field. Robo-advisor algorithms in foreign markets can identify different risk kinds [10]. But looking at China's robo-advisor market, it is also getting better. The current regulator adopts regulatory sandbox supervision, makes the intelligent investment model transparent [11][12]; introduces "Look-through Regulation" and restricts license issuance⑤[13]; to protect consumer rights, interests and reduce various risks. In November 2021, the China Securities Regulatory Commission issued the Notice on Regulating Fund Investment Suggestion Activities, requiring the enterprise to have the business qualification of fund investment consultants. ICBC, China Merchants Bank, and other banks suspended fund intelligent investment services such as "AI investment" and Capricorn Intelligent Investment [14][15].
5. Limitations and Directions for Future Research
There are many limitations in our work. First, the number of samples taken is not sufficient, only some types of typical fund products have been selected. Future research will expand the scope of research, and observation products can also be limited to the products of China Securities. Second, due to the late start of domestic intelligent investment, the running time of each product is insufficient. One of them has been established for more than a year, and the sample is more uncertain. Fortunately, the long running time of other products has fully supported the research and made the results more credible.
In future research, more appropriate measurement indicators should be used to judge the return level of a fund product, which can give investors different investment advice for different market environments. Algorithms can also be designed to improve the risk measurement and appropriateness analysis of China Securities' robo-advisor products, improve product integrity, and collect data on the rate of return selected by investors with different risk preferences under the corresponding products.
6. Conclusion
Under the data processing and analysis of 9 products, it is concluded from Tables 1, 2, 3, and Figure 1,2. C1, C2, and the Shanghai Composite Index are poorly fit and fluctuate less with the market, which meets the expectations of the product to pursue flow and value preservation. In unary linear regression analysis, the regression equation shows a growth trend, which in nearly one year and three years, similar to low-risk long-term bonds S2, but there is a problem that C1 and C2 ’s yield is lower than other products.
Similar to index funds, C3, C4, and the Shanghai Composite Index has a high degree of fit, and the overall variance is relatively high and has large fluctuations. Among the nine products, C3 and C4 have the lowest average rate of return, while their short-term yield (nearly one month) is higher than that of C1 and C2, their medium and long-term yield is insufficient. In linear regression analysis, the slope of the regression equation of manual decision-making fund products is negative in the nearly one-year period, showing a downward trend, and a growth trend in the nearly three years period. However, the slopes of the regression equations of C3 and C4 are negative for nearly one year and three years, indicating that their return is generally negative.
To sum up, the pursuit of liquidity- C1 and the pursuit of value preservation-C2 is better than the bond products of China Securities’ investment products, with low risk but low yield. Pursuing value- C3 performs similarly to the yield of other products, showing negative values, which is contrary to the pursuit of value-added. However, its volatility is smaller than that of other products. The pursuit of returns-C4 is suitable for short-term investment, but the yield is lower than that of the pursuit of liquidity-C1 and the pursuit of value preservation-C2.
The risk measurement employed by Qingting Butler, based solely on simple questionnaires and individual customer investment goals and risk levels, may be somewhat limited.
By comparing different products in the market, the research in this paper shows investors the advantages and disadvantages of robo-advisor products and manual investment products, removing human factors and showing the real reaction of the product in the market. It provides a basis for investors to make decisions in the robo-advisor market. It can be concluded that under the advantages of low rates and low thresholds, the pursuit of liquidity and value preservation products have greater development prospects, and the domestic robo-advisor market will also be fully developed.
6.1. Notes
①From the a.t.kearney.
②From the China Merchants Bank application.
③From the China Securities official website and Qingting Butler application.
④From the Investment Company Institute, ICI.
⑤Paragraph 1 of article 23 of the Guiding Opinions on Regulating the Asset Management Business of Financial Institutions: "The application of artificial intelligence technology to carry out investment advisory business shall obtain the investment advisory qualification, and non-financial institutions shall not use intelligent investment advisory to operate beyond the scope or carry out asset management business in a disguised form."
References
[1]. Ma C Y. Individuals are more enthusiastic about investing in public funds[N]. Economic Daily, 2022-01-13(007).
[2]. Lu P, Ren H F, Liu Q, et al. Research on the development process, risk challenges and coping strategies of intelligent investment advisers[J]. Management & Technology of SME, 2022(22):62-64.
[3]. Xue J, Zhu E, Liu Q, et al. Group recommendation based on financial social network for robo-advisor[J]. IEEE Access, 2018, 6: 54527-54535.
[4]. Guo L. Regulating investment robo-advisors in China: problems and prospects[J]. European Business Organization Law Review, 2020, 21: 69-99.
[5]. Wang H, Li S, Ma Y, et al. Does investor sentiment affect fund crashes? Evidence from Chinese open-end funds[J]. The North American Journal of Economics and Finance, 2022, 60: 101662.
[6]. Zhang L, Pentina I, Fan Y. Who do you choose? Comparing perceptions of human vs robo-advisor in the context of financial services[J]. Journal of Services Marketing, 2021, 35(5): 634-646.
[7]. Hildebrand C, Bergner A. Conversational robo advisors as surrogates of trust: onboarding experience, firm perception, and consumer financial decision making[J]. Journal of the Academy of Marketing Science, 2021, 49: 659-676.
[8]. Cen J H, Xu W R, Zhao F, et al. Rating and recommendation of "Internet + Fund" -- be your own financial analyst[J]. Corporate Finance, 2022(12):139-142.
[9]. Back C, Morana S, Spann M. Do robo-advisors make us better investors?[J]. Available at SSRN 3777387, 2022.
[10]. Boreiko D, Massarotti F. How risk profiles of investors affect robo-advised portfolios[J]. Frontiers in Artificial Intelligence, 2020, 3: 60.
[11]. Ringe W G, Ruof C. A regulatory sandbox for robo advice[J]. 2018.
[12]. Zhang Q, Yue W. Digital Sandbox regulation for smart investment advisers: A computational experimental financial approach [J]. Finance Economy, 2022(06):3-11.
[13]. Wang B, Chen X L. The supervision path of intelligent investment advisory in China [J]. Journal of Northwestern Polytechnical University(Social Sciences), 2021(02):104-111.
[14]. Ma J X. The smart investment service is suspended[N]. International Financial News, 2022-07-04(005).
[15]. Wang S W. Fund investment business rectification speed up[N]. Securities Daily, 2021-12-14(B01).
Cite this article
Junhui,W. (2023). Comparison of Fund Robo-advisor and Manual Decision-making —Focused on China Securities Examples. Advances in Economics, Management and Political Sciences,44,140-150.
Data availability
The datasets used and/or analyzed during the current study will be available from the authors upon reasonable request.
Disclaimer/Publisher's Note
The statements, opinions and data contained in all publications are solely those of the individual author(s) and contributor(s) and not of EWA Publishing and/or the editor(s). EWA Publishing and/or the editor(s) disclaim responsibility for any injury to people or property resulting from any ideas, methods, instructions or products referred to in the content.
About volume
Volume title: Proceedings of the 7th International Conference on Economic Management and Green Development
© 2024 by the author(s). Licensee EWA Publishing, Oxford, UK. This article is an open access article distributed under the terms and
conditions of the Creative Commons Attribution (CC BY) license. Authors who
publish this series agree to the following terms:
1. Authors retain copyright and grant the series right of first publication with the work simultaneously licensed under a Creative Commons
Attribution License that allows others to share the work with an acknowledgment of the work's authorship and initial publication in this
series.
2. Authors are able to enter into separate, additional contractual arrangements for the non-exclusive distribution of the series's published
version of the work (e.g., post it to an institutional repository or publish it in a book), with an acknowledgment of its initial
publication in this series.
3. Authors are permitted and encouraged to post their work online (e.g., in institutional repositories or on their website) prior to and
during the submission process, as it can lead to productive exchanges, as well as earlier and greater citation of published work (See
Open access policy for details).
References
[1]. Ma C Y. Individuals are more enthusiastic about investing in public funds[N]. Economic Daily, 2022-01-13(007).
[2]. Lu P, Ren H F, Liu Q, et al. Research on the development process, risk challenges and coping strategies of intelligent investment advisers[J]. Management & Technology of SME, 2022(22):62-64.
[3]. Xue J, Zhu E, Liu Q, et al. Group recommendation based on financial social network for robo-advisor[J]. IEEE Access, 2018, 6: 54527-54535.
[4]. Guo L. Regulating investment robo-advisors in China: problems and prospects[J]. European Business Organization Law Review, 2020, 21: 69-99.
[5]. Wang H, Li S, Ma Y, et al. Does investor sentiment affect fund crashes? Evidence from Chinese open-end funds[J]. The North American Journal of Economics and Finance, 2022, 60: 101662.
[6]. Zhang L, Pentina I, Fan Y. Who do you choose? Comparing perceptions of human vs robo-advisor in the context of financial services[J]. Journal of Services Marketing, 2021, 35(5): 634-646.
[7]. Hildebrand C, Bergner A. Conversational robo advisors as surrogates of trust: onboarding experience, firm perception, and consumer financial decision making[J]. Journal of the Academy of Marketing Science, 2021, 49: 659-676.
[8]. Cen J H, Xu W R, Zhao F, et al. Rating and recommendation of "Internet + Fund" -- be your own financial analyst[J]. Corporate Finance, 2022(12):139-142.
[9]. Back C, Morana S, Spann M. Do robo-advisors make us better investors?[J]. Available at SSRN 3777387, 2022.
[10]. Boreiko D, Massarotti F. How risk profiles of investors affect robo-advised portfolios[J]. Frontiers in Artificial Intelligence, 2020, 3: 60.
[11]. Ringe W G, Ruof C. A regulatory sandbox for robo advice[J]. 2018.
[12]. Zhang Q, Yue W. Digital Sandbox regulation for smart investment advisers: A computational experimental financial approach [J]. Finance Economy, 2022(06):3-11.
[13]. Wang B, Chen X L. The supervision path of intelligent investment advisory in China [J]. Journal of Northwestern Polytechnical University(Social Sciences), 2021(02):104-111.
[14]. Ma J X. The smart investment service is suspended[N]. International Financial News, 2022-07-04(005).
[15]. Wang S W. Fund investment business rectification speed up[N]. Securities Daily, 2021-12-14(B01).