


1.Introduction
Financial time-series forecasting's most common and difficult task has always been stock price prediction. Early studies on stock prediction, however, were based on the Efficient Market Hypothesis (EMH), which holds that stock prices only fluctuate in response to the arrival of new information [1], making accurate stock price forecasting impossible [2]. However, because the theory's presumptions are not always met, relevant investigations cast doubt on its applicability [3]. In order to reconcile the EMH and the influence of historical data on stock prices, the Adaptive Market Hypothesis was proposed [4]. According to certain research, EMH performed better than others at predicting stock returns, indicating that stock prices can be somewhat forecasted [5]. Autoregressive Integrated Moving Average (ARIMA) and Univariate Moving Average (MA), and others are common techniques for forecasting time series data. The precision and accuracy of ARIMA models particularly shine when anticipating the following lag in a time series. The ability to anticipate time series data has improved with advancements in computing power, making more sophisticated machine learning techniques like deep learning increasingly useful for stock price forecasting [6].
Research in machine learning for stock price prediction is broadly divided into two directions, one focused on forecasting the fluctuations in the overall stock market, and the other dedicated to anticipating the precise values of individual stock prices. The first category of studies mainly used classification methods in machine learning. The k Nearest Neighbour (k-NN) classifier is the simplest machine learning classifier, and thanks to its fast training speed, it performs better in predicting stock data with large amounts of data [7]. Support vector machines (SVMs) have been used as one of the most important tools for stock price prediction due to their powerful classification power. Fletcher and Taylor further used multi-kernel SVMs to significantly improve prediction performance [8]. In terms of stock price prediction, researchers usually use linear regression, neural networks and other machine learning methods to study. Actually, neural networks play an important role in predicting stock prices over time. The Artificial Neural Network (ANN) can map non-linear functions without a priori assumptions and therefore has satisfactory performance in predicting highly non-linear financial series data [9]. Recurrent neural networks (RNN) and genetic algorithms (GA) were coupled by Kwon et al. to predict the NASDAQ, and the results were superior to those of conventional financial techniques [10].
Additionally, in financial forecasting, increasingly complex deep learning models are gaining popularity. To handle embedding events gathered from news websites and predict the S&P index, Ding constructed a deep convolutional neural network (CNN) [11]. To examine news items shared on social media, Chen constructed a deep recurrent neural network [12]. Recurrent Neural Network (RNN) modification known as Long Short-Term Memory (LSTM) can avoid the gradient disappearance and gradient explosion issues that RNN has [13]. And the research result of Siami-Namini demonstrated that deep learning-based LSTM outperforms traditional time series forecasting methods [6].
While these models can be effective in capturing certain patterns and trends in the market, they often struggle to account for external factors that may influence stock prices. News events, political developments, economic indicators, and other non-time series data can play a significant role in shaping market sentiment and, subsequently, stock price movements [14]. To address this limitation, sentiment analysis techniques are employed in this study to analyze news headlines and extract sentiment scores. Sentiment analysis involves assessing the polarity of text, determining whether it conveys a positive, negative, or neutral sentiment. By quantifying the sentiment scores of news headlines, analysts can derive a measure of market sentiment for a given day or period.
This study suggests a CNN-BiLSTM-AM based method for forecasting the closing price of equities the following day. Convolutional neural networks (CNN), bidirectional LSTM (BiLSTM), and an attention mechanism (AM) make up the model. From the input stock data and news headline sentiment scores, CNN can extract features. The stock closing price for the following day is predicted by BiLSTM using the retrieved feature data. In order to increase forecast accuracy, AM is utilised to record the impact of various temporal feature states on historical closing stock prices.
2.Method
In this section, the sources and content of the share price data and news headline data are firstly described. Then the details of the hybrid model CNN-BiLSTM-AM used in stock index prediction are provided. Finally, this study presents the selection of hyper-parameters in the hybrid model.
2.1.Dataset Description and Preprocessing
The stock price data and news headline data chosen for the experiment is for the time period 1 May 2018 to 28 April 2023, which consists of 1,281 trading days. In particular, the share price data is derived from Investing's historical share index data for the Nasdaq 100 index, is a closely watched indicator of important financial markets for global investors. The index is intended to monitor the market capitalization-weighted performance and price volatility of the stocks of 100 major corporations. The features such as Nasdaq 100's first traded price and number of stocks traded during the day, and adjusted closing price are all included in the stock index data. In this inquiry, the model's prediction is based on the Nasdaq 100 closing price.
A dataset of the top 25 news headlines from Reddit is chosen in order to investigate the content features that influence Nasdaq 100 predictions. Reddit ranked as the tenth most popular website globally and the sixth most popular in the US, according to Semrush [15]. The website encompasses an extensive array of subject matters, spanning across diverse topics, including international news, politics, economics, science, technology, entertainment and more. This study chose news headlines from the forum site to correlate with stock price forecasts because the forum site captures hot topics more quickly than official media sites due to their relatively more lenient vetting of news headlines. Therefore, the diversity of subjects and timeliness of topics on discussion sites make news headlines on such sites more relevant to real-time changes in stock prices.
Prior to utilizing the data in the model training, integrating the news headlines data with the stock price data based on dates is required. The Nasdaq 100 dataset lacks weekend price data as the stock market is closed over the weekend, therefore, the weekend data for news headlines needs to be removed to ensure that the dates are consistent between the two data sets. Also, the news headline dataset was selected for the same time period as the Nasdaq 100 dataset to ensure that datasets from different sources could have data for the same time period. Furthermore, the integrated data will be normalised together.
2.2.CNN-BiLSTM-AM
The origin of the CNN architecture was proposed by Kunihiko Fukushima in 1980, which consists of convolutional layers and down sampling layers [16]. Lecun first used backpropagation to fully automate the learning of convolutional kernel functions from handwritten digital images in 1980, and CNN became widely used for problems such as image recognition and computer vision [17]. Due to the superior performance of two-dimensional CNN for feature extraction in image data, for time series data, we use one-dimensional CNN for feature extraction. Researchers such as Chen et al. [18], Ba et al. [19], and Hu et al. [20] have proposed various methods to improve algorithmic trading frameworks and predict financial time series data using deep CNN models, planar feature representations, and clustering techniques. It excels at feature extraction, leveraging local perception and weight sharing to reduce parameters and enhance learning model efficiency. Comprising convolution layers, pooling layers, and fully connected layers [21], CNN employs convolution kernels to extract data features [22]. To address the issue of high-dimensional extracted features, a pooling layer is introduced [22].
Schmidhuber first proposed the LSTM network in 1997 [23]. Its predecessor, the RNN, served as a model for it, and its primary goal is to address RNN's enduring gradient explosion and gradient disappearance issues [24]. The LSTM network introduces a cell unit along with three gate structures to govern the information flow in accordance with the RNN, in contrast to the conventional RNN which solely employs a single recurrent module. These gate structures encompass the forgetting gate, the input gate, and the output gate. The visual representation of the fundamental LSTM structure can be found in Figure 1.
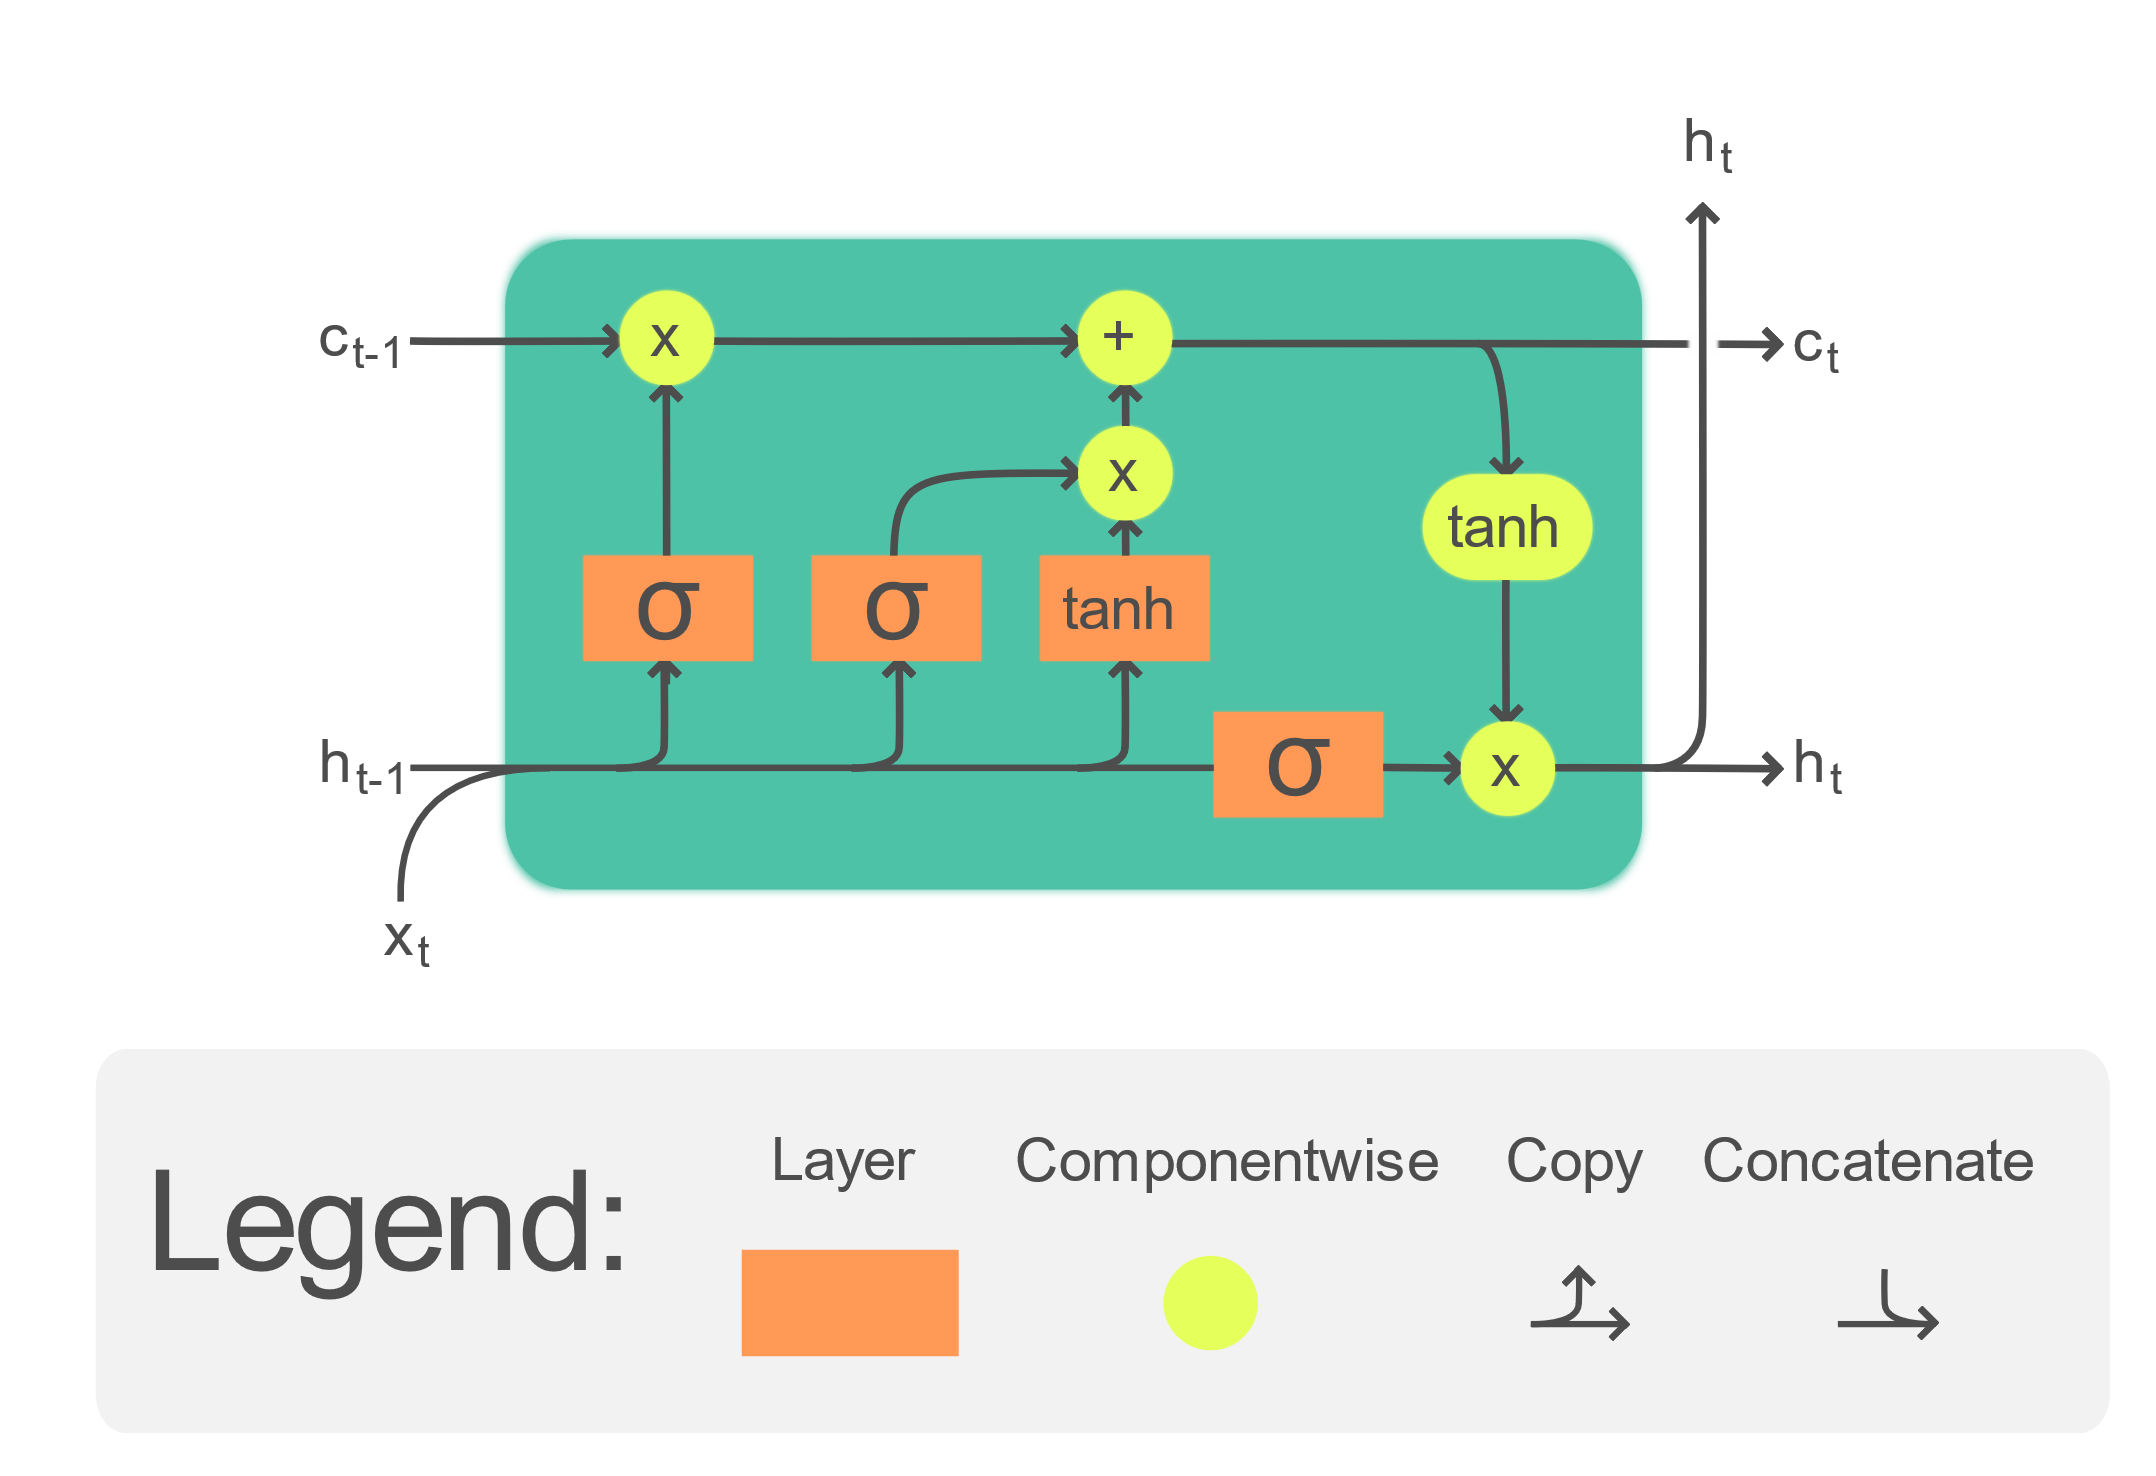
Figure 1: Structure of LSTM.[25]
A development over the conventional one-way LSTM network is the BiLSTM network. It comprises of two separate LSTMs, one moving ahead and the other moving backward, allowing for feature extraction. The final network output is created by joining the two LSTMs' output vectors. This distinct neural network topology outperforms LSTM networks in terms of effectiveness and performance when extracting features from time series data [26].
Considering the notable feature extraction capabilities of CNN and the adeptness of RNN in processing time series data, an ideal architectural design would amalgamate both models, leveraging their respective strengths to enhance the precision of predictions. With this objective in mind, the present investigation introduces an integrated architecture that combines CNN and BiLSTM. By fusing distinct representations derived from financial time series data, the proposed approach aims to advance the accuracy of stock price prediction.
Attention Mechanism (AM) is a method to select key information by calculating attention probability distributions. It aims to optimize traditional models by emphasizing important inputs from a large amount of information. Inspired by human visual attention, which quickly identifies crucial areas to gather detailed information, AM selectively focuses on significant information while disregarding unimportant details, assigning varying degrees of importance to different pieces of information. It has been widely adopted in speech recognitio, picture captionin, and machine translation.
In this paper, the attention mechanism is also taken into account to memorise lengthy sequences in order to increase the scalability and accuracy of the integrated neural network model. A comprehensive depiction of the network structure can be observed in Figure 2.
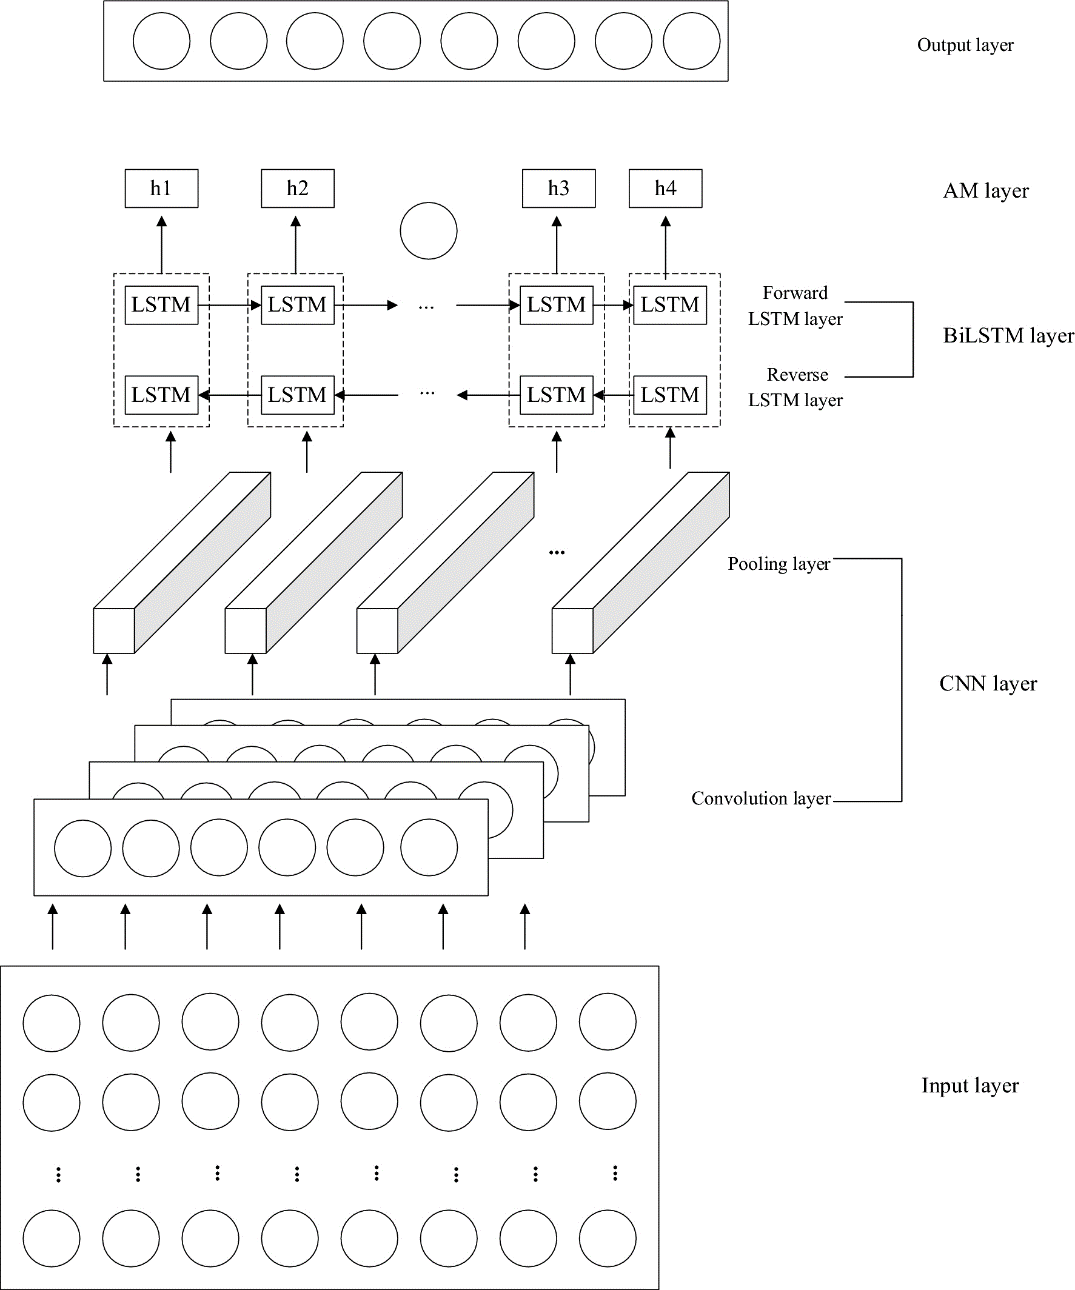
Figure 2: The structure of CNN-BiLSTM-AM model (Photo/Picture credit: Original).
2.3.Implementation Details
The approach was compared with BiLSTM, CNN-BiLSTM, and CNN-BiLSTM-AM in the same operational environment to show the efficacy of CNN-BiLSTM-AM with sentiment analysis. Tensorflow 2.0 in Python is used to implement the model.
2.3.1.Parameter Settings
The model's parameter settings are displayed in Table 1:
Table 1: The setting of parameters for CNN-BiLSTM-AM model.
|
Parameters |
Values |
|
filters |
128 |
|
kernel size |
2 |
|
activation function |
Relu |
|
Number of hidden units in BiLSTM layer |
64 |
|
activation function |
Relu |
This paper adopts uniform training parameters for all methods, wherein the epoch is set to 50, the mean squared error (MSE) is utilized as the loss function, the Adam optimizer is selected, a batch size of 64 is employed, a time step of 2 is applied, and a learning rate of 0.01 is utilized.
2.3.2.Evaluation Metrics
Stock price forecasting falls under the category of regression forecasting and therefore this paper uses Root Mean Square Error (RMSE) and Mean Absolute Error (MAE) to evaluate the performance of the model. These error metrics are calculated as follows:
\( RMSE= \sqrt[]{\frac{1}{m}\sum _{i=1}^{m}{({y_{i}}-\hat{{y_{i}}})^{2}}} \)
\( MAE=\frac{1}{m}\sum _{i=1}^{m}|{y_{i}}-\hat{{y_{i}}}| \)
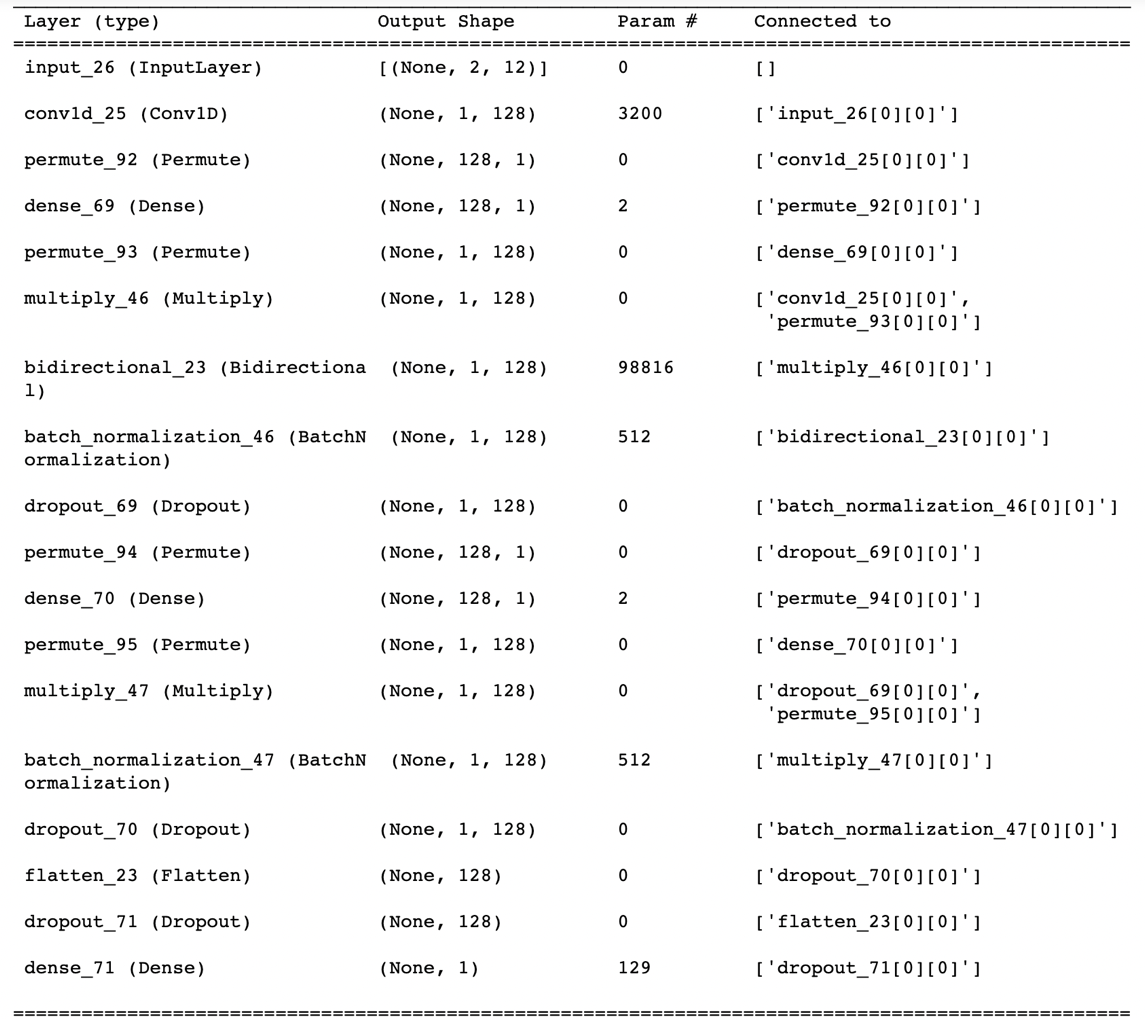
Figure 3: The summary of CNN-BiLSTM-AM model (Photo/Picture credit: Original).
The diagram Figure 3 illustrates the model building process. The first layer builds a fully connected layer to receive complete data, which is passed to the lower layer for processing by a bi-directional LSTM after acquiring neurons with short-term features through one-dimensional convolutional layer. The neurons learn complete information using the bi-directional feature, and then a Batch normalisation layer is called to speed up training to prevent gradient disappearance to aid model refinement.
3.Results and Discussion
3.1.The Performance of Various Models
The pre-processed data were employed to train BiLSTM, CNN-BiLSTM, CNN-BiLSTM-AM, CNN-BiLSTM-AM with sentiment analysis respectively, and the resulting models were used to do prediction, comparing the true values with the predicted values, as shown in Figures 4, Figure 5, Figure 6 and Figure 7.
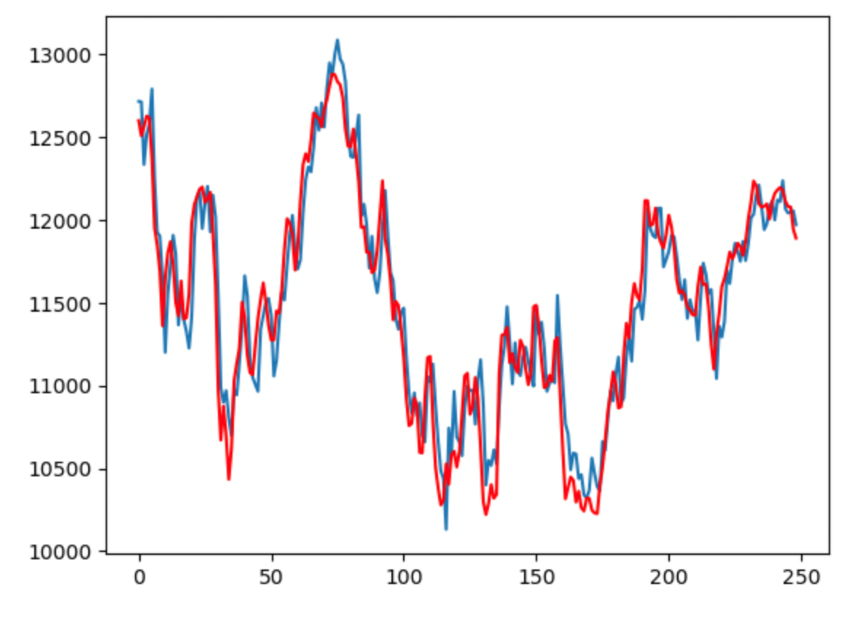
Figure 4: Comparison of BiLSTM predicted value and real value (Photo/Picture credit: Original).

Figure 5: Comparison of CNN-BiLSTM predicted value and real value (Photo/Picture credit: Original).
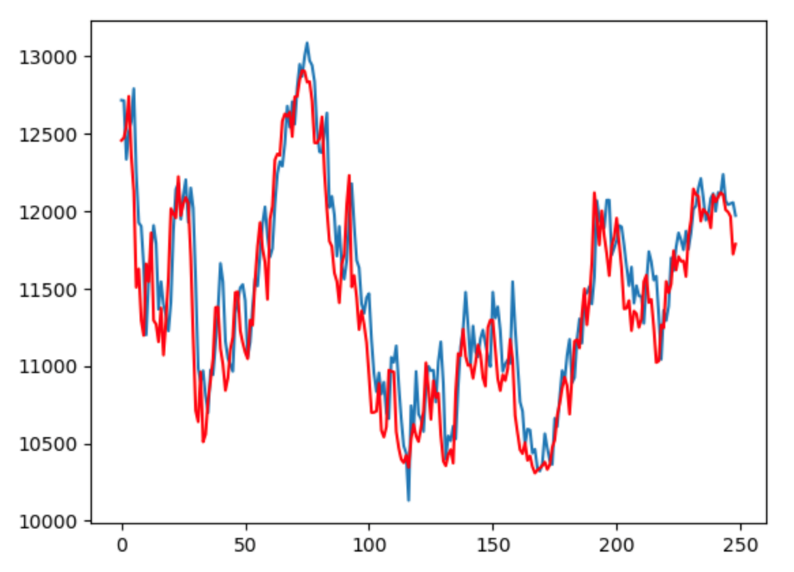
Figure 6: Comparison of CNN-BiLSTM-AM predicted value and real value (Photo/Picture credit: Original).
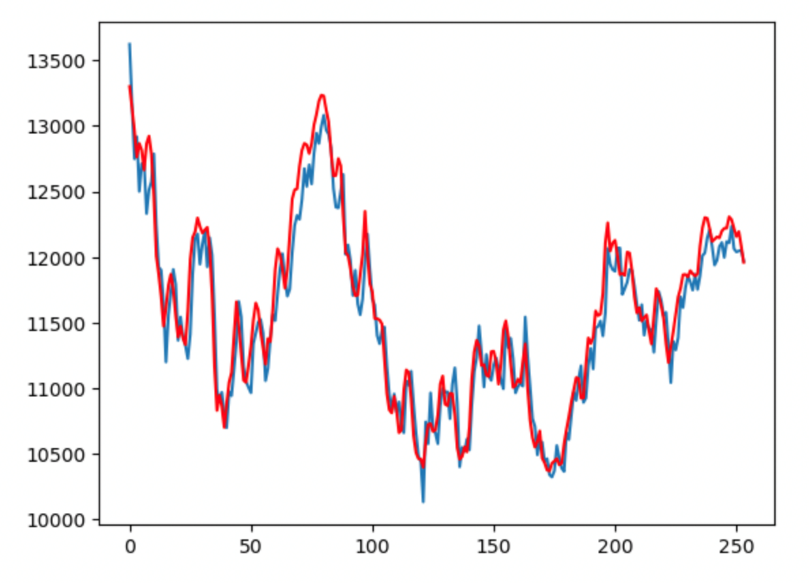
Figure 7: Comparison of CNN-BiLSTM-AM with sentiment analysis predicted value and real value (Photo/Picture credit: Original).
The broken line fit between the true and predicted values for CNN-BiLSTM-AM with sentiment analysis, CNN-BiLSTM-AM, CNN-BiLSTM, and BiLSTM was graded from highest to lowest among the four prediction methods. While BiLSTM had the lowest degree of line fit, CNN-BiLSTM-AM with sentiment analysis had the highest degree of line fit, virtually entirely overlapping the true and predicted values. The evaluation error indicators for each technique may be derived based on the anticipated and true values for each approach, and the results of the comparison of the four methods are displayed in Table 2.
Table 2: Comparison of five models evaluated by two indicators.
|
Method |
RMSE |
MAE |
|
BiLSTM |
0.08 |
265.75 |
|
CNN-BiLSTM |
0.07 |
222.01 |
|
CNN-BiLSTM-AM |
0.05 |
200.55 |
|
CNN-BiLSTM-AM with Sentiment Analysis |
0.05 |
158.35 |
3.2.Discussion
The CNN-BiLSTM-AM with sentiment analysis has the lowest MAE and RMSE, as shown in Table 2. BiLSTM, on the other hand, has the lowest MAE and RMSE. In order of high to low prediction accuracy, the four approaches are CNN-BiLSTM-AM with sentiment analysis, CNN-BiLSTM-AM, CNN-BiLSTM, and BiLSTM. After the CNN layer, there is a reduction in MAE and RMSE for BiLSTM. The CNN-BiLSTM's prediction accuracy increased when it was used in AM. The RMSE declined by 0.02 and the MAE by 21.46. The MAE reduced to 158.35 and the RMSE decreased to 0.05 when the sentiment analysis data were further included, marking the model's highest prediction performance. The outcomes demonstrate that of the four approaches, CNN-BiLSTM-AM with sentiment analysis performs the best. Among the four examined approaches, the research proposes that the CNN-BiLSTM-AM method, integrated with sentiment analysis, exhibits superior performance in forecasting the subsequent day's closing price of the stock. Consequently, this method serves as a valuable reference for investors in making optimal investment decisions.
4.Conclusion
In this paper, an effective CNN-BiLSTM-AM with sentiment analysis neural network model is suggested and implemented to forecast the stock price. Additionally, the model makes use of CNN to extract features from the input data, BiLSTM to learn from and forecast the extracted feature data, and AM to capture how the feature states of the time series data change over time and how that changes the outcome of the prediction. The experimental results demonstrate that BiLSTM, CNN-BiLSTM, CNN-BiLSTM-AM, and CNN-BiLSTM-AM with sentiment analysis are the four methods with the smallest MAE and RMSE. The CNN-BiLSTM-AM model, incorporating sentiment analysis, demonstrates the highest level of prediction accuracy and superior performance compared to other methods. Future research will not only make the results more accurate by adjusting the parameters in the models, but may also add other time series data that are highly correlated with stock prices so that the accuracy can be improved not only through model innovation, blending and increasing the depth of the models, but also by exploring more ways to mix the model data.
References
[1]. Peters, E. E. (1996). Chaos and order in the capital markets: A new view of cycles, prices, and market volatility. Oxford: Wiley
[2]. Ersan, D., Nishioka, C. & Scherp. (2020) A. Comparison of machine learning methods for financial time series forecasting at the examples of over 10 years of daily and hourly data of DAX 30 and S&P 500. J Comput Soc Sc 3, 103–133.
[3]. Malkiel, B. G. (2003). The efficient market hypothesis and its critics. Journal of Economic Perspectives, 17(1), 59–82
[4]. Lo, A. W. (2004). The adaptive markets hypothesis: Market efficiency from an evolutionary perspective. Journal of Portfolio Management, Forthcoming
[5]. Urquhart, A., & Hudson, R. (2013). Efficient or adaptive markets? Evidence from major stock markets using very long run historic data. International Review of Financial Analysis, 28, 130-142.
[6]. Siami-Namini, S., Tavakoli, N., & Namin, A. S. (2018). A comparison of ARIMA and LSTM in forecasting time series. In 2018 17th IEEE international conference on machine learning and applications (ICMLA) (pp. 1394-1401). IEEE
[7]. Teixeira, L. A., & De Oliveira, A. L. I. (2010). A method for automatic stock trading combining technical analysis and nearest neighbor classification. Expert systems with applications, 37(10), 6885-6890.
[8]. Fletcher, T., Shawe-Taylor, J. (2013). Multiple kernel learning with fisher kernels for high frequency currency prediction. Computational Economics, 42: 217-240.
[9]. Qiu, M., Song, Y., & Akagi, F. (2016). Application of artificial neural network for the prediction of stock market returns: The case of the Japanese stock market. Chaos, Solitons & Fractals, 85, 1-7.
[10]. Kwon, Y. K., & Moon, B. R. (2007). A hybrid neurogenetic approach for stock forecasting. IEEE transactions on neural networks, 18(3), 851-864.
[11]. Ding, X., Zhang, Y., Liu, T., & Duan, J. (2015). Deep learning for event-driven stock prediction. In Twenty-fourth international joint conference on artificial intelligence.
[12]. Chen, W., Zhang, Y., Yeo, C. K., Lau, C. T., & Lee, B. S. (2017). Stock market prediction using neural network through news on online social networks. In 2017 international smart cities conference (ISC2) (pp. 1-6). IEEE.
[13]. Lu, W., Li, J., Wang, J. et al. (2021). A CNN-BiLSTM-AM method for stock price prediction. Neural Comput & Applic 33, 4741–4753.
[14]. Chatrath, A., Miao, H., Ramchander, S., & Villupuram, S. (2014). Currency jumps, cojumps and the role of macro news. Journal of International Money and Finance, 40, 42-62.
[15]. Wikipedia. Reddit Website Traffic, Ranking, Analytics [February 2023]. Semrush. Retrieved May 9, 2022. https://en.wikipedia.org/wiki/Reddit#References
[16]. Fukushima, K. (1980). Neocognitron: A self-organizing neural network model for a mechanism of pattern recognition unaffected by shift in position. Biological cybernetics, 36(4), 193-202.
[17]. Lecun, Y., Botou, L., Bengio, Y., Haffner, P. (1998) Gradient-based learning applied to document recognition. Proc IEEE 86(11):2278–2324.
[18]. Chen, J. F., et al. (2016). Financial time-series data analysis using deep convolutional neural networks, 7th International Conference on Cloud Computing and Big Data (CCBD), pp. 87-92.
[19]. Ba, J. L., et al. (2015) Predicting deep zero-shot convolutional neural networks using textual descriptions, IEEE International Conference on Computer Vision, pp. 4247-55.
[20]. Hu, G., et al. (2017). Deep stock representation learning: from candlestick charts to investment decisions.
[21]. Hao, Y., Gao, Q. (2020). Predicting the trend of stock market index using the hybrid neural network based on multiple time scale feature learning. Appl Sci 10(11):3961–3974
[22]. Kamalov, F. (2020). Forecasting significant stock price changes using neural networks. Neural Comput Appl.
[23]. Hochreiter, S., Schmidhuber, J. (1997). Long Short-Term Memory. MIT Press 9(8):1735-1780
[24]. Ta, V., Liu, C., Tadesse, D. (2020). Portfolio optimization-based stock prediction using long-short term memory network in quantitative trading. Appl Sci 10(2):437–456
[25]. Wikipedia, (2023) Long short-term_memory, https://en.wikipedia.org/wiki/Long_short-term_memory
[26]. Liu, W., Zhang, Y., Liu, Y. (2022). Attention-based BiLSTM model for stock price prediction, Proceedings of the 2022 5th International Conference on Artificial Intelligence and Pattern Recognition, 257-263.
Cite this article
Zheng,X. (2023). Stock Price Prediction Based on CNN-BiLSTM Utilizing Sentiment Analysis and a Two-layer Attention Mechanism. Advances in Economics, Management and Political Sciences,47,40-49.
Data availability
The datasets used and/or analyzed during the current study will be available from the authors upon reasonable request.
Disclaimer/Publisher's Note
The statements, opinions and data contained in all publications are solely those of the individual author(s) and contributor(s) and not of EWA Publishing and/or the editor(s). EWA Publishing and/or the editor(s) disclaim responsibility for any injury to people or property resulting from any ideas, methods, instructions or products referred to in the content.
About volume
Volume title: Proceedings of the 2nd International Conference on Financial Technology and Business Analysis
© 2024 by the author(s). Licensee EWA Publishing, Oxford, UK. This article is an open access article distributed under the terms and
conditions of the Creative Commons Attribution (CC BY) license. Authors who
publish this series agree to the following terms:
1. Authors retain copyright and grant the series right of first publication with the work simultaneously licensed under a Creative Commons
Attribution License that allows others to share the work with an acknowledgment of the work's authorship and initial publication in this
series.
2. Authors are able to enter into separate, additional contractual arrangements for the non-exclusive distribution of the series's published
version of the work (e.g., post it to an institutional repository or publish it in a book), with an acknowledgment of its initial
publication in this series.
3. Authors are permitted and encouraged to post their work online (e.g., in institutional repositories or on their website) prior to and
during the submission process, as it can lead to productive exchanges, as well as earlier and greater citation of published work (See
Open access policy for details).
References
[1]. Peters, E. E. (1996). Chaos and order in the capital markets: A new view of cycles, prices, and market volatility. Oxford: Wiley
[2]. Ersan, D., Nishioka, C. & Scherp. (2020) A. Comparison of machine learning methods for financial time series forecasting at the examples of over 10 years of daily and hourly data of DAX 30 and S&P 500. J Comput Soc Sc 3, 103–133.
[3]. Malkiel, B. G. (2003). The efficient market hypothesis and its critics. Journal of Economic Perspectives, 17(1), 59–82
[4]. Lo, A. W. (2004). The adaptive markets hypothesis: Market efficiency from an evolutionary perspective. Journal of Portfolio Management, Forthcoming
[5]. Urquhart, A., & Hudson, R. (2013). Efficient or adaptive markets? Evidence from major stock markets using very long run historic data. International Review of Financial Analysis, 28, 130-142.
[6]. Siami-Namini, S., Tavakoli, N., & Namin, A. S. (2018). A comparison of ARIMA and LSTM in forecasting time series. In 2018 17th IEEE international conference on machine learning and applications (ICMLA) (pp. 1394-1401). IEEE
[7]. Teixeira, L. A., & De Oliveira, A. L. I. (2010). A method for automatic stock trading combining technical analysis and nearest neighbor classification. Expert systems with applications, 37(10), 6885-6890.
[8]. Fletcher, T., Shawe-Taylor, J. (2013). Multiple kernel learning with fisher kernels for high frequency currency prediction. Computational Economics, 42: 217-240.
[9]. Qiu, M., Song, Y., & Akagi, F. (2016). Application of artificial neural network for the prediction of stock market returns: The case of the Japanese stock market. Chaos, Solitons & Fractals, 85, 1-7.
[10]. Kwon, Y. K., & Moon, B. R. (2007). A hybrid neurogenetic approach for stock forecasting. IEEE transactions on neural networks, 18(3), 851-864.
[11]. Ding, X., Zhang, Y., Liu, T., & Duan, J. (2015). Deep learning for event-driven stock prediction. In Twenty-fourth international joint conference on artificial intelligence.
[12]. Chen, W., Zhang, Y., Yeo, C. K., Lau, C. T., & Lee, B. S. (2017). Stock market prediction using neural network through news on online social networks. In 2017 international smart cities conference (ISC2) (pp. 1-6). IEEE.
[13]. Lu, W., Li, J., Wang, J. et al. (2021). A CNN-BiLSTM-AM method for stock price prediction. Neural Comput & Applic 33, 4741–4753.
[14]. Chatrath, A., Miao, H., Ramchander, S., & Villupuram, S. (2014). Currency jumps, cojumps and the role of macro news. Journal of International Money and Finance, 40, 42-62.
[15]. Wikipedia. Reddit Website Traffic, Ranking, Analytics [February 2023]. Semrush. Retrieved May 9, 2022. https://en.wikipedia.org/wiki/Reddit#References
[16]. Fukushima, K. (1980). Neocognitron: A self-organizing neural network model for a mechanism of pattern recognition unaffected by shift in position. Biological cybernetics, 36(4), 193-202.
[17]. Lecun, Y., Botou, L., Bengio, Y., Haffner, P. (1998) Gradient-based learning applied to document recognition. Proc IEEE 86(11):2278–2324.
[18]. Chen, J. F., et al. (2016). Financial time-series data analysis using deep convolutional neural networks, 7th International Conference on Cloud Computing and Big Data (CCBD), pp. 87-92.
[19]. Ba, J. L., et al. (2015) Predicting deep zero-shot convolutional neural networks using textual descriptions, IEEE International Conference on Computer Vision, pp. 4247-55.
[20]. Hu, G., et al. (2017). Deep stock representation learning: from candlestick charts to investment decisions.
[21]. Hao, Y., Gao, Q. (2020). Predicting the trend of stock market index using the hybrid neural network based on multiple time scale feature learning. Appl Sci 10(11):3961–3974
[22]. Kamalov, F. (2020). Forecasting significant stock price changes using neural networks. Neural Comput Appl.
[23]. Hochreiter, S., Schmidhuber, J. (1997). Long Short-Term Memory. MIT Press 9(8):1735-1780
[24]. Ta, V., Liu, C., Tadesse, D. (2020). Portfolio optimization-based stock prediction using long-short term memory network in quantitative trading. Appl Sci 10(2):437–456
[25]. Wikipedia, (2023) Long short-term_memory, https://en.wikipedia.org/wiki/Long_short-term_memory
[26]. Liu, W., Zhang, Y., Liu, Y. (2022). Attention-based BiLSTM model for stock price prediction, Proceedings of the 2022 5th International Conference on Artificial Intelligence and Pattern Recognition, 257-263.