


1 Introduction
Energy sources is the significant fundamental of economic development and social progress. Petroleum occupies a dominant position in energy sources which is an important strategic material of the country. According to the BP Statistic Review of World Energy 2021, crude oil still occupies an dominate status in the global fuel consumption. And the research pointed out that crude oil in the primary energy consumption structure is about 31.2% [1]. What is more, petroleum is an important raw material for manufacturing. In the essay named ‘An analysis of domestic oil prices by international oil prices, economic growth and changes in crude oil consumption’ the author pointed out that factors affecting domestic crude oil prices are international crude oil prices, gross domestic product and domestic crude oil consumption [2]. Another report named ‘The transformation and upgrading of China’s petroleum equipment manufacturing industry under the background of low oil prices’ suggested that changes in international crude oil prices will affect the transformation of the manufacturing industry [3]. Therefore, when petroleum price move manufacturing price which is related to the petroleum will change as well.
On February 24,2022 Russia and Ukraine launched military activities which will be named as Russian-Ukrainian conflict in the following essay. After the conflict broke out, Russia was subjected to economic sanctions which impacted the petroleum export from Russia. Russia is one of the largest national producer and exporter of crude oil. According to the BP Statistic Review of World Energy 2021, Russia’s crude oil reserves as high as 107.8 billion barrels at the end of 2020 which occupied 6.2% of the world’s total crude oil reserves [1]. China is the largest energy consumer in the world and also the biggest crude oil importer since 2017. As the rapidly development of social and economy, China’s petroleum imports have been rising from 30.7% in 2001 to 72.1% in 2021 which is 50% above the international warning line. In 2021, China’s crude oil imports are from 46 different countries such as Saudi Arabia, Iraq and Russia. Among them, Russia crude oil imports accounted for 15.5%. Therefore, Russia’s crude oil price change will influence many other countries. However, different those countries United States has abundant shale oil resources which could be explored about 58 billion barrels and accounting for 16.8%. At the beginning of the 21st century, the breakthrough in vertical drilling and hydraulic fracturing technology have significantly reduced the cost of shale oil extraction. The explosive growth of shale oil production in United States has changed the pattern of global oil production. Until 2019 U.S surpassed Saudi Arabia and Russia to become the largest oil producer in the world. Since then, Russia’s influence has been weakened and the global crude oil supply was mainly controlled by United States, Russia and Saudi Arabia. According to the research named ‘International oil trade in the context of the Russian-Ukrainian conflict pattern evolution trends and China's response’ the author pointed out that United States shale oil production was expected to be stronger [4]. And stimulated by high crude oil prices the major shale oil producing areas in the United States have begun to increase the number of drilling. However, due to the inflationary, the increasing of supply chain bottlenecks and increased capital constraints made shale oil production growth weakly. Based on United States Energy Information Administration that United States crude oil production is 12 million barrels per day on average on 2022 and will reach about 12.6 million barrels per day in 2023 which will exceed the peak of 12.3 million barrels per day in 2019 [5]. Yu Linna pointed out U.S. crude oil production will grow at a slower pace than previously expected as shale producers grapple with labor costs amid rising inflation. [6] On March1,2022, in order to meet the challenge of declining in crude oil exports caused by Russian-Ukrainian conflict, the International Energy Agency announced that 60 million barrels of crude oil will be released by 31 member countries, of which the United States promised to release 30 million barrels. On March 30,2022 the United States announced that it would release 180 million barrels of crude oil strategic reserves over the next six months which will be the largest in the history. Mo Li announced that this manner could inhibit the rising crude oil prices in the short term, but it cannot make up for the market gap left by Russia-Ukrainian conflict completely. Also, it could not improve the contradiction between supply and demand in the market fundamentally.[7] The expected international oil price will continue growth. According to above data, the import and export prices of crude oil will be more or less affected by the international political situation which is referred as Russia-Ukrainian conflict in this essay.
Currently the articles which are related to the impact of crude oil price movements in Russian-Ukrainian conflict are only analyzed the overall impact on the national finances. Zhang Yue believes that coal, oil and natural gas as the three major energy products imported by the European Union from Russia, the dependence degree different, from around the world can finally get the alternative sources of difficulty also is not the same, but no matter how the final result, the EU will bear the financial cost of expensive for imported energy conversion and potential market risk. Russia is the biggest supplier of coal to the EU, and the EU is Russia's biggest export customer, accounting for more than 46% of EU imports. The MEMBER states of the EU may be exposed to the risks and pressures of inflation and economic recession, and the risk of recession in the EU economy in 2022 cannot be ruled out [8]. Shi Hongyu in the research is expected to maintain high international oil prices in June wide fluctuations. The fundamentals of the world oil market are still in a tight state, the west continues to push forward the sanctions on Russian oil will still constitute an important support for oil prices [9]. Li Xiao thinks the Russia-Ukraine conflict makes the world economy face the risk of falling into stagflation again. On the one hand, the conflict between Russia and Ukraine has had a major impact on the world's energy, raw materials and food supply chains, leading to a surge in commodity prices. Sharp shocks to market expectations combined with the impact of export bans and financial sanctions have created severe challenges for global commodity supply chains. Conflict between Russia and Ukraine, on the other hand, add the biggest uncertainty for the world economy, is the rising commodity prices, making it the world economy has entered a downward channel, supply chain disruptions, rising inflation and labor under the background of population decline, in the developed countries of the world economy downside pressure and even the overall economic recession [10]. However, those researches did not have an in-depth analysis about the crude oil prices movement impact in manufacturing. There is also a lake of information on the impact of crude oil prices movements on the United States in the context of Russian-Ukrainian conflict, as well as a comparison between China and the United States. In hence, this article will analyze the impact of crude oil price change in Russian-Ukrainian conflict on China’s and United States manufacturing. This essay is based on the analysis of international futures crude oil prices three month before the start of Russian-Ukrainian conflict, the China Manufacturing Index and the United States Dow Jones Manufacturing Index. The research will use VAR and ARMA-GARCH model to analyze that hypothesis.
The rest of this paper is organized as follows: Part 2 is research design, which include data sources, unit root test and model specification; Part 3 is experimental results and analysis which includes VAR identification, impulse and response, ARMA Identification and ARMA-GARCH estimate results; Part 4 is based on the above research conclusions, it is discussed, including the connection between the research conclusions of this paper and the viewpoints of the references, and how policy makers and investors use the research conclusions of this paper; Part 5 is the conclusion of this research.
2 Research design
2.1 Data sources
All data in this study are from Choice financial terminals. Choice financial terminal is an Internet big data financial hyper-terminal for users of different types of institutions such as financial investment institutions, research institutions and academic institutions. The data covers stocks, funds, bonds, indexes, commodities, foreign exchange and macro industries, and pushes all kinds of announcements, all kinds of information data and research reports in real-time 7×24 hours. Choice financial terminal has data authority, it contains nearly 10 billion data, covering all financial markets. The data about international futures crude oil prices is from daily closing price of crude oil on West Texas Intermediate Futures which ID is EMI00010839. The data about China Manufacturing Index’s ID is 811003.EI and the United States Dow Jones Manufacturing Index’s ID is DJIA.GI which is published by S&P Dow Jones Indices LLC. All of those data are available from three months before the start of the Russian-Ukrainian conflict to June 16,2022. Data from different time periods can clearly compare the impact of the Russia-Ukrainian conflict on crude oil prices and the impact on manufacturing in different countries.
2.2 Unit root test
\( {x_{t}}={c_{t}}+β{x_{t-1}}+\sum _{i-1}^{p-1}{ϕ_{i}}Δ{x_{t-i}}+{e_{t}} \) | (1) |
The Unit root test is named as Augmented Dickey-Fuller test which is also abbreviated as ADF test. The purpose of the ADF test is to test whether the sequence has a unit root, that is, whether it is stationary. If the sequence is stable, there is no unit root; Otherwise, there will be a unit root. The formula for the ADF test is expressed as (1) and its null hypothesis is \( {H_{0}}:β=1 \) which means there is a unit root, ADF test’s alternative hypothesis is \( {H_{1}}:β \lt 1 \) . Reject the null hypothesis when \( ADF=\frac{\hat{β}-1}{\hat{β} stanard deviation} \) is too large. According to the Table 1 about the ADF Test if p-value is too small the null hypothesis will be rejected which means that the time series is unstable.
Table 1. ADF test
Variables | t-statistic | p-value |
Price | ||
Crude oil | -2.970 | 0.1407 |
DJI | -2.248 | 0.4627 |
Manufacturing, China | -0.942 | 0.9514 |
Yield | ||
Crude oil | -9.050 | 0.0000*** |
DJI | -8.159 | 0.0000*** |
Manufacturing, China | -7.854 | 0.0000*** |
2.3 VAR model specification
Vector Auto Regression model, or VAR model for short, is a model of unstructured equations, proposed by Sims in 1980. Suppose there are two time series variables \( \lbrace {y_{1t}} , {y_{2t, }} {y_{3t}}\rbrace \) in this research \( {y_{1t}} \) is logarithmic yields on China's manufacturing sector and \( {y_{2t}} \) is logarithmic yields on United States’ manufacturing sector and the \( {y_{3t}} \) is international futures crude oil prices. The explanatory variable is the p-order lag value of these two variables and those contribute a binary VAR(p) system which will be shown as (2).
Also { \( {ε_{1t}} \) } and { \( {ε_{2t}} \) } are white noise processes and there is no auto correlation, but contemporaneous correlation is allowed between the perturbation terms of the two equations which is shown as (3).
\( \begin{cases} \begin{array}{c} {y_{1t}}={β_{10}}+{β_{11}}{y_{1,t-1}}+...+{β_{1p}}{y_{t-p}}+{γ_{11}}{y_{2,t-1}}+...+{γ_{1p}}{y_{2,t-p}}+{ε_{1t}} \\ {y_{2t}}={β_{20}}+{β_{21}}{y_{1,t-1}}+...+{β_{2p}}{y_{t-p}}+{γ_{21}}{y_{2,t-1}}+...+{γ_{2p}}{y_{2,t-p}}+{ε_{2t}} \\ {y_{3t}}={β_{30}}+{β_{31}}{y_{1,t-1}}+...+{β_{3p}}{y_{t-p}}+{γ_{31}}{y_{3,t-1}}+...+{γ_{3p}}{y_{3,t-p}}+{ε_{3t}} \end{array} \end{cases} \) | (2) |
\( cov({ε_{1t}} ,{ε_{2t}})=\begin{cases} \begin{array}{c} {σ_{12}} , if t=s \\ 0, others \end{array} \end{cases} \) | (3) |
2.4 ARMA-GARCH model specification
The full name of the ARMA model is Auto-regressive Moving Average, if the time series \( {r_{t}} \) is a linear function of its current and previous period random error terms and previous values, then it can be expressed as \( {r_{t}}={ϕ_{0}}+\sum _{i=1}^{p}{ϕ_{i}}{r_{t-i}}+{ε_{t}}-\sum _{i=1}^{q}{θ_{i}}{ε_{t-i}} \) . Bollerslev proposed the GARCH model on the basis of the ARCH(p) model, which allowed the band estimation parameters to be reduced and the prediction of future conditional variances to be more accurate. The GARCH model is based on the ARCH model, adding the auto-regressive part of \( σ_{t}^{2} \) which is also a function of \( \lbrace σ_{t-1}^{2},...,σ_{t-p}^{2}\rbrace \) . Therefore, the setting of the GARCH model is (4). In order to make sure the \( σ_{t}^{2} \) , \( {α_{0}} \) , \( {α_{1}} \) , \( {γ_{1}} \) are positive \( { ε_{t}} \) needs to satisfy this formula (5). Therefore, the ARMA-GARCH model is expressed as (6). And in this research the futures crude oil logarithmic yield sequence as an exogenous variable.
\( σ_{t}^{2}={α_{0}}+{α_{1}}ε_{t-1}^{2}+...+{α_{q}}ε_{q-1}^{2}+{γ_{1}}σ_{t-1}^{2}+...+{γ_{p}}σ_{p-1}^{2} \) | (4) |
\( {ε_{t}}={v_{t}}\sqrt[]{{α_{0}}+{α_{1}}ε_{t-1}^{2}+{γ_{1}}σ_{t-1}^{2}} \) | (5) |
\( {r_{t}}=C+\sum _{i=1}^{p}{ϕ_{i}}{r_{t-i}}+{ε_{t}}-\sum _{i=1}^{q}{θ_{i}}{ε_{t-i}}+{σ_{t|t-1}}{ε_{t}} \) \( σ_{t|t-1}^{2}=w+\sum _{j=1}^{m}{β_{i}}σ_{t-j|t-j-1}^{2}+\sum _{i=1}^{n}{α_{i}}a_{t-i}^{2} \) | (6) |
3 Experimental results and analysis
3.1 VAR identification
\( LR=-2(LOG{L_{K}}-LOG{L_{K+1}}) \) \( LR~X_{({N^{2}})}^{2} \) Gradually to obey | (7) |
\( {X_{t}}=\sum _{i=1}^{p}{Π_{i}}{X_{t-i}}+{U_{t}} \) | (8) |
Generally, VAR model tests include likelihood ratio, FPE,AIC,HQIC and SBIC. Likelihood ratio test was used in this study which is shown as (7). When LR statistics are less than the critical value, the lag order of VAR model is considered to be moderate. When the LR statistic is greater than the critical value, it is considered that the subsequent order of VAR model is not high enough, and more lagged variables should be added as explanatory variables. When the sample size is not sufficiently large compared with the number of estimated parameters, the finite sample distribution of LR will differ greatly from the asymptotic distribution of LR. According to Table 2, it can be determined that the VAR model of this study is ranked 7th order. As for the stability of the VAR model which shown as (8), if the impact of pulsating impact on the VAR model disappears over time, then the VAR model is stable; otherwise, it is unstable. Similar to AR model, VAR model with unit root is unstable. The necessary and sufficient condition for the stability of VAR model is that all the eigenvalues of coefficient matrix fall in the unit circle. As can be seen from Figure 1, all the points are inside the circle, so the process is smooth.
|
Fig. 1. VAR stability |
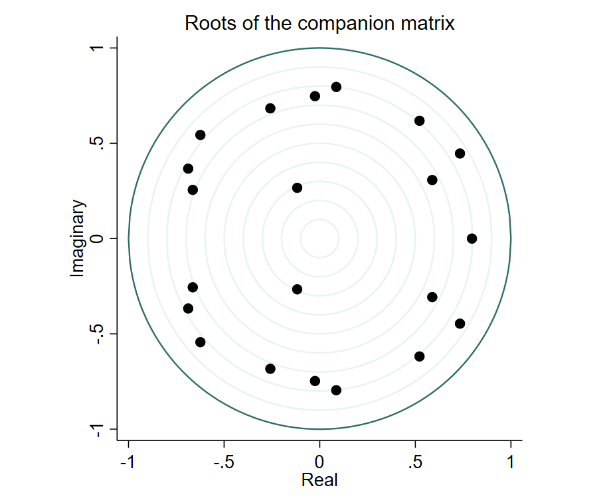
Table 2 VAR model identification
Lag | LL | LR | df | p | FPE | AIC | HQIC | SBIC |
0 | 885.651 | 6.4e-11* | -14.9602* | -14.9316* | -14.8897* | |||
1 | 892.236 | 13.169 | 9 | 0.155 | 6.7e-11 | -14.9193 | -14.8048 | -14.6375 |
2 | 895.838 | 7.2046 | 9 | 0.616 | 7.3e-11 | -14.8278 | -14.6276 | -14.3347 |
3 | 901.622 | 11.567 | 9 | 0.239 | 7.7e-11 | -14.7732 | -14.4872 | -14.0688 |
4 | 908.337 | 13.43 | 9 | 0.144 | 8.0e-11 | -14.7345 | -14.3627 | -13.8188 |
5 | 915.168 | 13.663 | 9 | 0.135 | 8.3e-11 | -14.6978 | -14.2401 | -13.5707 |
6 | 919.064 | 7.7916 | 9 | 0.555 | 9.1e-11 | -14.6113 | -14.0678 | -13.2729 |
7 | 929.552 | 20.975* | 9 | 0.013 | 8.9e-11 | -14.6365 | -14.0072 | -13.0868 |
8 | 931.982 | 4.86 | 9 | 0.846 | 1.0e-10 | -14.5251 | -13.8101 | -12.7641 |
9 | 940.247 | 16.531 | 9 | 0.057 | 1.0e-10 | -14.5127 | -13.7118 | -12.5403 |
10 | 946.262 | 12.03 | 9 | 0.212 | 1.1e-10 | -14.4621 | -13.5754 | -12.2784 |
11 | 952.896 | 13.268 | 9 | 0.151 | 1.2e-10 | -14.422 | -13.4495 | -12.027 |
12 | 955.444 | 5.0946 | 9 | 0.826 | 1.3e-10 | -14.3126 | -13.2544 | -11.7063 |
3.2 Impulse and response
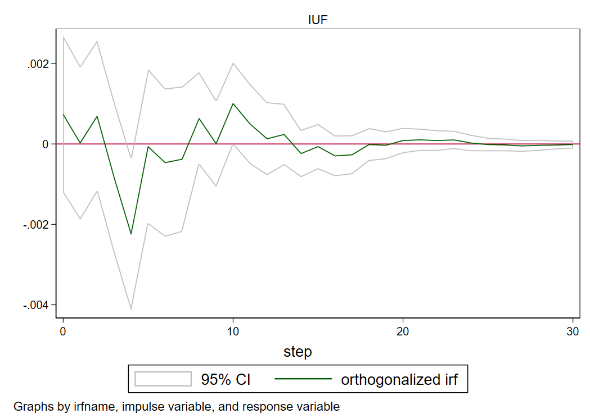
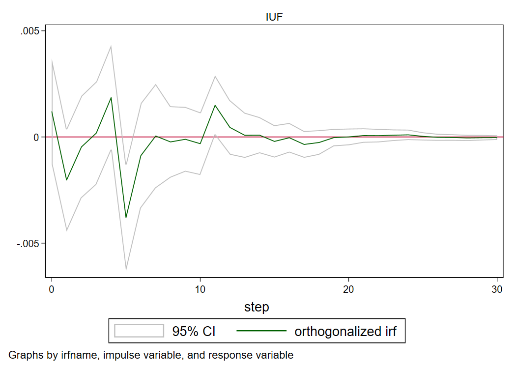
Judging from the estimation of the impulse and response (Figure 2) effect, the increase in crude oil prices caused by the Russian-Ukrainian conflict has a certain impact on both the United States and the Chinese manufacturing industry. Specifically, a 1% increase in crude oil yields will have a volatile effect on Dow Jones yields and Chinese manufacturing yields in the coming period. And the negative effect is greater than the positive effect. In terms of the maximum of negative effects, the Dow Jones index appeared in the 4th period, the size was about -0.2%, and the Chinese manufacturing industry appeared in the 5th period, the size was about -0.4%, and the impact on the yield of China's manufacturing industry was greater than that of the Dow Jones. In terms of time effects, a one-unit oil price shock in the current period will constitute an impact over the next 10 periods, after which the effect gradually disappears over time.
DJI | China |
Fig. 2. Impulse and response | |
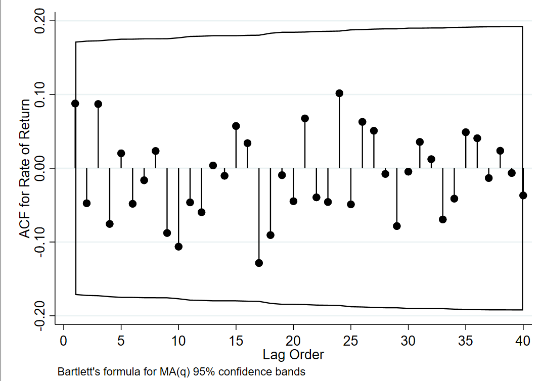
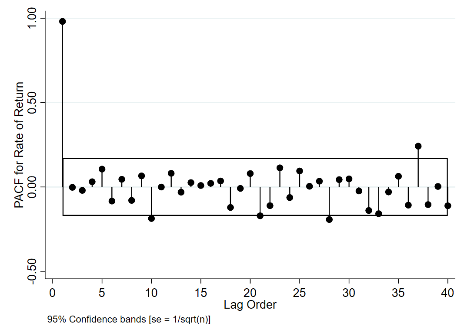
3.3 ARMA Identification
\( {ρ_{k}}=\frac{Cov({x_{t}},{x_{t-k}})}{\sqrt[]{Var({x_{t}})Var({x_{t-k}})}}=\frac{Cov({x_{t}},{x_{t-k}})}{Var({x_{t}})}=\frac{{γ_{k}}}{{γ_{0}}} \) | (9) |
\( {x_{t}}={ϕ_{0.1}}+{ϕ_{1.1}}{x_{t-1}}+{e_{1t}} \) \( {x_{t}}={ϕ_{0.2}}+{ϕ_{1.2}}{x_{t-1}}+{ϕ_{2.2}}{x_{t-2}}+{e_{2t}} \) \( {x_{t}}={ϕ_{0.3}}+{ϕ_{1.3}}{x_{t-1}}+{ϕ_{2.3}}{x_{t-2}}+{ϕ_{3.3}}{x_{t-3}}+{e_{3t}} \) \( {x_{t}}={ϕ_{0.4}}+{ϕ_{1.4}}{x_{t-1}}+{ϕ_{2.4}}{x_{t-2}}+{ϕ_{3.4}}{x_{t-3}}+{ϕ_{4.4}}{x_{t-4}}+{e_{4t}} \) | (10) |
The set \( \lbrace {ρ_{k}}\rbrace \) of auto-correlation coefficients is called the auto-correlation coefficient of \( {x_{t}} \) . The auto-correlation coefficient can be expressed as (9). PACF of stationary time series is a function of ACF, and the expression of PACF is (10). PACF has the following three properties: when sample size T tends to infinity, \( {\hat{ϕ}_{p,p}} \) converges to \( {ϕ_{p}} \) ;for l>p, \( {\hat{ϕ}_{p,p}} \) converges to 0; for l>p, the asymptotic variance of \( {\hat{ϕ}_{p,p}} \) is 1/T. The classification and identification of ARMA mainly adopts EACF model.
|
|
Fig. 3. PACF and ACF, DJI | |
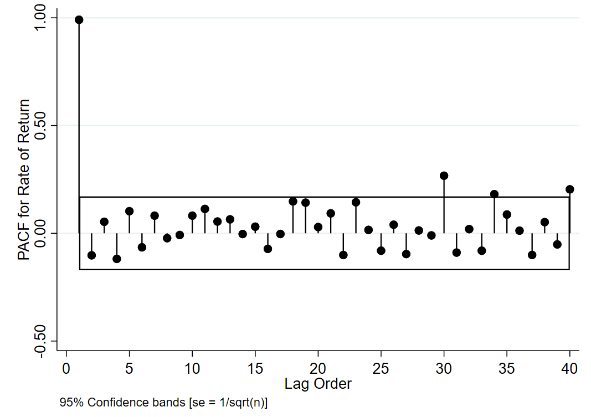
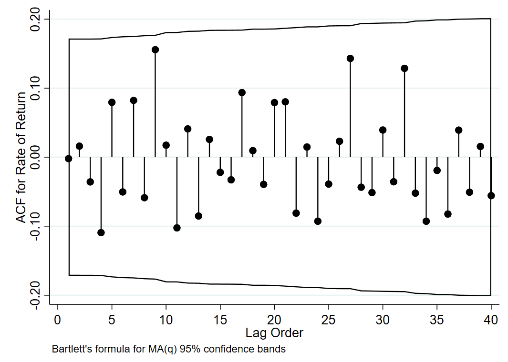
|
|
Fig. 4. PACF and ACF, China’s Manufacturing | |
3.4 ARMA-GARCH Estimated results
From the variance estimation results of the ARMA-GARCH model, the ARCH of the Dow Jones index yield is significant in columns (1) and (2) which indicates that it has a significant ARCH effect. And the first 3 columns of the results of the GARCH term are significant, indicating that the Dow Jones index yield has conditional heteroscedasticity, which can be modeled by GARCH. However, there is no conditional heteroscedasticity in China's manufacturing yields, so the last 3-column model of interpretation is abandoned. From the estimates about the first 3-column model, this study concluded that oil price volatility did not drive the Dow Jones index's daily volatility.
Table 3 ARMA-GARCH estimation results, variance equation
(1) | (2) | (3) | (4) | (5) | (6) | |
DJI | China’s Manufacturing | |||||
Crude oil | ||||||
T=0 | -1.0997*** | -1.1198 | -1.1023 | -8.5861 | -10.6724 | -12.7412* |
(.2533045) | (1.1331) | (67.5344) | (7.3415) | (9.3326) | (6.5461) | |
T=-1 | -0.0876 | 0.3233 | -2.7638 | -2.8741 | ||
(1.1017) | (95.7600) | (9.1934) | (6.1883) | |||
T=-2 | 0.1917 | -1.3677 | ||||
(81.1638) | (6.7129) | |||||
GARCH | ||||||
ARCH (-1) | 0.0825** | 0.1018** | 0.0876 | 0.2025 | 0.1407 | 0.1395 |
(.0393) | (0.0422) | (0.0967) | (0.1529) | (0.1399) | (0.1455) | |
GARCH (-1) | -0.9688*** | -0.9718*** | 0.8581*** | 0.4239 | 0.4382 | 0.1739 |
(0.0222) | (0.0203) | (0.1983) | (0.3773) | (0.4237) | (0.3321) | |
Constant | -8.1482*** | -8.1071*** | -11.6255*** | -9.3302*** | -9.2615*** | -8.7400*** |
0(.1526) | (.1556) | (2.1190) | (.8398) | (0.8983) | (0.5094) | |
4 Discussion
The conclusions of this study are similar to those of the existing literature, both of which also estimate that oil price movements resulting from the Russian-Ukrainian conflict will have a certain volatile impact on Chinese and the United States manufacturing industries. However, this study points out in more detail that changes in crude oil prices will have more negative effects on China and U.S. manufacturing than positive effects. And pointed out the maximum negative effect in China and the United States and indicators, according to the analysis of this indicator, the impact of China's manufacturing yield index will be much greater than the Dow Jones manufacturing yield index, but the impact effect will gradually disappear over time. According to the conclusions of this study, policymakers in various countries should diversify their import and export policies, such as sourcing from different crude oil-producing countries, to deal with the risk of oil price fluctuations due to the Russian-Ukrainian conflict. In addition, efforts should be stepped up to develop new or clean energy sources for use in manufacturing to reduce the impact of oil on manufacturing. For example, by using clean energy such as hydro-power, wind, nuclear, solar energy or renewable energy for manufacturing and production, thereby reducing the dependence on fossil energy sources such as crude oil and coal. In addition to the use of other fuels, policymakers should increase overseas investment, actively participate in the development of overseas crude oil resources, and strengthen the development of oil extraction facilities through international cooperation to reduce the cost of oil imports. According to the research in this paper, investors investing in oil-related manufacturing can use the research conclusions to predict future oil prices, manufacturing investment returns, and make appropriate adjustments to investment in similar international situations. For example, China's manufacturing investors can choose to invest in a variety of countries when purchasing crude oil and other related raw materials, or reduce the proportion of manufacturing industries that invest. For the United States’ manufacturing investors, they can reduce their investment when oil prices are the most volatile to reduce investment risk and increase investment again after the price stabilizes.
5 Conclusion
Through the five research methods of ADF test, VAR model, and ARMA-GARCH model, the study concluded that under the international situation of the Russian-Ukrainian conflict which made oil price changes have a negative impact on the yield of Chinese and the United States’ manufacturing industries. What is more, the negative impact of oil price changes on China's manufacturing industry is much greater than the impact on the United States Dow Jones manufacturing industry. And the impact on the United States’ manufacturing yields is relatively short-lived than China’s, and after a period of time, it will gradually disappear. By analyzing this research, it can be used as a reference for future investors and policy makers to make planning. For policy makers, more attention should be paid to cooperation with international oil exploration enterprises to reduce risks through diversified import and export investment. Investors should use the research results to predict the future trend of crude oil market in order to reduce or stop investing in crude oil which is related to manufacturing industries in order to reduce investment losses caused by changes in the international situation.
References
[1]. BP Statistic Review of World Energy 2022, https://www.bp.com/content/dam/bp/business-sites/en/global/corporate/pdfs/energy-economics/statistical-review/bp-stats-review-2022-full-report.pdf,last accessed 2022/6/1
[2]. L. Lu, Y. Lei, G. Che.: Analysis of international oil price, economic growth and domestic oil consumption change. Resources and Industry 14(3),16-23(2012).
[3]. W. Li, Z. Wei.: The transformation and upgrading of China's petroleum equipment manufacturing industry under the background of low oil price is based on the perspective of technology marketing. The Petroleum Science and Technology Forum 35(2), 29-32(2016).
[4]. X. Li, Y. Xu, X. Xiao.: The evolution trend of the international oil trade pattern and China's response under the background of the conflict between Russia and Ukraine. International Economic Cooperation (03),10-18(2022).
[5]. EIA, https://www.greencarcongress.com/2022/05/20220511-eia.html, last accessed 2022/05/20
[6]. L. Yu.: The U. S. oil industry production growth is weak. China Electric Power News (003),(2022)
[7]. L. Mo.: The conflict between Russia and Ukraine affects international oil prices. Financial Times (008),(2022).
[8]. R. Zhang.: The choice of "decoupling" of energy and cost estimation between the EU and Russia. Decision making and information (06),79-86(2022).
[9]. H. Shi, Y. Yang.: Recent international oil price review and forecast. International oil economy30(05),109-112(2022).
[10]. X. Yi, X. Li, B. Sheng, H. Yang, B. Cao, P. Xu.: The influence of the Russia-Ukraine conflict on the international economic and trade pattern. International Economic Review (03),9-37+4(2022).
Cite this article
Zhang,Y. (2023). The Impact of Changes in Crude Oil price on the Yield and Volatility of Manufacturing: Evidence from the US and China. Advances in Economics, Management and Political Sciences,4,408-417.
Data availability
The datasets used and/or analyzed during the current study will be available from the authors upon reasonable request.
Disclaimer/Publisher's Note
The statements, opinions and data contained in all publications are solely those of the individual author(s) and contributor(s) and not of EWA Publishing and/or the editor(s). EWA Publishing and/or the editor(s) disclaim responsibility for any injury to people or property resulting from any ideas, methods, instructions or products referred to in the content.
About volume
Volume title: Proceedings of the 6th International Conference on Economic Management and Green Development (ICEMGD 2022), Part Ⅱ
© 2024 by the author(s). Licensee EWA Publishing, Oxford, UK. This article is an open access article distributed under the terms and
conditions of the Creative Commons Attribution (CC BY) license. Authors who
publish this series agree to the following terms:
1. Authors retain copyright and grant the series right of first publication with the work simultaneously licensed under a Creative Commons
Attribution License that allows others to share the work with an acknowledgment of the work's authorship and initial publication in this
series.
2. Authors are able to enter into separate, additional contractual arrangements for the non-exclusive distribution of the series's published
version of the work (e.g., post it to an institutional repository or publish it in a book), with an acknowledgment of its initial
publication in this series.
3. Authors are permitted and encouraged to post their work online (e.g., in institutional repositories or on their website) prior to and
during the submission process, as it can lead to productive exchanges, as well as earlier and greater citation of published work (See
Open access policy for details).
References
[1]. BP Statistic Review of World Energy 2022, https://www.bp.com/content/dam/bp/business-sites/en/global/corporate/pdfs/energy-economics/statistical-review/bp-stats-review-2022-full-report.pdf,last accessed 2022/6/1
[2]. L. Lu, Y. Lei, G. Che.: Analysis of international oil price, economic growth and domestic oil consumption change. Resources and Industry 14(3),16-23(2012).
[3]. W. Li, Z. Wei.: The transformation and upgrading of China's petroleum equipment manufacturing industry under the background of low oil price is based on the perspective of technology marketing. The Petroleum Science and Technology Forum 35(2), 29-32(2016).
[4]. X. Li, Y. Xu, X. Xiao.: The evolution trend of the international oil trade pattern and China's response under the background of the conflict between Russia and Ukraine. International Economic Cooperation (03),10-18(2022).
[5]. EIA, https://www.greencarcongress.com/2022/05/20220511-eia.html, last accessed 2022/05/20
[6]. L. Yu.: The U. S. oil industry production growth is weak. China Electric Power News (003),(2022)
[7]. L. Mo.: The conflict between Russia and Ukraine affects international oil prices. Financial Times (008),(2022).
[8]. R. Zhang.: The choice of "decoupling" of energy and cost estimation between the EU and Russia. Decision making and information (06),79-86(2022).
[9]. H. Shi, Y. Yang.: Recent international oil price review and forecast. International oil economy30(05),109-112(2022).
[10]. X. Yi, X. Li, B. Sheng, H. Yang, B. Cao, P. Xu.: The influence of the Russia-Ukraine conflict on the international economic and trade pattern. International Economic Review (03),9-37+4(2022).