


1. Introduction
The 2008 global financial crisis has caused countless companies go bankrupt and tons of people lose their jobs. In the United States, the 2008 financial crisis was accompanied by bank failures and government bank bailouts (nationalization and equity injections), and was the worst recession in the United States since the 1930s [1]. Even the most recently, during the COVID-19 global pandemic, uncountable number of civilians in the United States has lost their jobs due to various different reasons, which eventually led to another unemployment frenzy in the history of the United States. For example, the rate of unemployment reached its maximum at 13% in the second quarter of 2020 and is the highest quarterly average in more than 70 years. The unemployment most affected by lockdown restrictions is in a number of sectors of the economy, including leisure, education, construction and government [2]. This paper is designated to analyze the U.S. unemployment rate from 2000 to 2023. Most importantly, this paper will excavate possible influencing factors that affect the unemployment rate and seek to determine the factor that has the most significant impact on the unemployment rate.
The monthly data of the general unemployment rate in the United States starting from January 1st, 2000, to July 1st, 2023, the monthly data of the rate of unemployment of men in the United States and the rate of unemployment of women in the United States are used in this paper and come from the publicly available information. The crude oil price from the year 2000 to 2023, the total college enrollment from the year 2000 to 2020 and that from the year 2021 to 2023, the U.S gross domestic product records from the year 2000 to 2022, the forecast U.S gross domestic product of the year 2023, and the data of the minimum wage records from the year 2000 to 2023 are also employed in this paper and they are all acquired from the publicly available information.
The multivariate linear regression model has been applied to study the effects of multiple factors, including crude oil price, college enrollment, gross domestic product, and minimum wages, on the unemployment rate in the United States within the time period of 2000 to 2023, and thereby determine the most influential factor.
The advantages of using the linear regression as our analyzing approach are evident: its intuitiveness helps to easily find the influential factors and interpret them without much complexity; confidence interval and hypothesis test can be further constructed to find which factor has significant effect on the U.S unemployment rate; robust standard errors can be built to check the reliability and accuracy of the estimates, and therefore conclude sound and reasonable statistical inference results.
The structure of this paper is as followed:this paper first starts with a general overview of the U.S. rate of unemployment from 2000 to 2023. Next, a multivariate regression model is generated based on the above aforementioned data resources to perform the regression analysis and determine the influencing factors of the rate of unemployment in the U.S.. The rest of this paper performs further analysis on the possible influencing factors. Arguments and evidence are gathered from articles and documents.
2. Analysis on the Recent Unemployment Rate in the United States
2.1. A General Overview
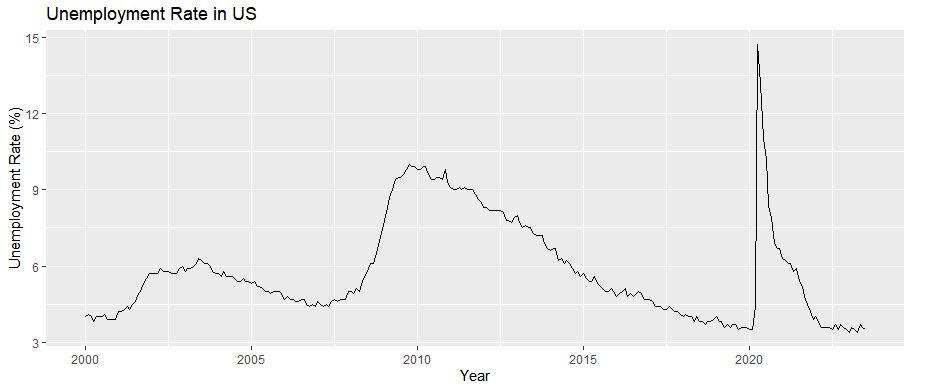
Figure 1: Monthly Unemployment Rate in U.S. from 2000 to 2023.
The above line chart records the monthly data of the rate of unemployment in the United States from January 1st, 2000, to July 1st, 2023. From this line chart, it is clear that the U.S. rate of unemployment experienced two sharp increases and two large declines in the history. Since the day of January 1st, 2000, with an unemployment rate of 4.0%, the U.S. rate of unemployment has experienced a continuous increase, and this increasing trend did not end until June 2003, with a local maximum rate of 6.3%. Since then, the unemployment rate has shown sign of decline from June 2003 with a rate of 6.3% down to May 2007 with a rate of 4.4%. What is worth noting is that, since the time May 2007, the unemployment rate in the United States has gone through a sharp increase that lasted for 3 years. But what comes closely afterwards was a long, but relatively steady, downward trend for 11 consecutive years, with a local minimum rate of 3.5%. In February 2020, another even sharper increase has occurred. The unemployment rate has grown from 3.5% up to a global maximum of 14.7%(Figure1). The outgrowth of this number is terrifying, indicating a terrible time back then. Fortunately to US people, this time the sharp increase only lasted for two months, from February 2020 to April 2020. After that dark ages, the unemployment rate quickly dropped down to lower level. Since March 2022, with an unemployment rate of roughly 3.6%, the U.S. rate of unemployment has remained relatively flat and steady until July 2023, the end time of the data records.
2.2. Men’s Unemployment Rate in U.S. vs Women’s Unemployment Rate in U.S.

Figure 2: Monthly Unemployment Rate of Men in U.S. from 2000 to 2023.
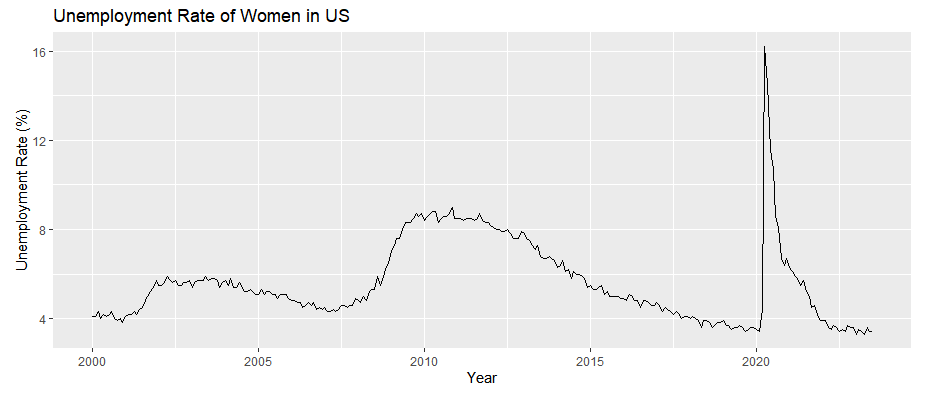
Figure 3: Monthly Unemployment Rate of Women in U.S. from 2000 to 2023.
As in Figure2, the two figures above are the monthly data of the U.S. rate of unemployment of (upper one) and the U.S. rate of unemployment of women (lower one) correspondingly. Obviously, the shape of two line graphs are very similar. However, discrepancies do exist between the two. To begin with, the unemployment rate of women during the period 2002 to 2006 remained relatively steady, while the unemployment rate of men during that same period experienced a spike in the middle of the year 2003. Secondly, during the period of 2008 to 2010, both the unemployment rate of men and that of women experienced sharp increase. It is not hard to notice that the unemployment rate of men, which was roughly 11.0%, was much higher than that of women, which was at around 8.4%, at the beginning of the year 2010. This property was reversed in the year 2020: the unemployment rate of men acquired its global maximum in April 2020 with a rate of 13.5%; the unemployment rate of women obtained its global maximum in the same month, April 2020, but with a horrifying rate of 16.2%. Just as Figure3 shows that according to the article named Effects of the COVID-19 Recession on the US Labor Market: Occupation, Family, and Gender written by Stefania Albanesi and Jiyeon Kim in 2021, much fewer women, especially those with children, were employed than men in the year 2020 [3]. This somehow validates the previous observation that the U.S. rate of unemployment of women in year 2020 was much higher that that of men. Last but not least, after these extreme spikes, the unemployment rates of both the men and the women have eventually fell. Besides, both rates have fluctuated around the level of 3.5% in the year 2022 and 2023 (now).
2.3. Issues that US Job Market Currently Faces
The current job market of the United States still faces vast serious problems. As Meng Liu pointed out in The Paper on February 19, 2023, the labor gap has clearly widened and has structural characteristics. Meng Liu also pointed out that most of the increments and increases in job vacancies in the service sector were higher than in the non-service sector. Overall, the number of job openings in all industries in the United States has increased from pre-pandemic levels, and there were labor shortages in all industries, but the shortage of contact services was particularly serious, and the structural characteristics of labor shortages were more pronounced. The asymmetric recovery after the pandemic has led to structural differences in the recovery of labor demand. Non-farm payrolls decreased by 21.28 million in April 2022 compared to December 2019, and non-farm payrolls decreased by 9.292 million in 2020 compared to 2021. A combination of factors has led to a slowdown in labor supply growth. Meng Liu suggested three main factors contributing to the labor supply gap in the United States: a significant increase in the number of early retirements, excess deaths due to the corona-virus pandemic, and tighter immigration policies as well as the corona-virus pandemic that has led to a significant drop in the number of immigrants. Finally, Meng Liu stated that in the long run, the Beveridge curve in the United States has shifted structurally to the right after the 2008 financial crisis, and the problem of labor market dislocation has existed for a long time since 2008. After the COVID-19 global pandemic, the curve has shifted sharply to the right again, making it much more difficult to balance the demand and the supply in the labor market. The structure of the demand and the supply in the labor market has also changed permanently [4].
3. Multivariate Regression on the U.S. Rate of Unemployment
A multivariate regression model has been constructed to analyze the effect of four factors on the U.S. rate of unemployment from 2000 to 2023. The response variable, “Un_rate”, is the rate of unemployment in the United States from 2000 to 2023, and the independent variables are the “Crude_Oil_Price”, “Total_College_Enrollment”, “GDP”, and the “Minimum_Wages”. Together, they compose this multivariate regression model. “Un_rate” is the yearly data of the U.S. rate of unemployment from year 2000 to year 2023, which was acquired by taking the average of the 12 monthly data of the U.S. rate of unemployment from year 2000 to year 2023 used previously. “Crude_Oil_Price” stands for the yearly data of the average closing price in dollars of the crude oil from year 2000 to year 2023. “Total_College_Enrollment” stands for the yearly data of the total undergraduate and graduate enrollment combined in the United States from year 2000 to year 2023, where the data of the year 2022 and the data of 2023 are forecasts. “GDP” stands for the yearly data of the Gross Domestic Product in billion dollars in the U.S. from year 2000 to year 2023, where the data of the year 2023 is forecast. “Minimum_Wages” is the yearly data of the federal minimum wages in dollars per hour in the United States from year 2000 to year 2023.
Table 1: Result of the Multivariate Regression Model.
Estimate | P-value | |
Crude_Oil_Price | 0.000539 | 0.9731 |
Total_College_Enrollment | 0.0000005047 | 0.3421 |
GDP | -0.0003739 | 0.0045 |
Minimum_Wages | 1.118 | 0.2849 |
Residual Standard Error | 1.283 | |
Adjusted R-squared | 0.5186 | |
In Table1, the result of the above model is interesting. The residual standard error is 1.283. The adjusted R-squared is 0.5186. The coefficient estimates of the four independent variables are 0.000539, 0.0000005047, -0.0003739, and 1.118, respectively. The P-values of the four independent variables indicates the significance of their effects on the U.S. rate of unemployment from year 2000 to year 2023 correspondingly. The P-value of the “Crude_Oil_Price” is 0.9731, a value that is greater than the significance level 0.05. Therefore, based on the observed data, no evidence against the null hypothesis can be made at the 0.05 significance level. In other words, one cannot conclude that the crude oil price from the year 2000 to 2023 has a significant impact on the U.S. rate of unemployment within the same time period. Similar conclusions can be drawn for the “Total_College_Enrollment” and the “Minimum_Wages”, because their P-values, 0.3421 and 0.2849 respectively, are both greater than the significance level 0.05. Hence, based on the observed data, no evidence against the null hypotheses can be made at the 0.05 significance level for both previous two factors. Therefore, one cannot conclude that the total undergraduate and graduate enrollment combined in the United States from year 2000 to year 2023 and the federal minimum wages in the United States from year 2000 to year 2023 have significant impacts on the unemployment rate in the United States within that same time period.
However, it is imperative to mention that the P-value of the “GDP” is 0.0045, a value that is less than the significance level 0.05. Therefore, based on the observed data, strong evidence against the null hypothesis can be made at the 0.05 significance level. This means that it is sound and reasonable to conclude that the Gross Domestic Product in the U.S. from year 2000 to year 2023 has a significant impact on the U.S. rate of unemployment within that same time period.
Table 2: Result of the Robustness Test.
Crude_Oil_Price | 0.01764085 |
Total_College_Enrollment | 0.0000003745769 |
GDP | 0.00007619287 |
Minimum_Wages | 0.6379695 |
In table2, for the robust standard error, the robust standard error under the “Crude_Oil_Price”, which stands for the effect of one unit change on the average closing price in dollars of the crude oil on the unemployment rate, is 0.01764085, which is small enough to suggest very low uncertainty in the estimated coefficients in the model and strong reliability. Again, similar conclusions can be drawn for the factors “Total_College_Enrollment” and “GDP”. The robust standard error under the “Total_College_Enrollment”, which is 0.0000003745769, stands for the effect of one unit change on the total undergraduate and graduate enrollment combined in the United States on the unemployment rate, and the robust standard error under the “GDP”, which is 0.00007619287, stands for the effect of one unit change on the Gross Domestic Product in billion dollars in the U.S. on the unemployment rate. They are both small enough to suggest very low uncertainty in their estimates correspondingly and strong reliability. Nevertheless, the robust standard error under the “Minimum_Wages”, which stands for the effect of one unit change on the federal minimum wages in dollars per hour in the U.S. on the unemployment rate, is 0.6379695. This time the robust standard error is not relatively small, suggesting possible high uncertainty in the estimated coefficients in the model and less reliability.
4. Analysis of Factors Affecting the Unemployment Rate in the United States
In the article named Oil price shocks and US unemployment: evidence from disentangling the duration of unemployment spells in the labor market written by Zeina Alsalman in the year 2023, Zeina Alsalman applied the structure VAR model to determine the correlation between the oil price and the unemployment in the United States. Their study indicated clear results: there was a strong heterogeneity in the result at both the aggregate and the disaggregate unemployment duration. The recessionary effect was manifested by a significant increase in unemployment and the overall duration of unemployment as a result of adverse oil supply shocks [5]. Zeina Alsalman noted that this heterogeneity aforementioned also appeared in response to the demand shock in particular for oil. On one hand, it has resulted that the accumulation of overall unemployment index responses became mild and trivial to a large extent. On the other hand, it increased unemployment in the short term temporarily but did not have a statistically significant impact on unemployment in the long term, as manifested by a temporary decline in the unemployed number between 5 and 26 weeks [5]. He has also noted that during the oil-price spike between 2003 to 2008, the Great Recession, and the oil-price stable period of 2010-2014, shocks of aggregate demand played the most important role in affecting the duration of unemployment” [5].
Looking from a different angle, the article named Effect of monetary policy shocks on the racial unemployment rates in the US written by Hamza Bennani in the year 2023, Hamza Bennani analyzed how the monetary policy might shift the U.S. rate of unemployment of different races. Hamza Bennani found that when monetary contraction occurs, the reduction in demand for labor is going to produce a greater impact on the employment prospect of workers who have less skills than workers who have more skills [6]. Therefore, given Hispanic and African American workers have lower average skills than white workers, these people have higher possibilities to be influenced by the Federal Reserve monetary policy shocks [6]. Most importantly, Hamza Bennani pointed that minorities are those who are much more likely than the white workers to be fired after the economic recession [6]. Bennani then gave specific examples to further illustrate this sentence: for example, the black coefficient is as high as 1.8 [6]. This means that for every unit increase in the percentage of overall rate of unemployment in the United States, the corresponding rate of unemployment of the black will increase by 1.8 percentage points [6]. While the coefficient was 1.4 for Hispanic workers, for whites, the coefficient is just 0.9 [6]. It can be easily concluded that the unemployment can be significantly affected by the monetary policy and the extent is so large that it cannot be ignored. Specifically, the rate of unemployment of the black is a good response variable to expansionary monetary policy shocks because it is the most sensitive to their response. By contrast, however, how exactly the Hispanic unemployment responded to the shock of expansionary monetary policy is uncertain [6].
One factor which affects the U.S. rate of unemployment that people often overlook because it is too rife but actually extremely important is the uncountable amount of undergraduates from college. They will quickly fill up some small gaps in the labour market once they graduate and enter the market. As Mark D. and Dan S. Rickman pointed, any increase in the proportion of college-educated workers would significantly reduce the national equilibrium unemployment rate [7]. Another necessary factor is the immigrants: an increase in the number of new international immigrants leads to an increase in unemployment, yet this result is generally not statistically significant [7].
In the article named Myth or measurement: What does the new minimum wage research say about minimum wages and job loss in the United States? written by David Neumark and Peter Shirley in the year 2022, they conducted multivariate regressions test to find the elasticity between the employment and the minimum wage [8]. The results they concluded were surprising. They found that the minimum wage actually has a negative impact on the employment of those low-skilled workers. This result may contradict with most people’s commonsense as minimum wage is supposed to reduce the unemployment, but the obvious evidence is the workers who are affected directly , and it is real and compelling [8].
Another important factor that keeps stimulating the growth of the U.S. rate of unemployment is that the recovery of the housing market is still lacking and its ability to absorb employment is insufficient. Because the real estate industry is characterized by a long chain and numerous upstream and downstream industries, one of the important industries to attract employment is the real estate industry, and this conclusion also applies to the United States. But the U.S. housing market remains depressed, with two indicators of employment best reflected in the housing sector — new home sales and new private housing starts — both falling sharply. This shows that confidence in the US housing market is still very fragile, and the depression in the housing market has already resulted in an increase in the number of the unemployed in this industry.[9]
Finally, in the article named A High-Resolution Lead-Lag Analysis of US GDP, Employment, and Unemployment 1977–2021: Okun’s Law and the Puzzle of Jobless Recovery written by Knut Lehre Seip and Dan Zhang in the year 2022, they tried to analyze the correlation between the GDP and the unemployment rate in the United State. They stated that hiring workers during boom times may lead to a subsequent jobless recovery, and their findings on the pre-recession emerging-market dominance of GDP and declining labor productivity confirm this suggestion [10]. Also, in order to ease the unemployment recovery, hiring decisions should be cautious when there are signs that a decision is imminent or labor productivity is abnormal [10].
5. Conclusion
The aforementioned articles imply that oil price, the college enrollment, the minimum wage, and the gross domestic product all play roles in affecting the unemployment in the United States.
However, through the results of above multivariate regression analysis, it is easy to observe that the gross domestic product has a much more significant impact on the rate of unemployment than the other three factors. Besides these four influencing factors, the monetary policy is also able to influence the racial unemployment in the United States. Moreover, housing market is always closely related to the U.S. rate of unemployment: the surge in the rate of unemployment is most likely the symbol of a depression to the real estate market [9].
5.1. Limitation
The above multivariate regression model has some limits. First of all, only four independent variables are considered and analyzed. Furthermore, the database for the total college enrollment may not perfectly epitomize as the number of college student who enter the labor market after their graduations, because one has to consider the possibility that students drop out of the school due to multiple reasons instead of successfully graduate and the possibility that graduates do not choose to work immediately after their graduations. Future studies could expand on the independent variables used in the multivariate regression model and use the total number of graduates who choose to enter the labor market after their graduation instead of the total enrollment number.
References
[1]. Bordo, M.D., Redish, A. and Rockoff, H. (2015), Why Didn't Canada Have a Banking Crisis?. The Economic History Review, 68: 218-243.
[2]. Ma, M., Orsi, R., & Brooks-Russell, A. (2023). Is Household Unemployment Associated With Increased Verbal and Physical Child Abuse During the COVID Pandemic? Child Maltreatment, 28(1), 7–12.
[3]. Albanesi, Stefania, and Jiyeon Kim. “Effects of the COVID-19 Recession on the US Labor Market: Occupation, Family, and Gender.” The Journal of Economic Perspectives, vol. 35, no. 3, 2021, pp. 3–24. JSTOR.
[4]. Meng Liu. The structural problems in the US labor market are difficult to alleviate in the short term. The Paper. 2023-02-19 11:35.
[5]. Alsalman, Z. Oil price shocks and US unemployment: evidence from disentangling the duration of unemployment spells in the labor market. Empir Econ 65, 479–511 (2023).
[6]. Hamza Bennani. Effect of monetary policy shocks on the racial unemployment rates in the US. Economic Systems,Volume 47, Issue 1, 2023, 101058, ISSN 0939-3625.
[7]. Partridge, Mark D., and Dan S. Rickman. “The Dispersion of US State Unemployment Rates: The Role of Market and Non-Market Equilibrium Factors.” Regional Studies, vol. 31, no. 6, Aug. 1997, pp. 593–606.
[8]. Neumark, David, and Shirley, Peter. 2022. “Myth or measurement: What does the new minimum wage research say about minimum wages and job loss in the United States?” Industrial Relations 61: 384–417.
[9]. Five factors contribute to the high unemployment rate in the United States. Shanghai Securities News. 2010-08-20 09:19.
[10]. Seip, Knut, and Dan Zhang. “A High-Resolution Lead-Lag Analysis of US GDP, Employment, and Unemployment 1977–2021: Okun’s Law and the Puzzle of Jobless Recovery.” Economies, vol. 10, no. 10, Oct. 2022, p. 260. Crossref.
Cite this article
Kuang,J. (2023). The Culprits That Affect the Unemployment Rate --------Empirical Analysis Based on U.S. Real Data. Advances in Economics, Management and Political Sciences,54,330-337.
Data availability
The datasets used and/or analyzed during the current study will be available from the authors upon reasonable request.
Disclaimer/Publisher's Note
The statements, opinions and data contained in all publications are solely those of the individual author(s) and contributor(s) and not of EWA Publishing and/or the editor(s). EWA Publishing and/or the editor(s) disclaim responsibility for any injury to people or property resulting from any ideas, methods, instructions or products referred to in the content.
About volume
Volume title: Proceedings of the 2nd International Conference on Financial Technology and Business Analysis
© 2024 by the author(s). Licensee EWA Publishing, Oxford, UK. This article is an open access article distributed under the terms and
conditions of the Creative Commons Attribution (CC BY) license. Authors who
publish this series agree to the following terms:
1. Authors retain copyright and grant the series right of first publication with the work simultaneously licensed under a Creative Commons
Attribution License that allows others to share the work with an acknowledgment of the work's authorship and initial publication in this
series.
2. Authors are able to enter into separate, additional contractual arrangements for the non-exclusive distribution of the series's published
version of the work (e.g., post it to an institutional repository or publish it in a book), with an acknowledgment of its initial
publication in this series.
3. Authors are permitted and encouraged to post their work online (e.g., in institutional repositories or on their website) prior to and
during the submission process, as it can lead to productive exchanges, as well as earlier and greater citation of published work (See
Open access policy for details).
References
[1]. Bordo, M.D., Redish, A. and Rockoff, H. (2015), Why Didn't Canada Have a Banking Crisis?. The Economic History Review, 68: 218-243.
[2]. Ma, M., Orsi, R., & Brooks-Russell, A. (2023). Is Household Unemployment Associated With Increased Verbal and Physical Child Abuse During the COVID Pandemic? Child Maltreatment, 28(1), 7–12.
[3]. Albanesi, Stefania, and Jiyeon Kim. “Effects of the COVID-19 Recession on the US Labor Market: Occupation, Family, and Gender.” The Journal of Economic Perspectives, vol. 35, no. 3, 2021, pp. 3–24. JSTOR.
[4]. Meng Liu. The structural problems in the US labor market are difficult to alleviate in the short term. The Paper. 2023-02-19 11:35.
[5]. Alsalman, Z. Oil price shocks and US unemployment: evidence from disentangling the duration of unemployment spells in the labor market. Empir Econ 65, 479–511 (2023).
[6]. Hamza Bennani. Effect of monetary policy shocks on the racial unemployment rates in the US. Economic Systems,Volume 47, Issue 1, 2023, 101058, ISSN 0939-3625.
[7]. Partridge, Mark D., and Dan S. Rickman. “The Dispersion of US State Unemployment Rates: The Role of Market and Non-Market Equilibrium Factors.” Regional Studies, vol. 31, no. 6, Aug. 1997, pp. 593–606.
[8]. Neumark, David, and Shirley, Peter. 2022. “Myth or measurement: What does the new minimum wage research say about minimum wages and job loss in the United States?” Industrial Relations 61: 384–417.
[9]. Five factors contribute to the high unemployment rate in the United States. Shanghai Securities News. 2010-08-20 09:19.
[10]. Seip, Knut, and Dan Zhang. “A High-Resolution Lead-Lag Analysis of US GDP, Employment, and Unemployment 1977–2021: Okun’s Law and the Puzzle of Jobless Recovery.” Economies, vol. 10, no. 10, Oct. 2022, p. 260. Crossref.