


1. Introduction
The Federal Reserve is the central bank of the United States of America, and its primary responsibility is to maintain maximum employment and price stability by regulating monetary policy. By regulating the federal funds rate, it influences market interest rates, which in turn affects the money supply and economic activity. With the outbreak and continuation of the COVID-19, its impact on individual countries has been multifaceted and severe. The pandemic has led to supply chain disruptions, demand recovery and fiscal stimulus of the United States, which contribute to the increase of the consumer index of America, reaching its highest level in four decades. In addition, the inflation rate far exceeding expectations and resulted in severe damage of the economy. Therefore, the Federal Reserve should take some action. For example, raising interest rate to tighten monetary policy to dampen inflationary expectations and actual inflation.
In response to economic pressures in the United States, the Federal Reserve has raised interest rates, which has also pushed up the exchange rate of the dollar. For the yuan, the US dollar appreciated while the yuan depreciated. If the yuan continues to depreciate, it will also bring some impacts and challenges to China. For example, the burden of servicing foreign debts will increase; exports will fall; imports will increase, and financial markets will become unstable. What should be the future trend of the exchange of the United States dollar for the RMB? What will be the impact on China’s economic development if the RMB continues to depreciate? What strategies and recommendations should the Authority of China people make to cope with it? It is very meaningful to discuss these issues.
The thesis is based on information on the USD/CNY exchange rate from 2010 to just before the first Fed rate hike. These data were broken down into three types of time series data that were collected on a daily, weekly, and monthly basis. Each category of data was then utilized to create an artificial control group that was not impacted by the Fed’s interest rate hike. As a result, the impact and outcomes of the Fed rate hike can be examined after comparison with the real exchange rate data set. This study is based on the exchange rate data of the US dollar to the Chinese yuan after 2010, which is divided into daily, weekly and monthly data, and builds an ARIMA model to forecast the future trend of the exchange rate after the Fed’s interest rate hike in the form of a time series.
2. Literature Review
Since the COVID-19 happened in 2020, it has had a profound effect on the world. For the United States, many people lost their jobs because of the outbreak, and some were unable to find work immediately after it ended, causing unemployment rate to soar. Mahmoudi claims the unemployment rate increased from 3.5% in February 2020 to the highest level seen since the 1930s in April 2020, and it peaked at 4.9% in October 2021. For comparison, the employment rate in early 2022 was about 3 million lower than it had been before to the COVID-19 epidemic [1]. The CPI index of the United State continued to rise, reaching a high of 9.1% in June 2022, a figure that was a 40-year high. This is well above the 2% inflation target set by the Federal Reserve and too much inflation can cause serious damage to the economy [2]. Additionally, the Fed initially raised the interest rate on 16 March by 25 basis points and expected the inflation to stabilize by several months later. Then, In Fed Chairman Jerome Powell press remarks, who stated that the rate-setting committee’s main attention in the upcoming months would be on inflation data [3]. Besides, Siegel points out the central bank continued the faster pace of tightening that was started in June on July 27th by increasing its policy rate by an additional 75 basis points. However, The Fed will continue to tighten monetary policy at a faster rate, though, if inflation is higher than presently anticipate [4]. Moreover, Ming suggests the CNY exchange rate movement against the USD has exhibited the characteristics of “consolidation-rapid depreciation-consolidation-rapid depreciation” from the beginning of 2022 until the present. The median price of CNY against the USD decreased from 6.38 to 7.07 between the end of 2021 and September 27, 2022, a decline of 10.9% and the exchange rate for the remaining months of 2022 is assumed to swing between 6.9 and 7.3 [5]. However, Tintin proposes the steep fall of the CNY need not cause the market too much concern. The market is not overly concerned about a sudden drop in the value of the CNY [6]. The Chinese central bank currently has enough policy options to address the CNY exchange rate’s fast decline. On the one hand, the central bank has been stabilizing the currency market by utilizing methods for managing the foreign exchange market. On the other hand, China has undertaken counter-cyclical factors, capital flow control, and macro-prudential management at the level of foreign exchange [7]. Nevertheless, the Fed is having trouble controlling inflation as it becomes clear that changing monetary policy won’t solve all of the economy’s problems. It is not advisable to utilize the cure-all for economic issues repeatedly or excessively [8]. Furthermore, the depreciation of the RMB is not all bad. According to the research of Zhangpeng, it promotes the optimization of the structure of export products [9]. Fluctuations in the exchange rate between the renminbi and the US dollar have led to trade frictions between the US and China, and challenges in the US-China relationship [10].
3. Research Design
3.1. Data Source
This paper collects the data of the exchange rate between USD and CNY from the Investing.com, which is the world’s fourth largest financial information website. A sample of 13 years of data from 2010 was gathered, and the data acquisition was divided into three forms, including daily, weekly, and monthly data. In addition, the exchange rate after announcing the initial increase of the interest rate by Fed was highlighted. These data provide the basis and source for practical analyses of the impact of the Fed’s rate hike on the exchange rate between the RMB and the USD.
3.2. Weak Stationarity Test
The ADF test (unit root test), which determines if the series has a unit root and is smooth or not, is the first stage in implementing the model. After respectively importing the daily, weekly and monthly data into Stata and conducting the ADF test, Table 1 shows that the p-value of three types for the log-prices are zero after diverse order differencing, contradicting the original hypothesis that the model is not smooth. This shows that the model is stable and viable.
As is shown in the Table 1, the difference order (d) of daily test is 1. Besides, weekly and monthly test both have the same difference order (d), which d equals 2.
Table 1: Weak stationarity test.
t | p | |
Daily | ||
Ln price | -2.064 | 0.5664 |
1st order difference | -38.878 | 0.0000 |
Weekly | ||
Ln price | -4.880 | 0.0003 |
1st order difference | -20.561 | 0.0000 |
2nd order difference | -33.023 | 0.0000 |
Monthly | ||
Ln price | -2.249 | 0.4625 |
1st order difference | -7.108 | 0.0000 |
2nd order difference | -13.182 | 0.0000 |
3.3. ARIMA Model
The AR(p) model \( \sum _{i=1}^{p}{∅_{i}}{R_{t-i}} \) , which forecasts the future by using the history exchange rate between the U.S. dollar and the Chinese yuan, is represented by equation (1) above, while equation (1) also shows that \( {α_{i}}-\sum _{i=1}^{q}{∅_{i}}{α_{t-i}} \) , which employs previous volatility to forecast the exchange rate’s future trend.
\( {R_{t}}={∅_{0}}+\sum _{i=1}^{p}{∅_{i}}{R_{t-i}}+{a_{t}}-\sum _{i=1}^{q}{θ_{i}}{a_{t-i}} \) (1)
In this study, the AR model uses historical data on the exchange rate prior to the Fed’s first interest rate increase on March 16 2022 whereas the MA model forecasts the future using an error term.
The ARIMA model is used for forecasting. It is impossible to build an ARMA (p, q) model when the original sequence looks to be unstable, hence differencing should be used instead. The sequence becomes smooth when the difference order is d, at which point the ARMA model can be represented, and at this moment the model is the ARIMA (p, d, q) model.
For daily data, the original series is not smooth. After first order differencing, the unit root test rejects the original hypothesis and then ARMA model can be performed (i.e., ARIMA model). In addition, both weekly and monthly data were differenced twice to ensure that the series were stable so that the ARIMA model could be applied.
This paper sets 16 March, the date of the Fed’s first-rate hike in 2022, as moment zero (T0). This allows us to predict the movement of the exchange rate after a rate hike based on past data.
4. Empirical Findings and Analysis
4.1. Determine the Order
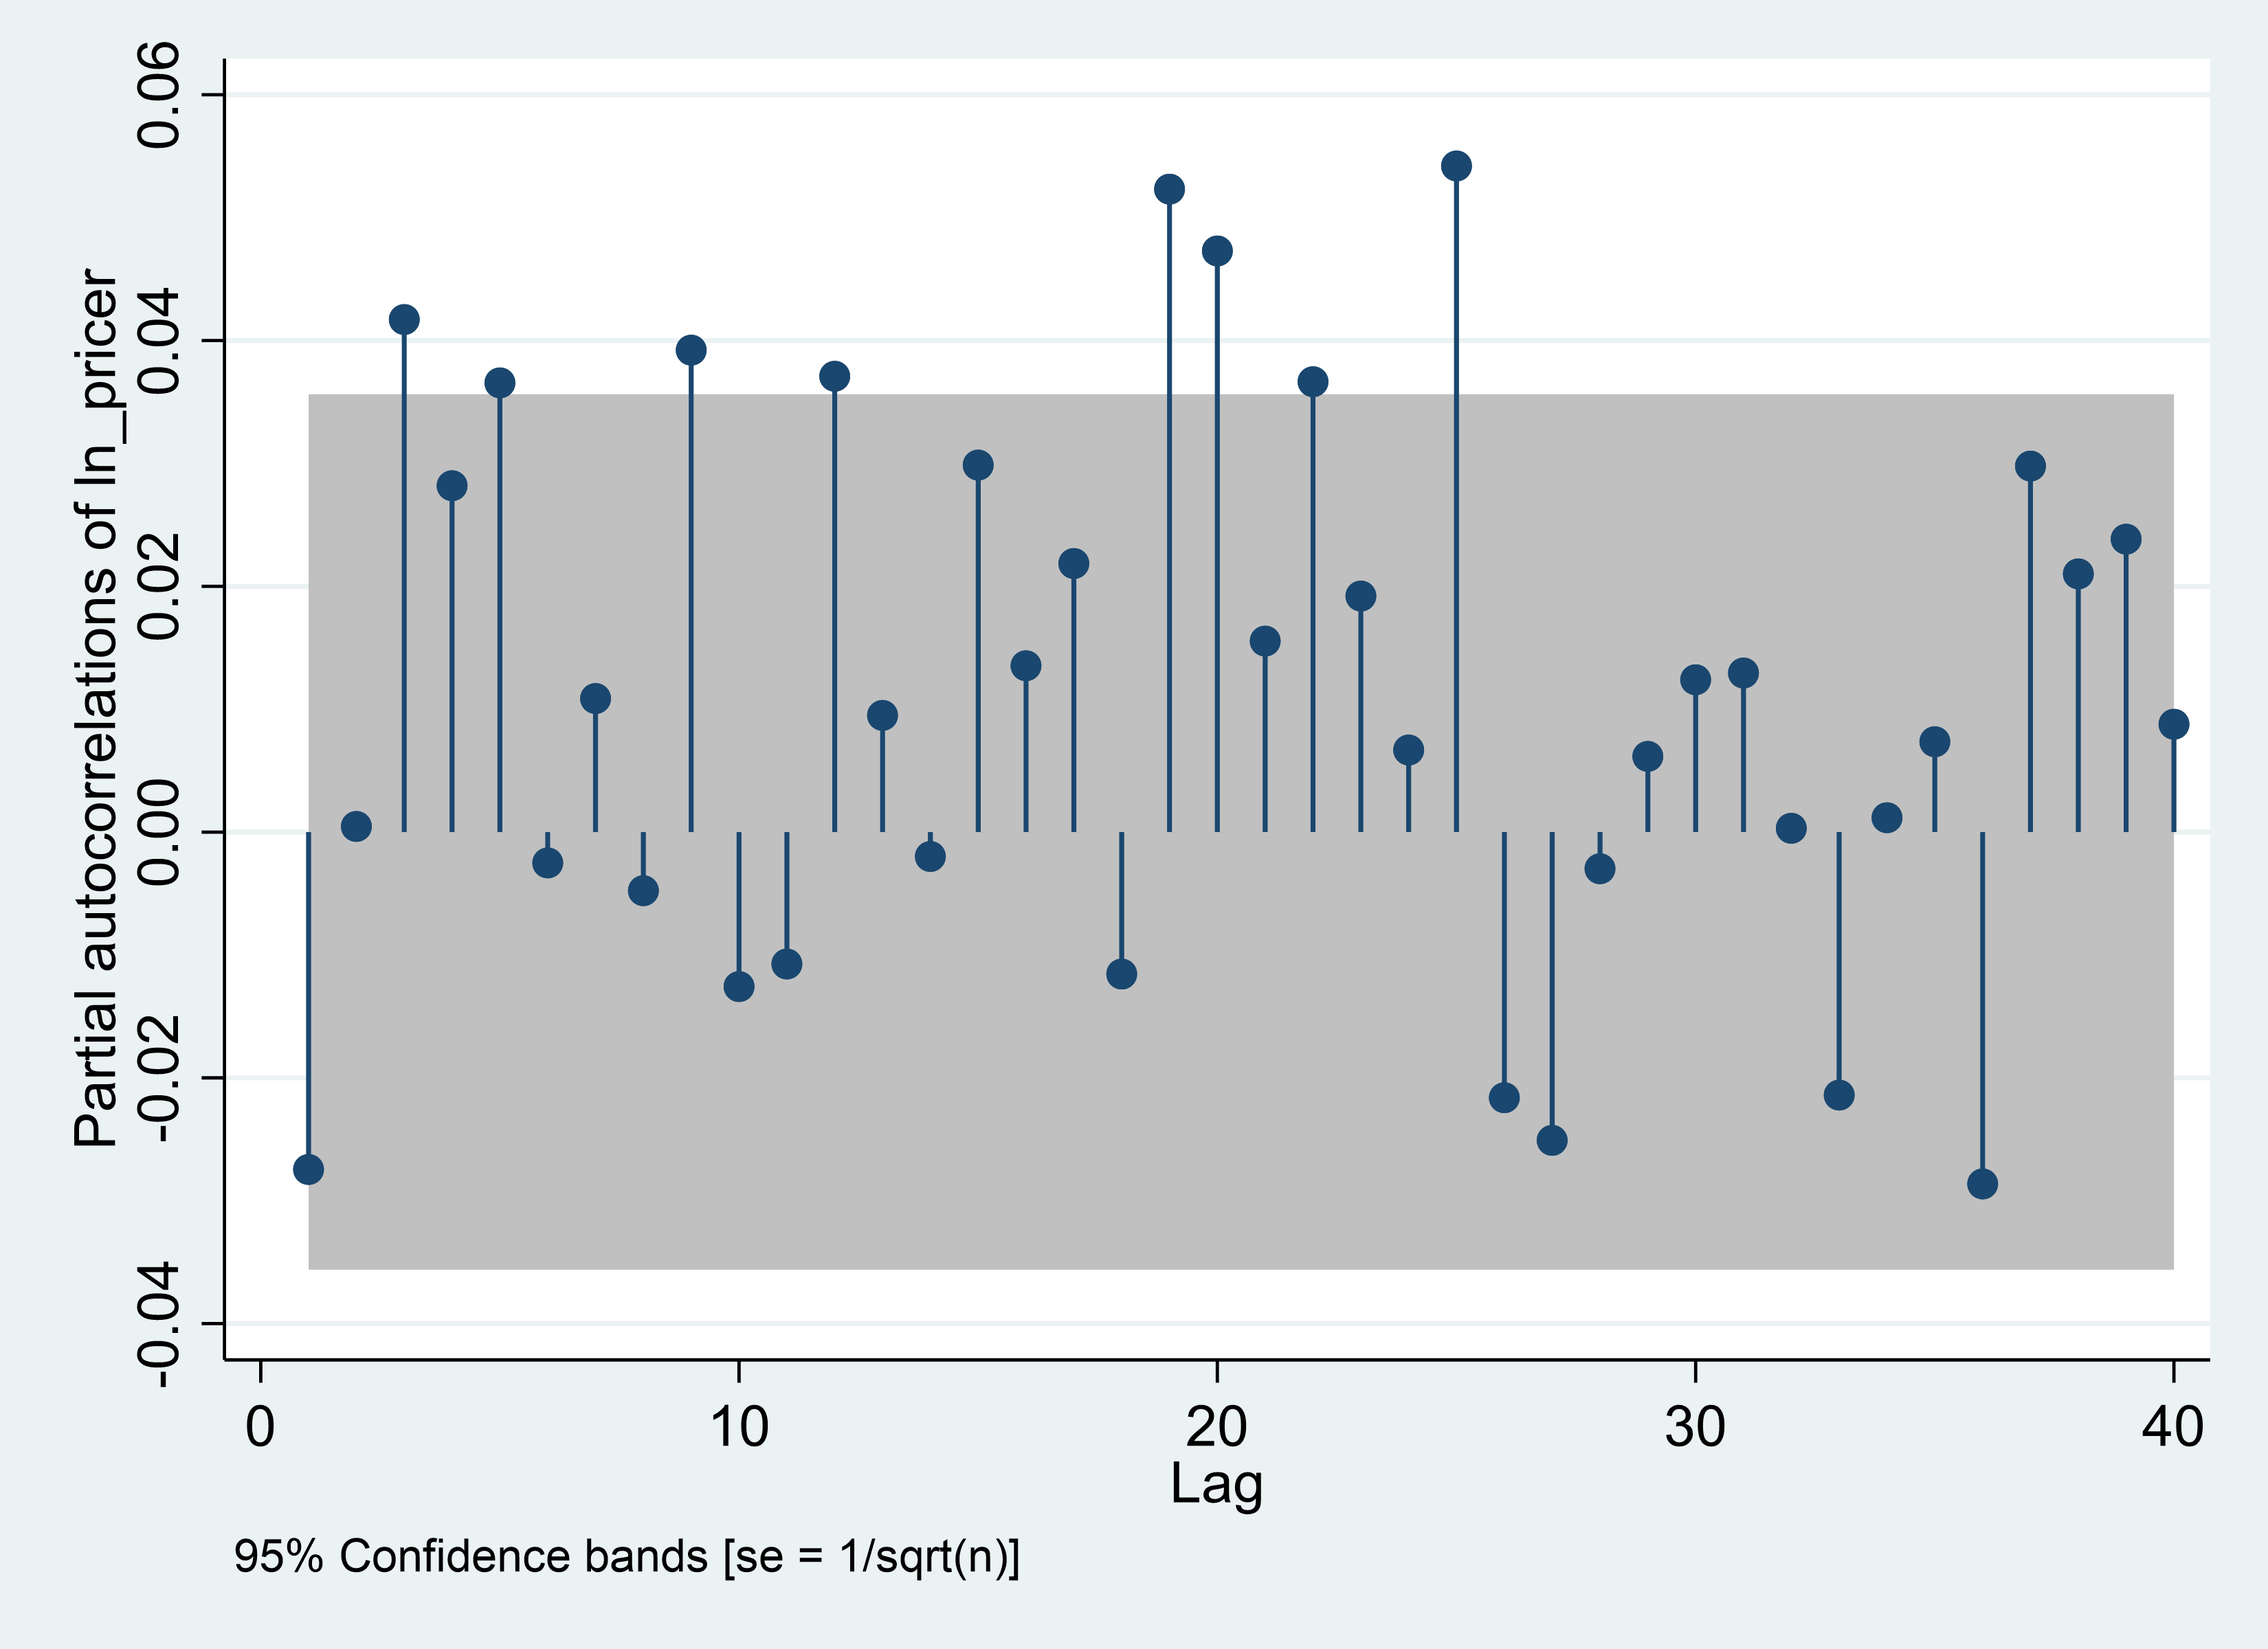
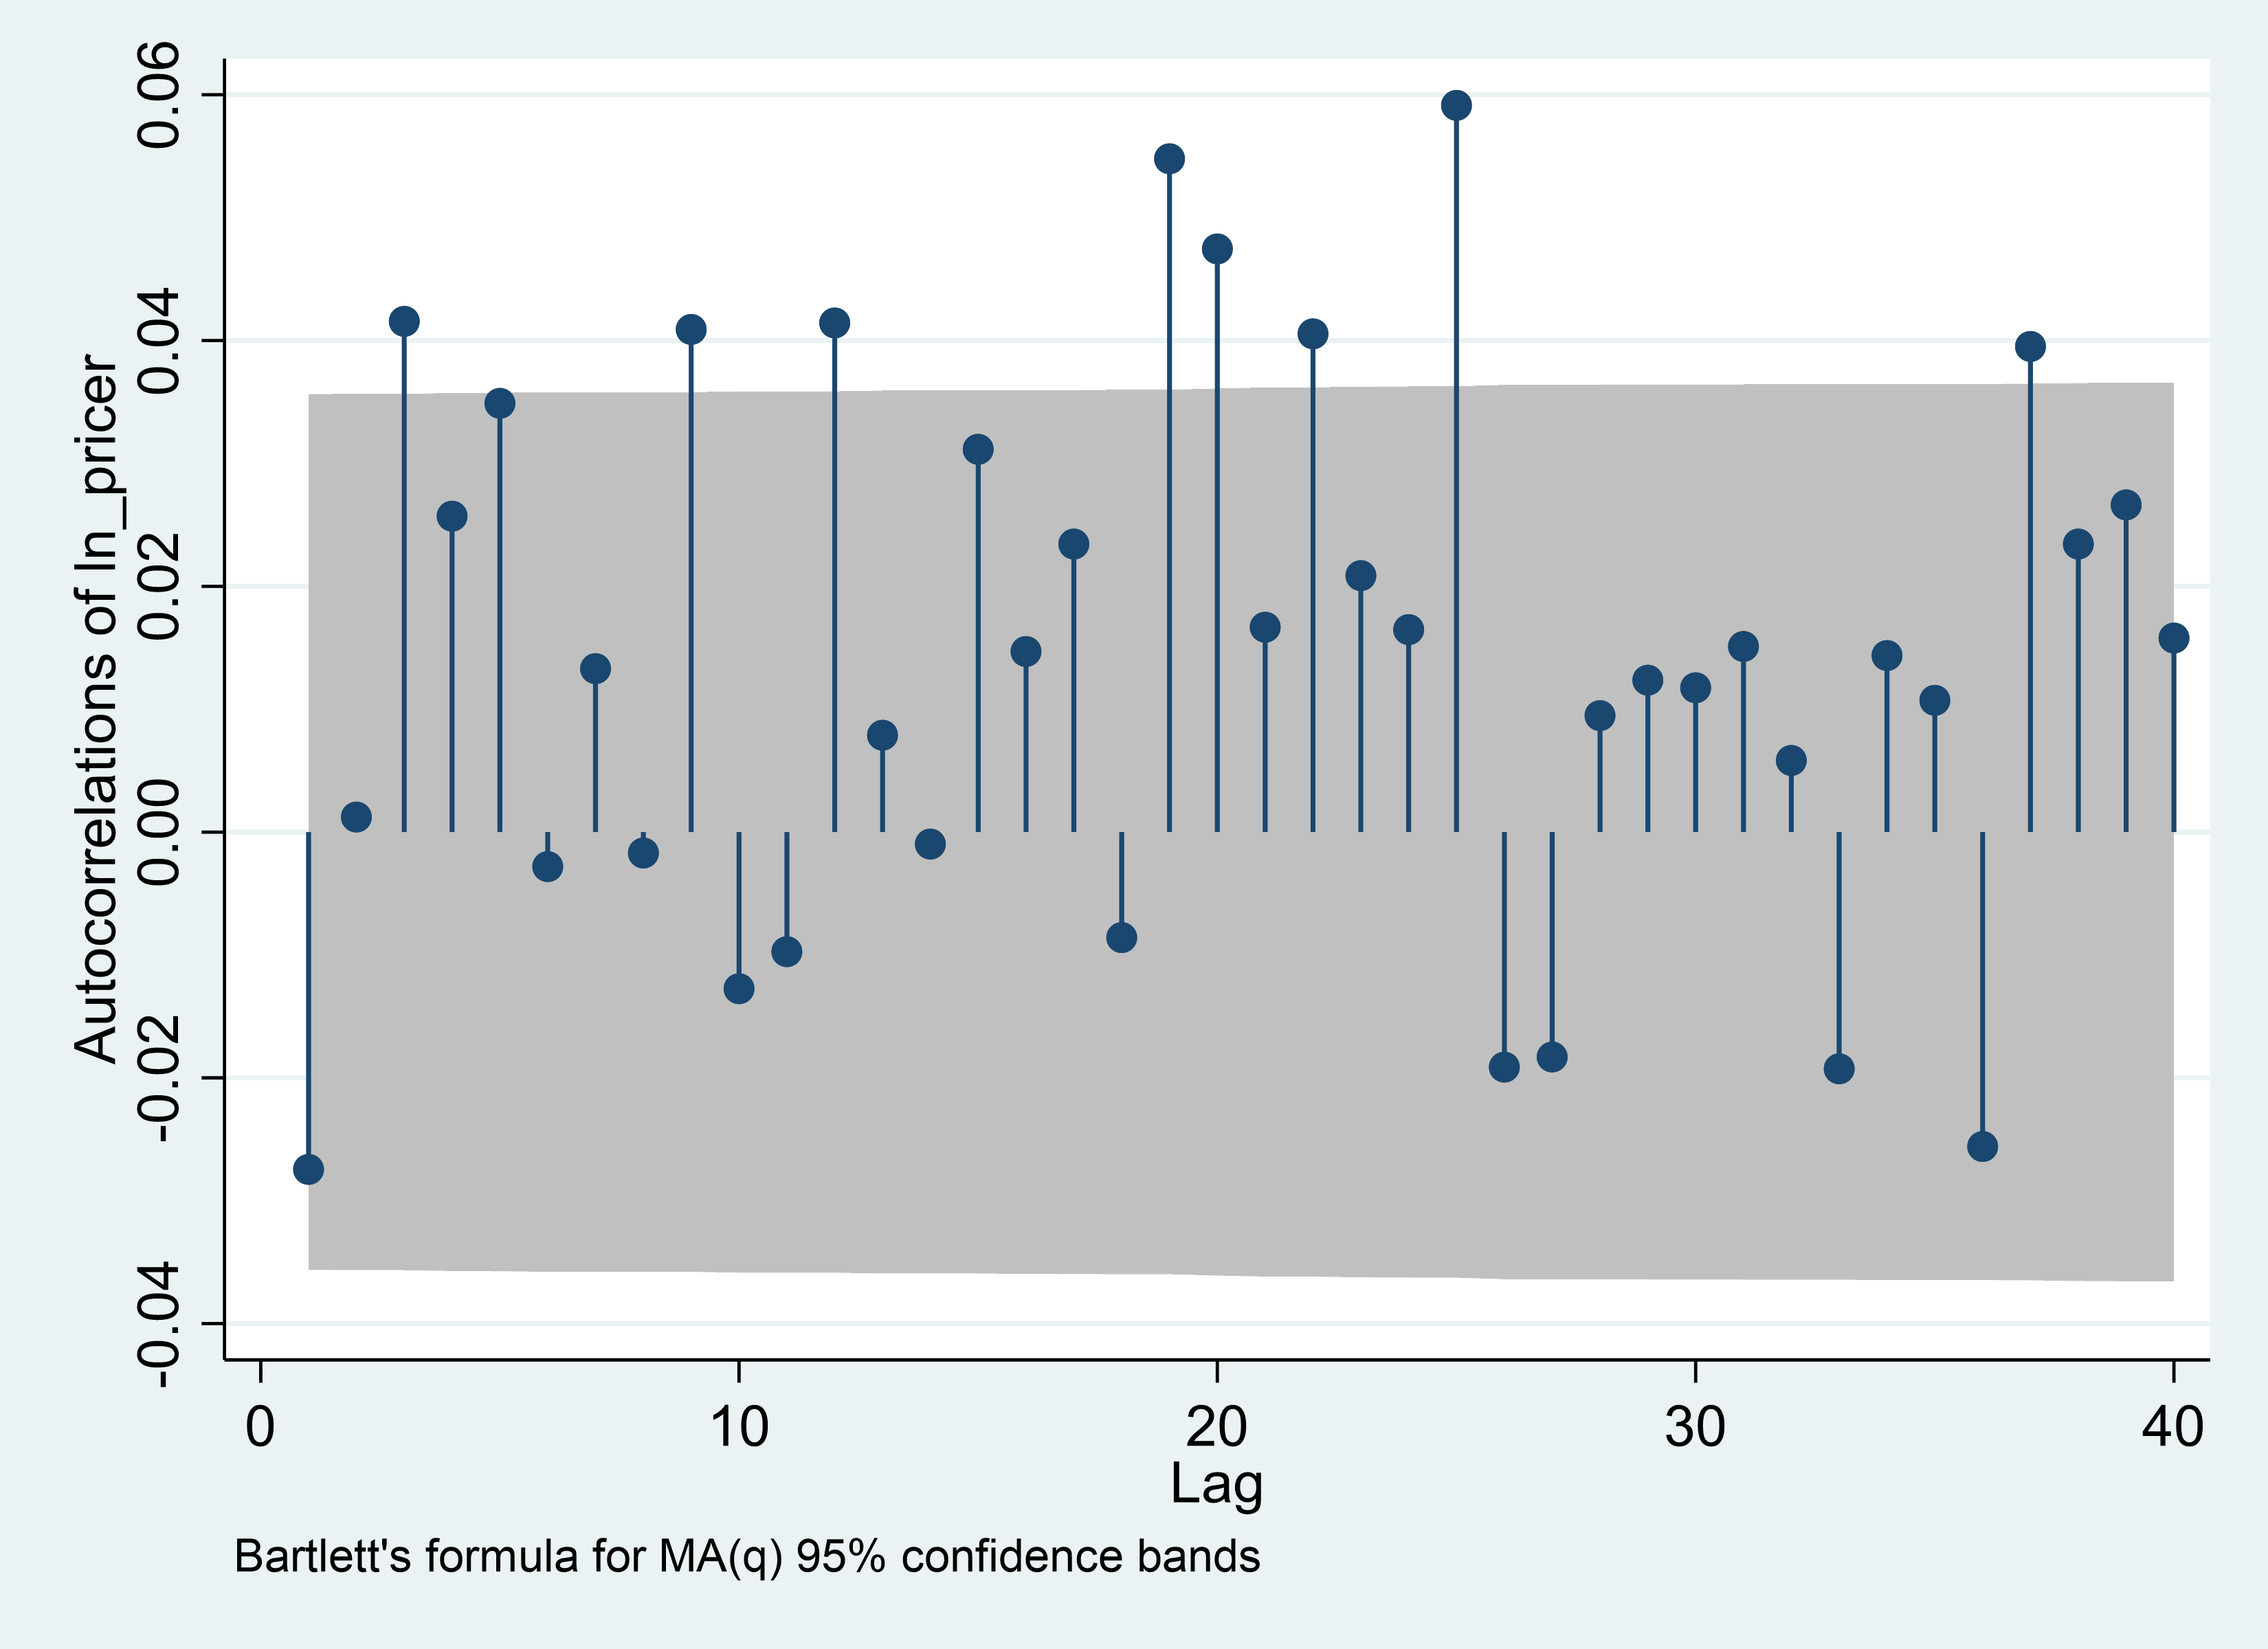
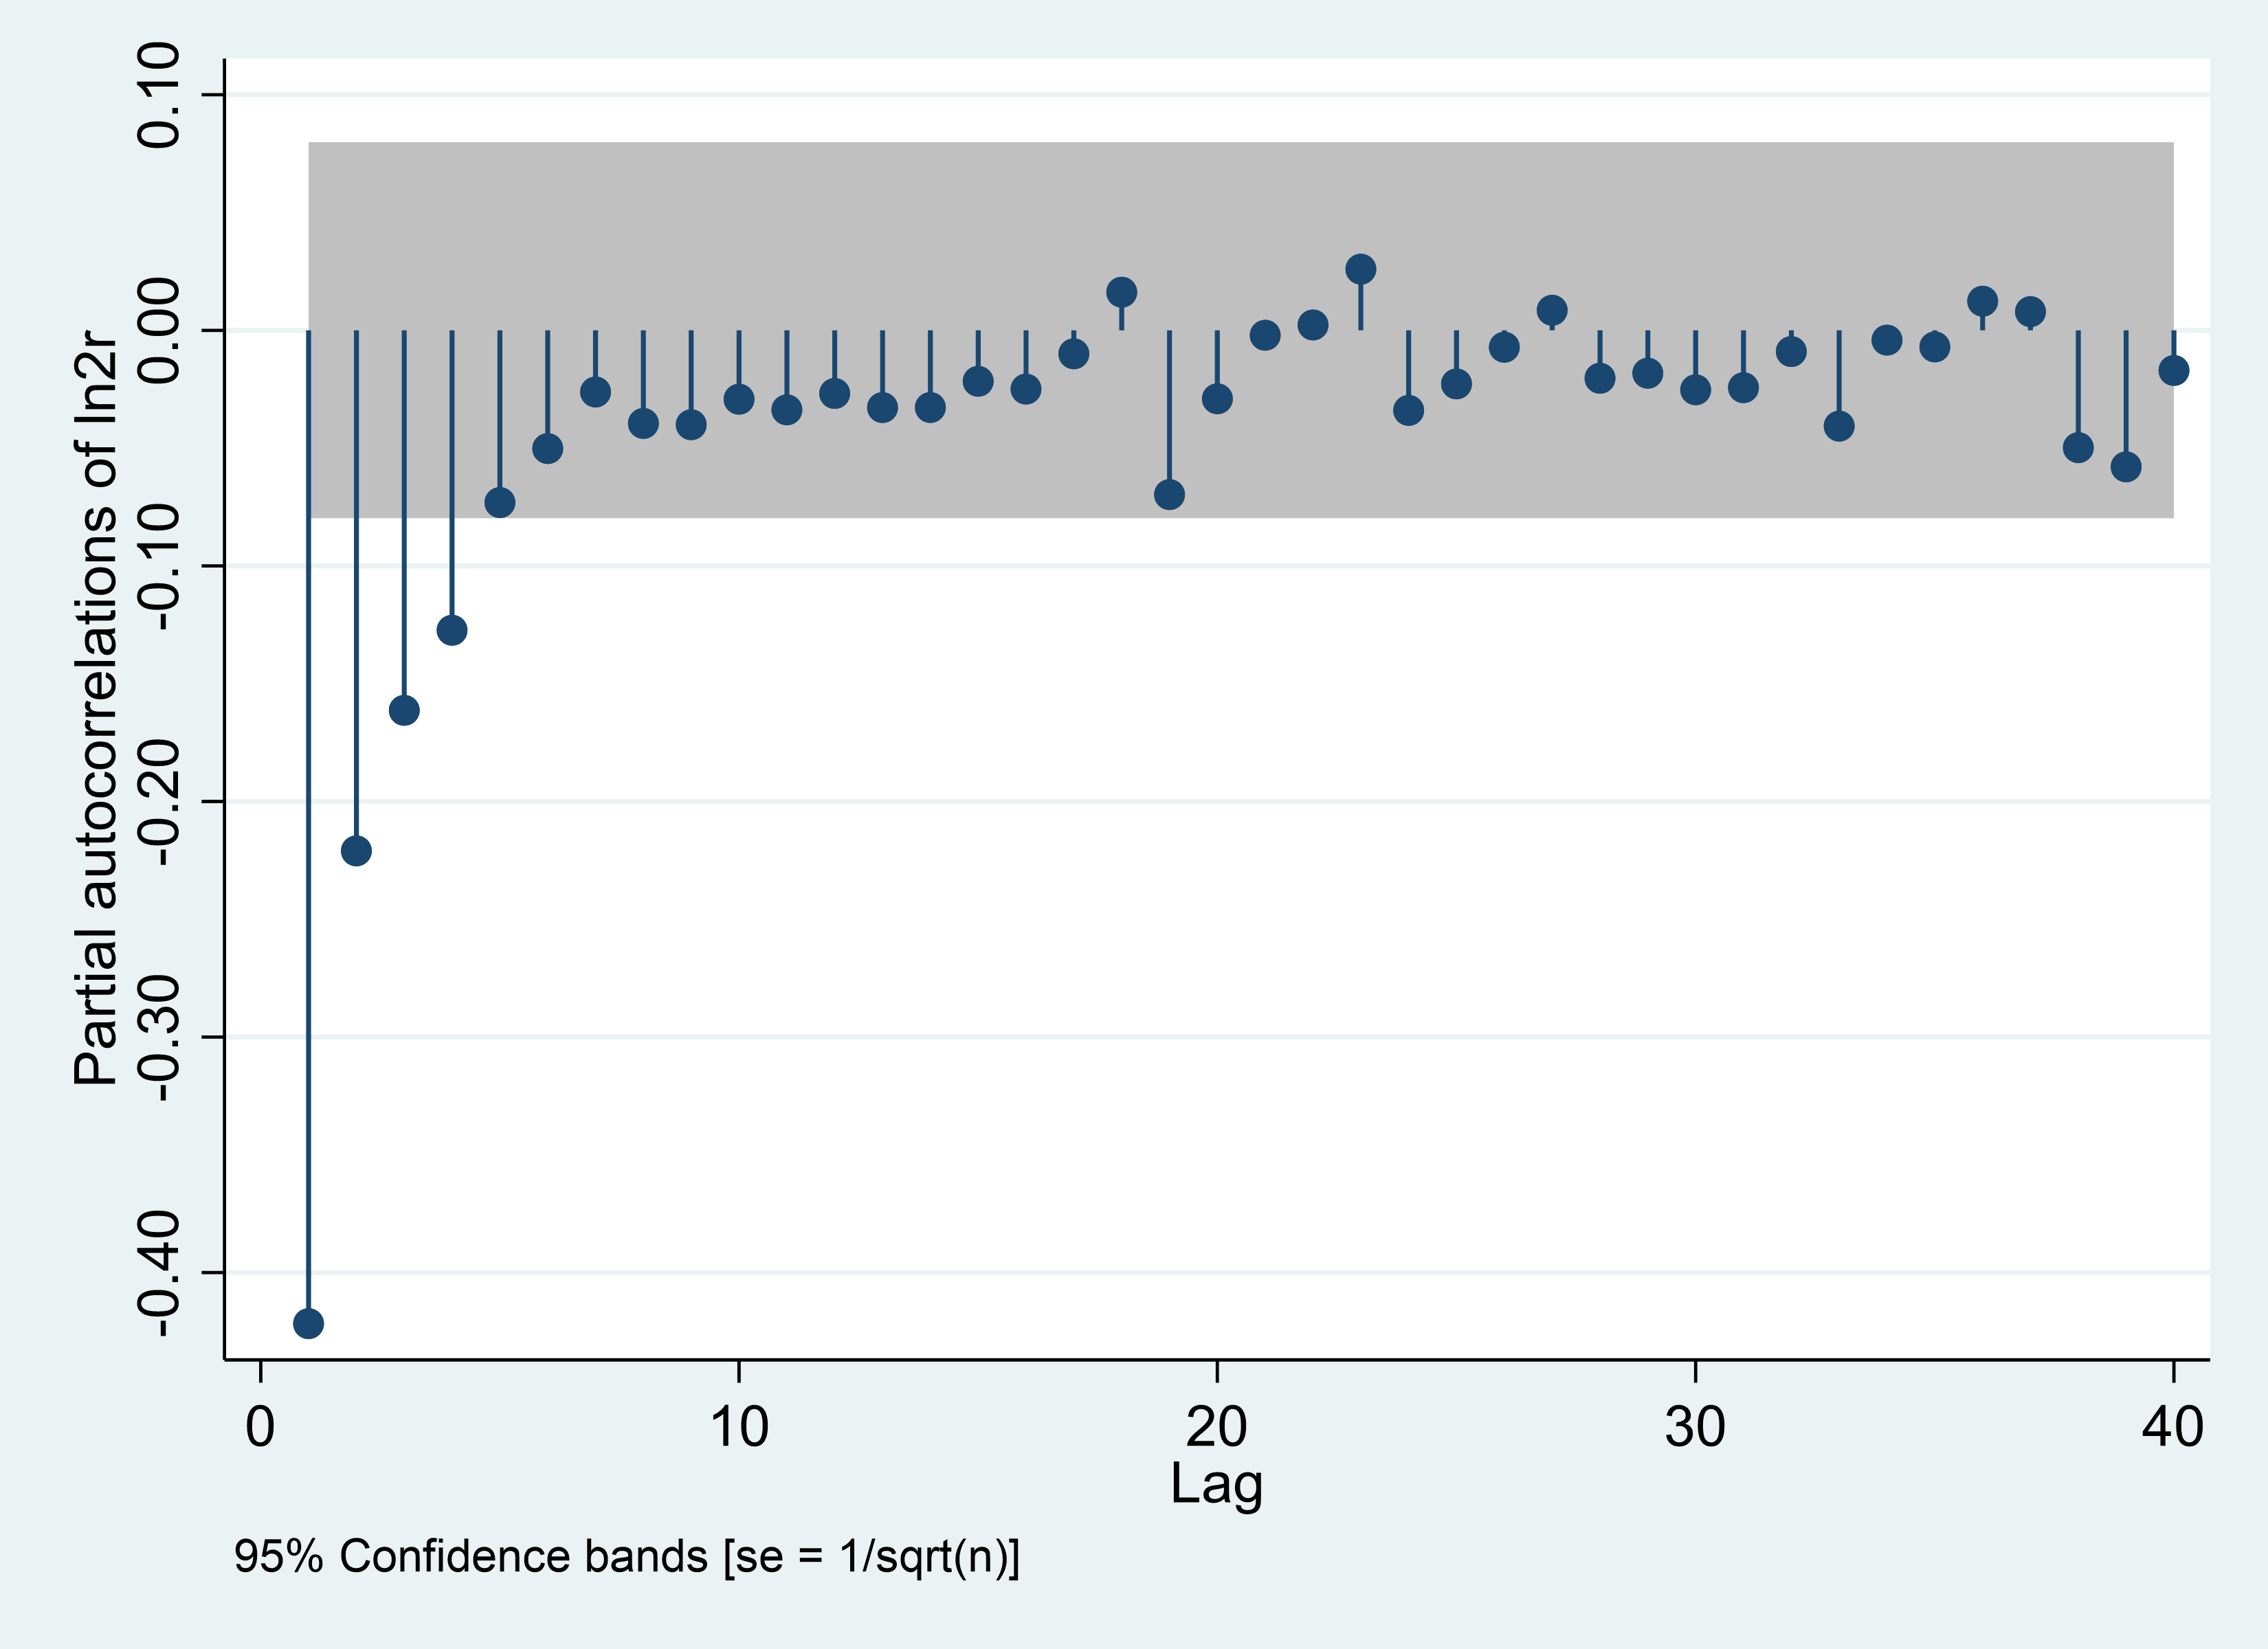
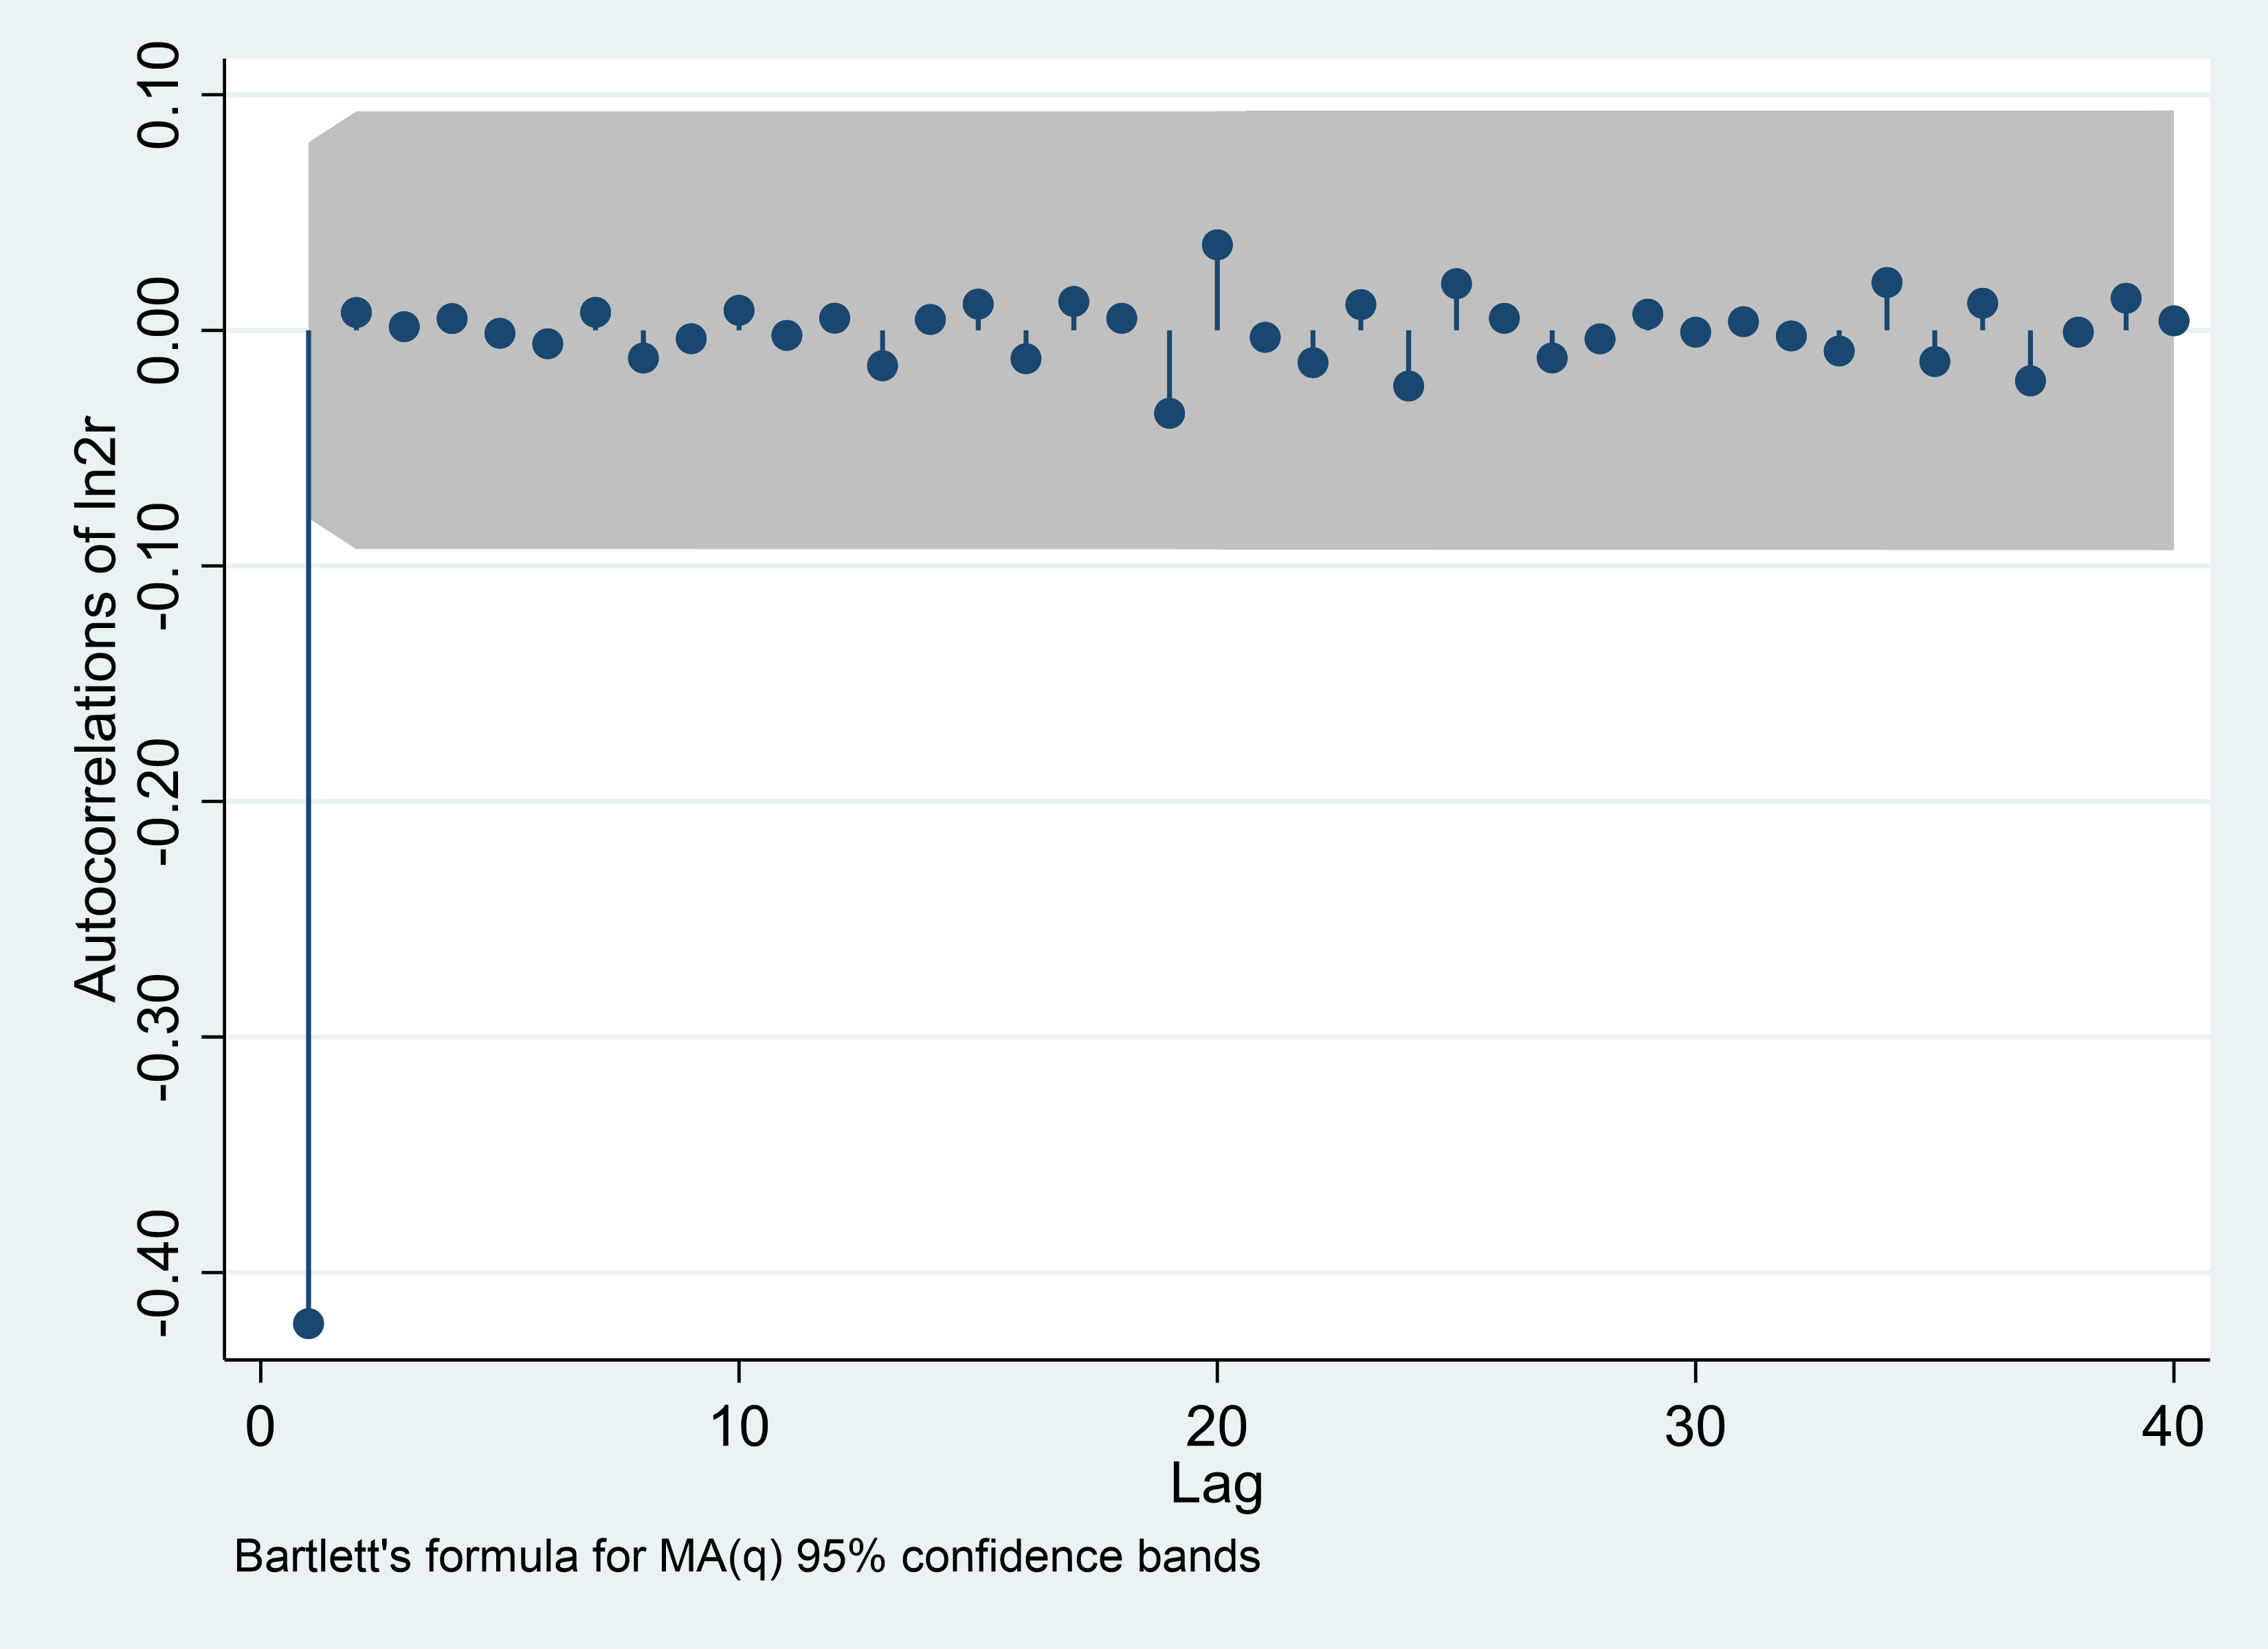
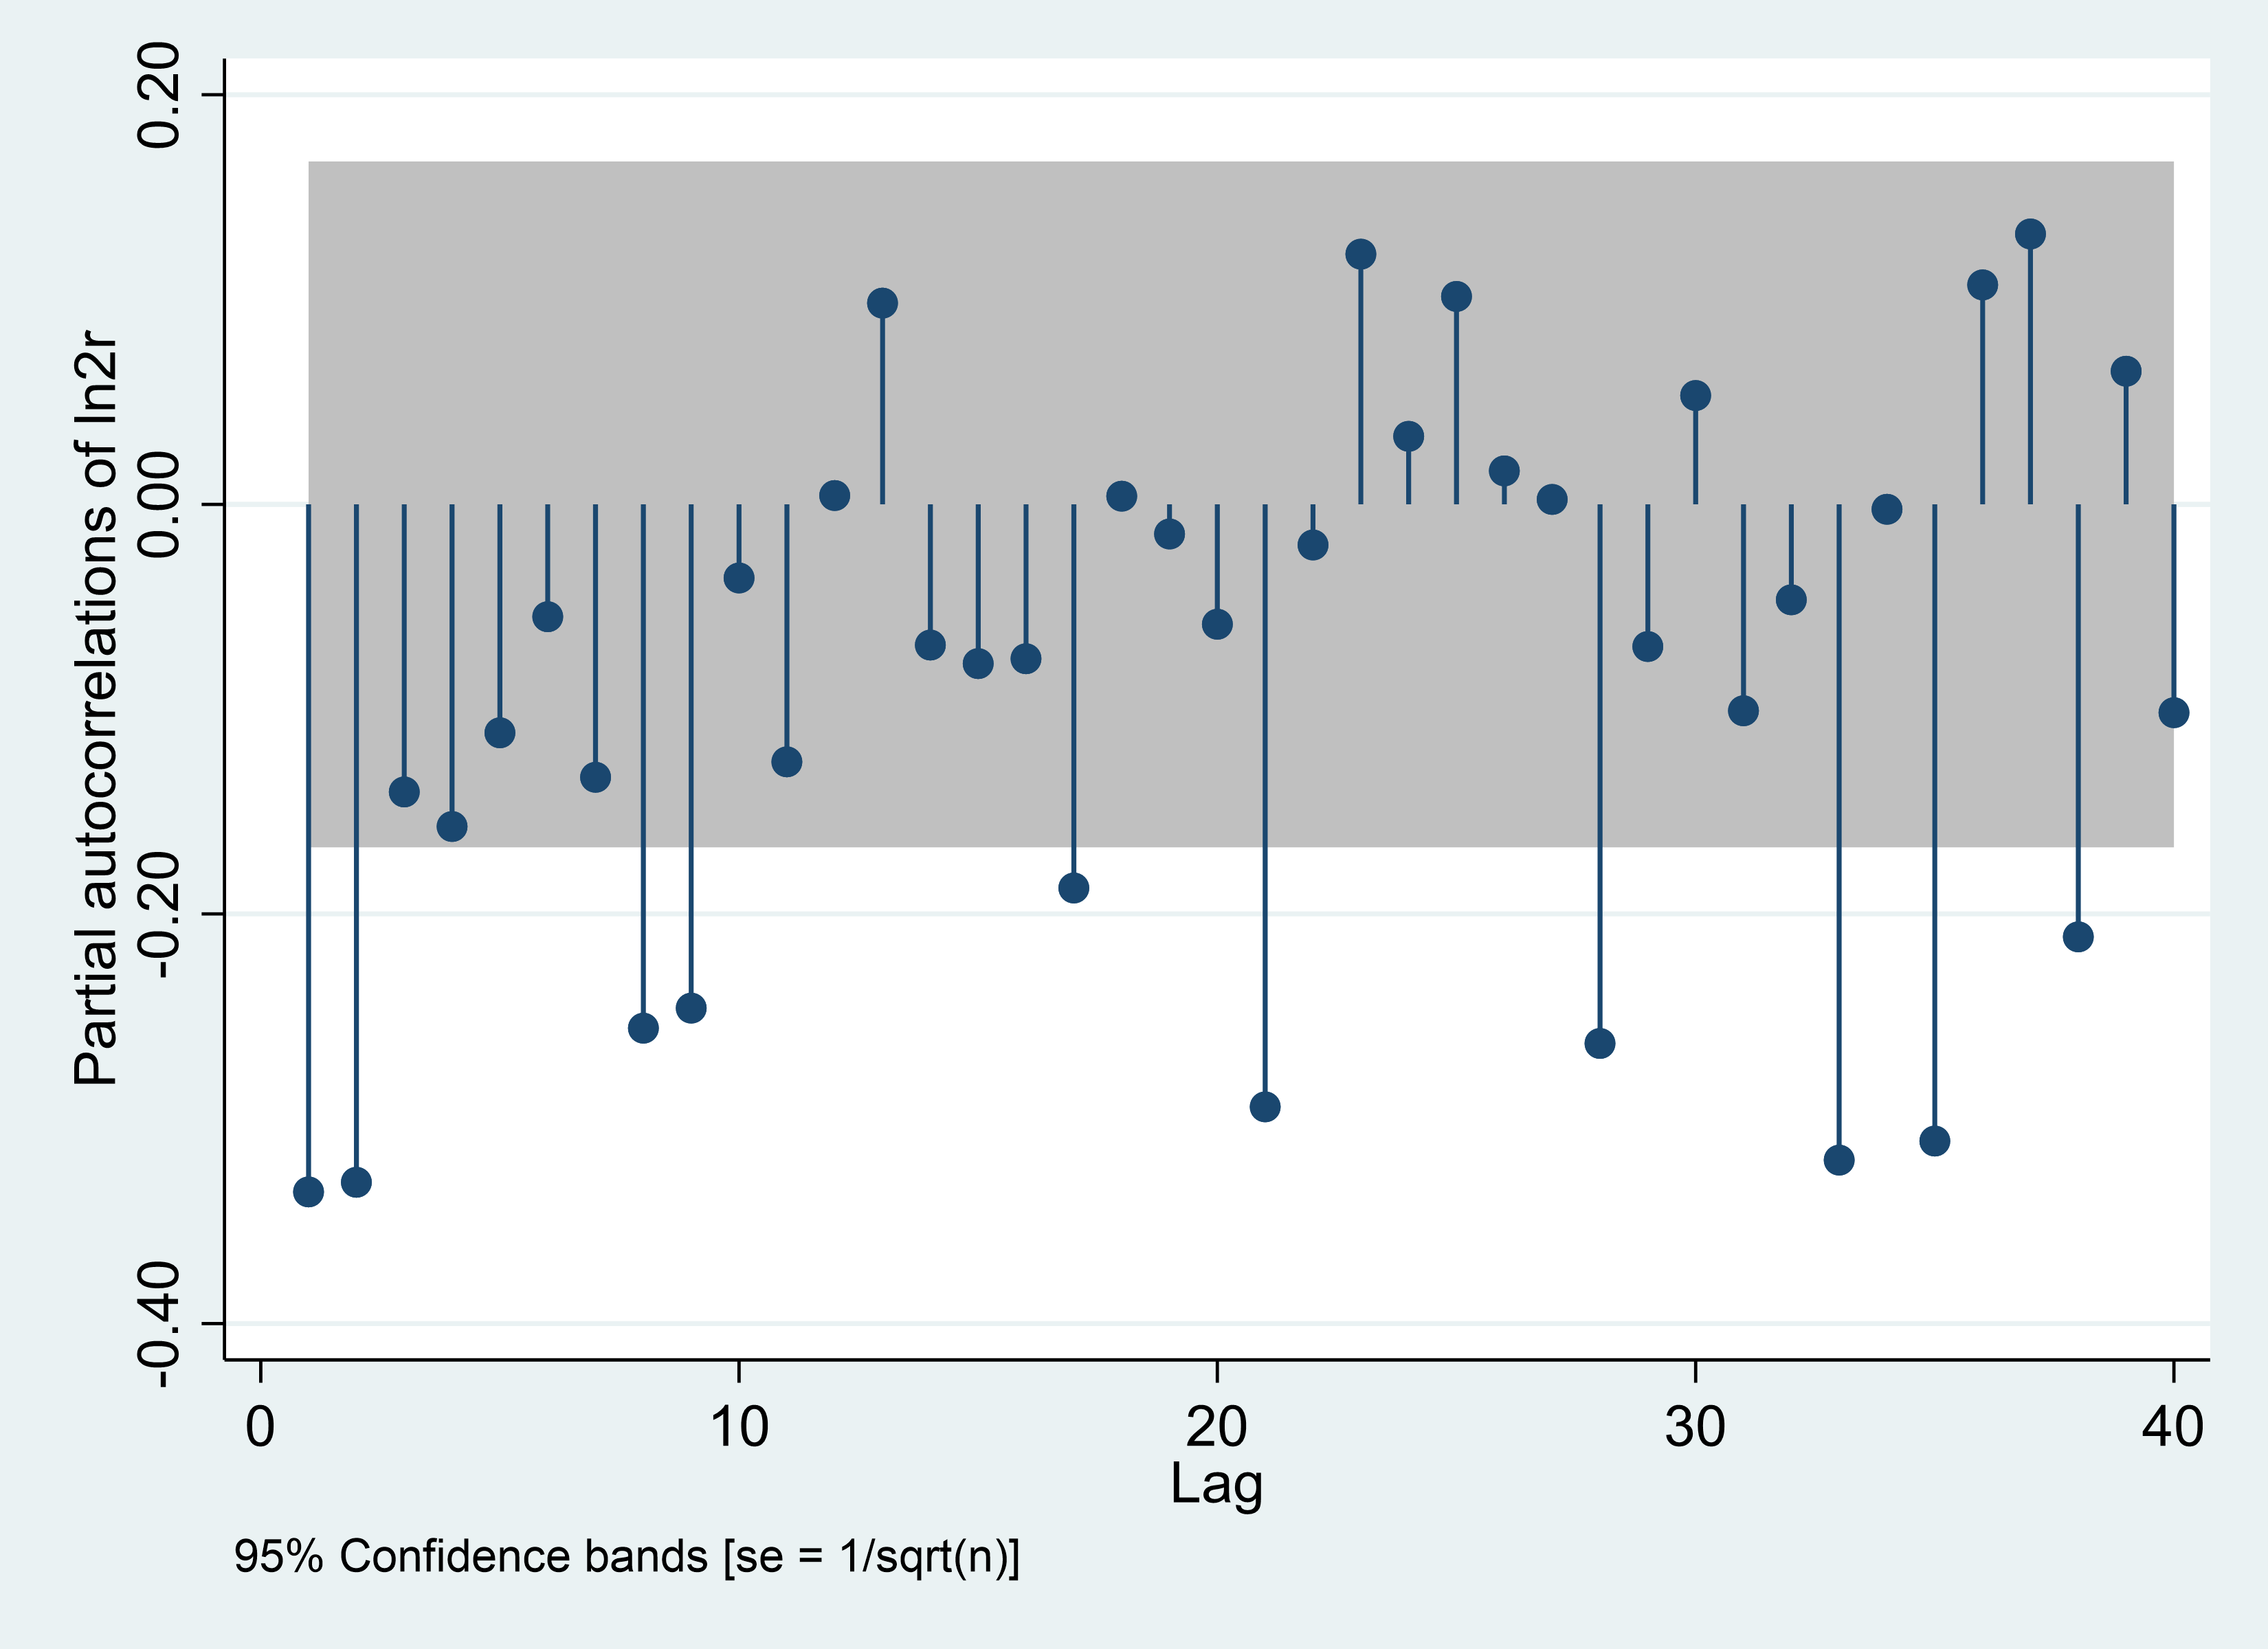
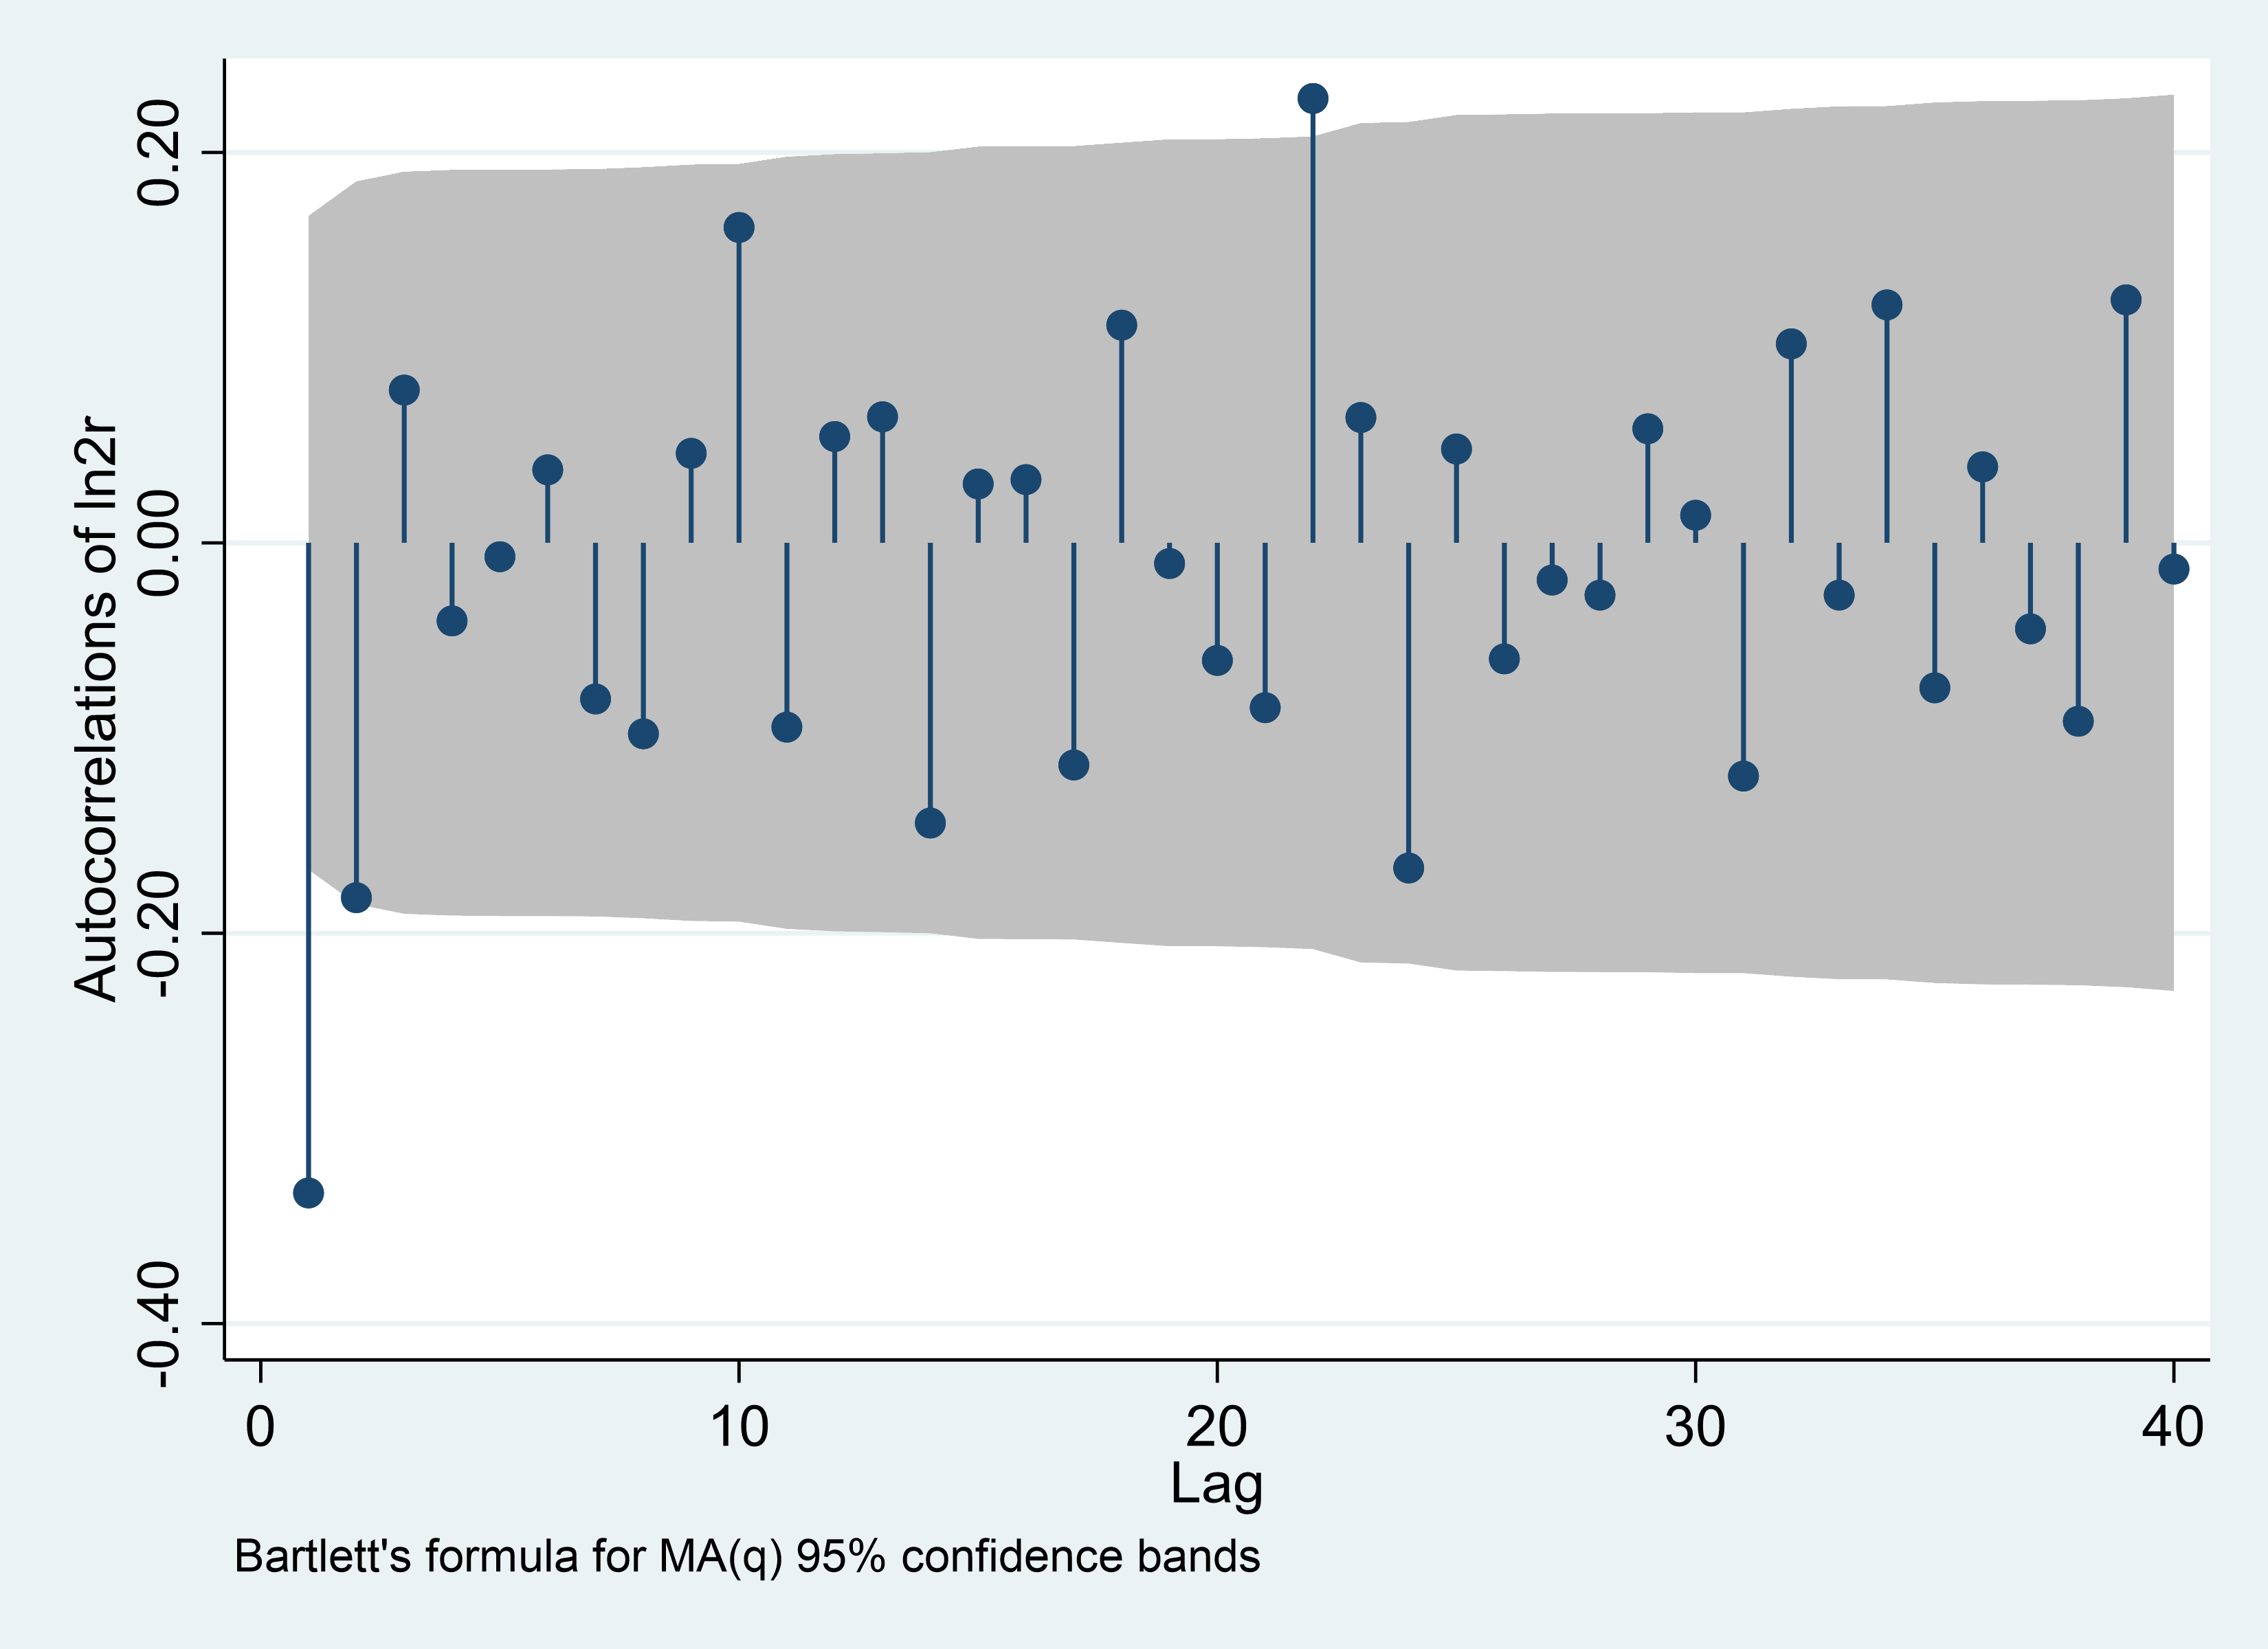
The first step in this section is to use the PACF and ACF pairings to order the first ln_price series. The results are displayed below.
When it comes to the daily data, The part beyond the x-axis is 9 according to the fixed order result of the two images in the first row in Figure 1, which means AR(p) is of order 9 and MA(q) is also of order 9. As a result, p and q have values of 9.
Regarding weekly information, Figure 1 shows AR(p) is of order 4 and MA(q) is of order 1, which means p equals 4 and q equals 1.
As for monthly measured data, the order of AR(p) and MA(p) are 9 and 1 respectively. Therefore, the value of p and q are 9 and 1.
PACF | ACF |
Daily | |
|
|
Weekly | |
|
|
Monthly | |
|
|
Figure 1: ARMA (p, q) identification. | |
Photo credit: Original | |
4.2. Forecasting Results and Interpretation
After establishing the order, a residual test was conducted to determine whether the data were white noise. As shown in Table 2, both the daily and weekly data are white noise data, demonstrating the viability and sufficiency of the data.
Table 2: Residual test.
Model | Portmanteau (Q) statistic | Prob > chi2 |
Daily-ARIMA (9,1,9) | 22.8397 | 0.9866 |
Weekly-ARIMA (4,2,1) | 70.4057 | 0.0021 |
Monthly-ARIMA (9,2,1) | 27.3978 | 0.9351 |
For the forecast of the daily exchange rate, the model evolves the likely trend of the exchange rate after the rate hike from 16 March to 27 March 2022 based on historical data. As can be seen from the Figure 2, the forecast of the exchange rate remains relatively flat at 6.37 after the Fed rate hike. However, after 16 March the actual exchange rate data experienced a fluctuation from about 6.34 to 6.37. The actual value experienced a peak at about 6.37 on the 23 March and then declined. However, the overall actual exchange rate has been consistently lower than the forecast rate. In addition, the fact that there are fewer days in the forecast and a time lag before the dollar appreciates as a result of the interest rate hike may be the cause of the actual exchange rate being lower than the predicted exchange rate.
Figure 2: Actual value and fitted value, daily. |
Photo credit: Original |
Figure 3 prognosticates the USD-CNY exchange rate for the subsequent four weeks following an increase in interest rates by the Fed. The forecasts show a continued appreciation of the dollar, rising from around 6.35 and surpassing the actual exchange rate figure around 25 March, reaching around 6.38 on 10 April. The real exchange rate, however, remained relatively flat around 6.37, which was very close to the predicted value.
Figure 3: Actual value and fitted value, weekly. |
Photo credit: Original |
As can be seen in Figure 4, based on historical exchange rates, the exchange rate should stay essentially flat at approximately 6.4 for the following nine months after March if the Fed does not raise rates. In actuality, after the Fed’s rate hike on 16 March, the US dollar continued to appreciate and the Chinese yuan continued to depreciate. Additionally, the dollar strengthened rapidly from around 6.4 to around 7.3 in October. Then it experienced a decline to roughly 6.9.
Figure 4: Actual value and fitted value, monthly. |
Photo credit: Original |
5. Conclusion
The purpose of this thesis is to investigate how a Fed interest rate hike would affect the exchange rate of the US dollar to the Chinese yuan. After the rate hike in March, a forecasting model based on monthly data illustrates that the US dollar will continue to strengthen and appreciate in the remaining months of 2022, implying a similar depreciation of the Chinese yuan, which is in line with previous research.
The forecasting involves several economic concepts and implications. On the one hand, due to the potential for larger returns on assets denominated in that nation’s currency, when a country’s central bank, like the Federal Reserve in the United States, boosts its interest rates, it frequently attracts higher levels of international investment. As a result, there is a rise in the demand for that currency, which raises its value in relation to other currencies. In this situation, the US currency gains strength. By contrast, the Chinese Yuan has depreciated. As for trade implications, a stronger US dollar may increase the cost of US exports for international consumers, thereby dampening demand for American goods and services. Conversely, a weaker Chinese Yuan may make Chinese exports more affordable on the international market, potentially increasing Chinese exports.
To avoid excessive currency fluctuations that could cause instability, nations may need to coordinate their policies. Firstly, policymakers should keep an eye on capital flows and any possibility for speculation in reaction to changes in currencies. In addition, to ensure overall economic stability, policymakers might need to make changes to their monetary and fiscal strategies. In the case of China, the authorities may need to manage the foreign exchange reserves and align their short-term responses with long-term economic goals.
Investors should also carefully assess the situation. Diversification helps mitigate the impact of currency fluctuations on the overall portfolio, so Investors ought to maintain a well-diversified portfolio comprises a variety of asset classes (stocks, bonds, real estate, etc.) and geographies. Moreover, Investors that have exposure to either the US dollar or the CNY on a considerable scale should evaluate the potential effects on their holdings. A portfolio may need to be rebalanced to take into account shifting market dynamics if it is highly influenced by certain currencies. Besides, markets for currencies can be erratic. Investors should continuously monitor developments and be ready to modify their strategies if the situation alter.
It is confirmed by the ARIMA model that the Fed’s interest rate hike led to the appreciation of the US dollar and the depreciation of the RMB. Besides, the results of this study are in line with previous researches. For this situation, this thesis proposes relevant policy recommendations including maintaining the stability of capital inflows and the trade, keeping an eye on macroeconomic stability and foreign reserves management. Similarly, it also suggests that investors can make opportunistic investments when the exchange rate changes, but they need to pay attention to the market fluctuations. Furthermore, investors are recommended to diversify their risks and improve their overall consciousness in order to analyze the global economy.
References
[1]. Mahmoudi, M. (2023). COVID lessons: was there any way to reduce the negative effect of COVID-19 on the United States economy? Journal of Economic Studies (Bradford), 50(5), 896–920. https://doi.org/10.1108/JES-01-2022-0052
[2]. ‘Understanding US inflation during the COVID era’ (2022) Premium Official News, 09 Sep, NA, available: https://link-gale-com.liverpool.idm.oclc.org/apps/doc/A717044760/GBIB?u=livuni&sid=bookmark-GBIB&xid=c4857d8d [accessed 23 Aug 2023].
[3]. ‘Fed raises interest rates by another 75 basis points’ (2022) Country Report: United States, 29 Jul, NA, available: https://link-gale-com.liverpool.idm.oclc.org/apps/doc/A712154405/GBIB?u=livuni&sid=bookmark-GBIB&xid=6df9ab4a [accessed 23 Aug 2023].
[4]. Siegel, R. (2021). Fed projects new interest rate hike in 2022, signals upcoming easing of supports if economy continues to heal. Washington Post, NA. https://link-gale-com.liverpool.idm.oclc.org/apps/doc/A676431460/AONE?u=livuni&sid=bookmark-AONE&xid=756927c3.
[5]. M. Zhang, (2022). The depreciation of the RMB against the US Dollar: Manifestations, Causes, Responses and prospects. Tsinghua Financisal Review.10:69-70.
[6]. T. T. Zhu, (2022). Volatility Analysis and Trend Forecast of RMB Exchange Rate against US Dollar. Zhongnan University of Economics and Law.
[7]. M. Zhang, Y. M. Chen, (2022). No need to worry about a sharp depreciation of the RMB against the US dollar. China’s currency market, 11:22-26.
[8]. H. Z. Qi, Y. Y. Chen and Y. Y. Liu, (2023). Spillover effect and Countermeasures of the Federal Reserve’s interest rate hike Cycle in 2022. Journal of Changchun Finance College, 01:5-14.
[9]. Z. P. Zhang, (2022). Study on the Impact of Exchange Rate Fluctuation on China’s Import and Export Trade. North China University of Technology.
[10]. N. S. Cooray, P. Thangavel, (2022). The impact and implication of the COVID-19 on the trade relationship between China and the United States: the political economy perspectives. Transnational Corporations Review 14.1.
Cite this article
Chen,Y. (2023). The Impact of the Interest Rates Raised by Federal Reserve System on the Exchange Rate of the US Dollar Against the Chinese Yuan. Advances in Economics, Management and Political Sciences,56,34-41.
Data availability
The datasets used and/or analyzed during the current study will be available from the authors upon reasonable request.
Disclaimer/Publisher's Note
The statements, opinions and data contained in all publications are solely those of the individual author(s) and contributor(s) and not of EWA Publishing and/or the editor(s). EWA Publishing and/or the editor(s) disclaim responsibility for any injury to people or property resulting from any ideas, methods, instructions or products referred to in the content.
About volume
Volume title: Proceedings of the 2nd International Conference on Financial Technology and Business Analysis
© 2024 by the author(s). Licensee EWA Publishing, Oxford, UK. This article is an open access article distributed under the terms and
conditions of the Creative Commons Attribution (CC BY) license. Authors who
publish this series agree to the following terms:
1. Authors retain copyright and grant the series right of first publication with the work simultaneously licensed under a Creative Commons
Attribution License that allows others to share the work with an acknowledgment of the work's authorship and initial publication in this
series.
2. Authors are able to enter into separate, additional contractual arrangements for the non-exclusive distribution of the series's published
version of the work (e.g., post it to an institutional repository or publish it in a book), with an acknowledgment of its initial
publication in this series.
3. Authors are permitted and encouraged to post their work online (e.g., in institutional repositories or on their website) prior to and
during the submission process, as it can lead to productive exchanges, as well as earlier and greater citation of published work (See
Open access policy for details).
References
[1]. Mahmoudi, M. (2023). COVID lessons: was there any way to reduce the negative effect of COVID-19 on the United States economy? Journal of Economic Studies (Bradford), 50(5), 896–920. https://doi.org/10.1108/JES-01-2022-0052
[2]. ‘Understanding US inflation during the COVID era’ (2022) Premium Official News, 09 Sep, NA, available: https://link-gale-com.liverpool.idm.oclc.org/apps/doc/A717044760/GBIB?u=livuni&sid=bookmark-GBIB&xid=c4857d8d [accessed 23 Aug 2023].
[3]. ‘Fed raises interest rates by another 75 basis points’ (2022) Country Report: United States, 29 Jul, NA, available: https://link-gale-com.liverpool.idm.oclc.org/apps/doc/A712154405/GBIB?u=livuni&sid=bookmark-GBIB&xid=6df9ab4a [accessed 23 Aug 2023].
[4]. Siegel, R. (2021). Fed projects new interest rate hike in 2022, signals upcoming easing of supports if economy continues to heal. Washington Post, NA. https://link-gale-com.liverpool.idm.oclc.org/apps/doc/A676431460/AONE?u=livuni&sid=bookmark-AONE&xid=756927c3.
[5]. M. Zhang, (2022). The depreciation of the RMB against the US Dollar: Manifestations, Causes, Responses and prospects. Tsinghua Financisal Review.10:69-70.
[6]. T. T. Zhu, (2022). Volatility Analysis and Trend Forecast of RMB Exchange Rate against US Dollar. Zhongnan University of Economics and Law.
[7]. M. Zhang, Y. M. Chen, (2022). No need to worry about a sharp depreciation of the RMB against the US dollar. China’s currency market, 11:22-26.
[8]. H. Z. Qi, Y. Y. Chen and Y. Y. Liu, (2023). Spillover effect and Countermeasures of the Federal Reserve’s interest rate hike Cycle in 2022. Journal of Changchun Finance College, 01:5-14.
[9]. Z. P. Zhang, (2022). Study on the Impact of Exchange Rate Fluctuation on China’s Import and Export Trade. North China University of Technology.
[10]. N. S. Cooray, P. Thangavel, (2022). The impact and implication of the COVID-19 on the trade relationship between China and the United States: the political economy perspectives. Transnational Corporations Review 14.1.