


1. Introduction
Global attention to sustainable development has grown fast in recent years. Governments and global organizations all over the world are collaborating to develop strategies for a greener world. When it comes to the action of international institutions, the United Nations approved the 2030 Agenda for Sustainable Development in September 2015, and the Paris Agreement also aims to control global warming to less than 2oC. As the world's second-largest economic unit, China plays an essential role in contributing to global sustainable development.
With the link between the concept of sustainability and CSR, enterprises play a significant role in achieving sustainable development goals as the main microeconomic. Their stakeholders' needs and desires influence businesses' motivations and goals. To achieve profitability and growth, companies must prioritize their stakeholders' social acceptance and involvement. The impact of CSR on CFP sets a company's attitude toward and level of investment in social responsibility activities. Clarifying the relationship between CSR and CFP is thus critical for corporate strategic decision-making and promoting corporate and national social responsibility efforts.
Despite the fact that the existing literature has paid close attention to the relationship between CSR and CFP, they have not yet reached a consensus on whether social responsibility can enhance corporate financial performance or not. Furthermore, empirical research on the relationship between CSR and the financial performance of Chinese companies, particularly in specific industries, still needs to be conducted. This paper investigates the relationship between CSR and CFP by addressing the relationship and threshold effect between CSR and CFP using Chinese-listed companies in the energy sector as the research sample.
2. Literature Review
2.1. Corporate Social Responsibility Concept
CSR was first proposed in the nineteenth century by American economist Howard Bowen in his book “Social Responsibilities of the Businessman” in 1953 [1]. It is defined as the responsibility that corporations must accept in order to profit while also maintaining and increasing the wealth of society as a whole [2]. Not limited to beneficial, Drucker [3] claimed that CSR does not mean doing good things or not doing harm, but the conversion from social problems into profit opportunities for corporations. As one of the important international institutions, World Business Council For Sustainable Development [4] think company shows their CSR by acting ethically with an ongoing commitment. After a long period of development and expansion, its concept has been widely recognized and has become a successful management tool [5]. However, there is no one standard model can be reached, and it is difficult to give a concept that can be accepted by everyone [6].
There have been a large number of publications about CSR over the last few decades, but they are highly fragmented. On the one hand, this is due to the numerous research directions of CSR extension, and on the other, to the high heterogeneity of CSR concept application subjects [7].
2.2. Relationship Between Corporate Social Responsibility and Corporate Financial Performance
Plenty of studies on the relationship between CSR and CFP have been conducted in the past, but no consensus has been reached. Griffin and Mahon [8] carried out a comprehensive review of 51 articles, encompassing 62 studies over the past 25 years, and found that 33 of them showed a significant positive correlation, 20 studies showed a significant negative correlation, and 9 studies yielded inconclusive results. Similarly, Margolis and Walsh [9] summarized 127 related empirical studies from 109 articles spanning 1972 to 2002 and found that almost half of them showed a positive relationship, 7 showed a negative relationship, 28 did not give a strong relation, and the rest of 20 did not show an obvious result. Besides the linear relationship that many studies and papers discussed, the non-linear relationship between CSR and CFP also exists [10], [11].
The divergent findings in the literature can be attributed to various factors. One of them is about the inappropriate measurement approaches due to the complexity of CSR theory [12]. Also, the direct and indirect effects of CSR need to be disentangled [13]. Another possibility is the missing moderator variable and mediator variable, which can help to capture the key complexity precisely [14].
2.3. The Impact of Developing Countries and the Energy Sector
Local CSR takes many forms, and the difference is becoming more visible in developed as well as developing nations [15]. However, China, as a prominent player among developing nations, has not received adequate attention in this context. Besides the difference among countries, the fact that different relationship results are shown by different sectors suggests the need of choosing a specific focal one [16], [17]. Consequently, this study centers on the energy industry in China. The energy sector holds particular significance as its contribution to global greenhouse gas emissions and its importance of being the key to fight against environmental issues, according to IEA and IRENA [18]. The importance of the energy sector in decarbonization and achieving sustainability goals cannot be underestimated. Therefore, this study focuses on publicly traded companies in the energy sector as a means to comprehend the underlying dynamics and provide a model for other industries.
3. Methodology
3.1. Data Collection
This study uses CSR scores and selected financial indexes of listed companies in the Chinese energy industry over the past 10 years. This study's CSR scores were obtained from Hexun.com, and needed financial data was obtained from the CSMAR Database. Due to their abnormal financial status, samples with missing data and companies with the marks ST, *ST, and PT were removed to ensure the reliability and validity of the results.
3.2. Hypothesis
According to the literature review, the relationship between CSR and CFP may vary from study to study. In fact, rather than being straightforwardly positive or negative, the relationship between CSR and CFP may be nonlinear. On the one hand, excessive CSR commitment can lead to increased marginal costs and decreased marginal benefits, resulting in a decline in CFP [19]. Companies that do not actively invest in CSR activities, on the other hand, may gain an edge over their competitors by reducing related costs, and potentially improving their CFP [20]. On this basis, this paper puts forward the following hypothesis:
Hypothesis: The impact of CSR on CFP is nonlinear.
3.3. Model Setup
3.3.1. Panal Regression Model
To estimate how CSR influences CFP, this paper constructs the following panel regression model:
\( {Performance_{i,t}}={β_{0}}+{β_{1}}{CSR_{i,t}}+βCSR_{i,t}^{2}+\sum {Control_{i,t}}+{ε_{i,t}} \) (1)
In the model, the independent variable Performance is CFP. The dependent variable is CSR. CSR2 is the quadratic term of CSR, which is set to capture the non-linear connection between CSR and CFP. Control variables are those that are used to adjust for the possible influence of others. To address potential time-lagged effects of financial indicators, a fixed-effect panel regression model including lagged variables is used in the analysis.
3.3.2. Threshold Effect Test
This study employs a dynamic panel threshold model inspired by Hansen [21] to investigate the possible threshold effect of CSR on CFP. The model is configured as follows:
\( {Performance_{i,t}}={U_{i}}+{α_{1}}{CSR_{i,t}}I({CSR_{i,t}}≤γ)+{α_{2}}{CSR_{i,t}}I({CSR_{i,t}} \gt γ)+{α_{3}}\sum {Control_{i,t}}+{ε_{i,t}} \) (2)
Where i indicates the firm and t indicates the year. γ establishes the scale of CSR where the impact on CFP can change, and I(*) is the indicator function. When \( {CSR_{i,t}}≤γ \) , I(*)=1, and I(*)=0 otherwise.
The threshold test is done by the following steps:
1) The null hypothesis below is proposed to test the existence of the threshold effect:
H0: \( {α_{1}} \) = \( {α_{2}} \) (3)
2) The bootstrap method is employed to model the progressive distribution of the likelihood ratio, which is calculated using a formula as follows; for each threshold, 300 bootstrap simulations are performed:
\( F=\frac{({S_{0}}-{S_{1}})}{{\hat{δ}^{2}}} \) (4)
In this formula, S0 is the sum of squares of residuals of the linear model without threshold effect, and S1 is the sum of squares of residuals of the estimated model with the single threshold effect.
3) calculate \( the estimate of threshold value γ \) by minimizing the sum squares of residuals:
\( \hat{γ}={arg_{γ}}min{S_{1}}(γ) \) (5)
4) Calculate the LR ratio, which is calculated as below, is a statistic to form γ’s confidence intervals and the “no-rejection region”:
\( L{R_{1}}(γ)=\frac{({S_{1}}(γ)-{S_{1}}(\hat{γ}))}{{\hat{δ}^{2}}} \) (6)
5) With a given confidence level \( α \) , the null rejection cannot be rejected when:
\( LR(γ) \gt -2log{(1-1-α)} \) (7)
3.4. Meaning of the Variables
3.4.1. Dependent Variable: Corporate Financial Performance
Marketing measures, accounting measures, and perceptual measures are mainly used as financial performance measures in the previous literature [22]. McWilliams and Siegel [23] claimed that accounting measures can reflect the effectiveness of the corporate internal process for decision-making and the performance of the managers. And when it comes to the goal of figuring out the relationship, using accounting measures is better than an index based on the market [24]. Therefore, this study adapted ROA and ROIC as measures of financial performance.
3.4.2. Independent Variable: Corporate Social Responsibility
The CSR scores utilized in this study were obtained from the Hexun database. Hexun.com has developed a comprehensive system for assessing the CSR of listed companies. The evaluation system considers five key aspects: shareholder responsibility, supplier, customer, and consumer responsibility, environmental responsibility, employee responsibility, and social responsibility.
3.4.3. Control Variables
Other factors may influence the relationship between CSR and CFP, so control variables are required [25]. This study used firm size and leverage, as in previous papers [26-28].
Size: The firm’s size is calculated by the natural logarithm (LN) of total assets. Both excessively large and small sizes, according to Marshall's theory of economies of scale, are detrimental to business development.
Leverage: The percentage of indebtedness is used to measure leverage, which is the proportion of total debt to total assets specifically. The likelihood of financial distress can be captured by the leverage [28].
4. Results
4.1. Descriptive Statistics and Correlation Analysis
The descriptive statistics for the variables in this study are shown in Table 1. For the index of CFP, the mean value of ROA and ROIC for Chinese listed energy firms are 1.89% and 1.92%, respectively. The standard deviations of them are 2.45 and 3.39, indicating relatively significant fluctuation in the sample data with regard to financial performance. The average value of the firms’ CSR scores is 26.29, with a standard deviation of 17.72, which also demonstrates that there is considerable variation in CSR performance among sampled firms.
Table 1: Descriptive statistics of key variables.
Statistics | N | Mean | St.Dev | Min | Max |
ROA | 957 | 1.89 | 2.45 | -6.75 | 17.72 |
ROIC | 957 | 1.92 | 3.39 | -18.74 | 63.78 |
Size | 957 | 22.98 | 1.59 | 16.85 | 26.82 |
LEV | 957 | 56.62 | 26.79 | 1.28 | 437.24 |
CSR | 957 | 26.29 | 17.72 | -11.30 | 79.96 |
Shareholder | 957 | 13.35 | 6.55 | -10.43 | 26.72 |
Employee | 957 | 2.57 | 2.92 | 0.00 | 15.00 |
SCC | 957 | 2.40 | 5.8 | 0.00 | 20.00 |
Environment | 957 | 2.04 | 5.02 | 0.00 | 30.00 |
Social | 957 | 5.93 | 4.49 | -15 | 18.50 |
Note: The variables are: ROA=return on assets, ROIC=return on investment capital, Size= LN (Total Assets), LEV=leverage of the firm, CSR=CSR total scores, Shareholder=shareholder responsibility scores, Employee=employee responsibility scores, SCC=suppliers, customers, and consumers responsibility scores, Environment=environment responsibility scores, Social=social responsibility scores.
Table 2 displays the correlations between variables. ROA and ROIC have a strong correlation because they both represent the company's financial situation. The different components of the CSR score also show a strong correlation among themselves, but since we only include the total CSR scores in the model, the specific correlations between its constituent factors will not impact the robustness of the model. Notably, the correlations between critical dependent and independent variables are relatively low, indicating that there is no significant collinearity.
Table 2: Correlations between variables.
Size | LEV | ROA | CSR | Shrhlder | Emply | SCC | Env | Sci | ROIC | |
Size | 1 | |||||||||
LEV | 0.196 | 1 | ||||||||
ROA | -0.054 | -0.214 | 1 | |||||||
CSR | 0.199 | -0.049 | 0.223 | 1 | ||||||
Shrhlder | 0.276 | 0.192 | 0.370 | 0.591 | 1 | |||||
Emply | 0.036 | 0.029 | 0.015 | 0.784 | 0.140 | 1 | ||||
SCC | 0.094 | 0.026 | 0.069 | 0.861 | 0.201 | 0.843 | 1 | |||
Env | 0.066 | 0.032 | 0.033 | 0.815 | 0.120 | 0.898 | 0.908 | 1 | ||
Sci | 0.164 | -0.002 | 0.204 | 0.550 | 0.388 | 0.145 | 0.250 | 0.165 | 1 | |
ROIC | -0.091 | 0.027 | 0.783 | 0.156 | 0.266 | 0.020 | 0.043 | 0.016 | 0.143 | 1 |
Note: ROA=return on assets, ROIC=return on investment capital, Size= LN (Total Assets), LEV=leverage of the firm, CSR=CSR total scores, Shrhld=shareholder responsibility scores, Emply=employee responsibility scores, SCC=suppliers, customers, and consumers responsibility scores, Env=environment responsibility scores, Sci=social responsibility scores.
4.2. Relationship Between CSR and CFP
Table 3, which reports the results of the fixed effect panel data regression, summarizes the main findings of this paper. The empirical analysis result shows that, under the control of individual and time effects, the regression coefficients of the independent variable, which is CSR, are 0.070 and 0.116, which are statistically significant given the 1% level. Similarly, the coefficients of the squared term (CSR2) are both -0.001 and are significant at the 1% level as well.
Based on the short review of the regression result above, key findings emerge that the influence of CSR on CFP is nonlinear, thereby supporting the preliminary hypothesis 1 Furthermore, based on the fitted curves and the sample distribution range, it is discovered that the non-linear relationship between CSR and CFP follows an “inverted U-shaped curve”, which is supported via dynamic panel threshold model later.
Table 3: Correlations between variables.
Dependent Variable | ||
ROA | ROIC | |
CSR | 0.070*** (0.011) | 0.116*** (0.015) |
CSR2 | -0.001*** (0.0001) | -0.001*** (0.0002) |
Size | 0.152* (0.091) | -0.049 (0.127) |
LEV | -1.449*** (0.235) | 1.705*** (0.330) |
Lagged_ROA | 0.073*** (0.027) | |
Lagged_ROIC | 8.824*** (2.105) | |
Observations | 876 | 876 |
R2 | 0.137 | 0.126 |
Adjusted R2 | -0.006 | -0.019 |
F Statistic (df = 5; 751) | 23.837*** | 21.565*** |
Note: The variables are: ROA=return on assets, ROIC=return on investment capital, Size= LN (Total Assets), LEV=leverage of the firm, CSR=CSR total scores, Lagged_ROA=ROA in lagged time period, Lagged_ROIC=ROIC in lagged time period. *p<0.1, **p<0.05, ***p<0.01
4.3. Threshold Effect Analysis
This study ran a series of threshold tests to see if there were any threshold effects in the relationship between CSR and CFP. A single threshold test was performed firstly to detect the existence of threshold effect, and continuous examinations about double and triple threshold tests are made to find out more details. Figure 1 represents the LR ratio graph, and the threshold test results are shown in Table 4. For the model with ROA as the dependent variable, both the p-values of its first and second thresholds are smaller than 0.05, indicating the existence of a second threshold effect. For the model with ROIC as the dependent variable, only the p-value of its first threshold is smaller than 0.05, which approves that the first threshold effect exists. As a result, while the two models with different dependent variables show different levels of threshold effects, the analysis results can confirm the presence of a nonlinearity relationship between the dependent and independent variable, which is a segmented function divided by CSR performance.
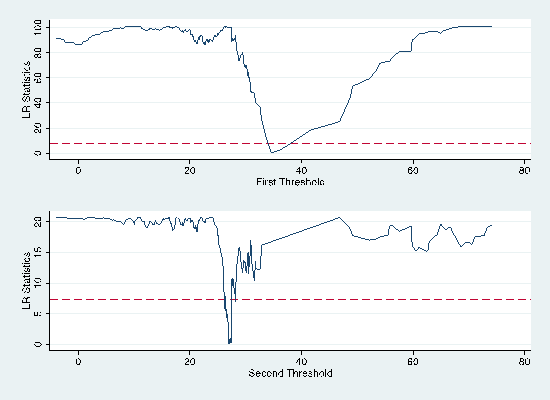
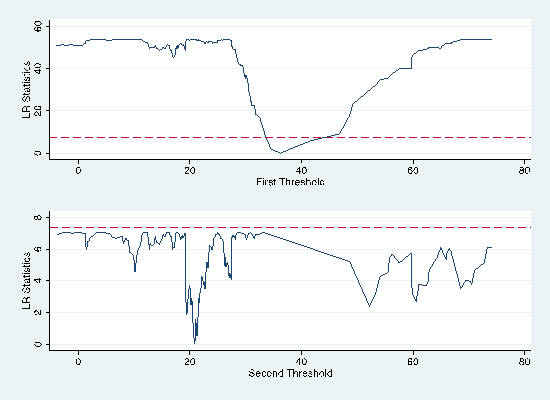
Figure 1: LR ratio graph of ROA (left) and ROIC (right).
Table 4: Threshold effect test result.
Model | Dependent Variable | Threshold Value | P-value |
Single Threshold | ROA | 34.580 | 0.000 |
ROIC | 36.240 | 0.000 | |
Double Threshold | ROA | [26.980, 34.580] | 0.027 |
ROIC | [20.890, 36.240] | 0.490 | |
Triple Threshold | ROA | [22.710, 26.980, 34.580] | 0.723 |
ROIC | [17.150, 20.890, 36.240] | 0.747 |
Table 5 shows the results of threshold effect regression, where includes \( {γ_{1}} \) and \( {γ_{2}} \) are the threshold values. When the total CSR scores are below \( {γ_{1}} \) , the coefficients estimate of CSR are 0.0054 and 0.0925, which means that for every 1% improvement in CSR performance, the CFP performance (ROA and ROIC) is going to increase by 0.54% and 9.25% respectively, on average. When the CSR scores are between \( {γ_{1}} \) and \( { γ_{2}} \) , a 1% increase in CSR scores can lead to a 7.42% and 2.89% increase in ROA and ROIC, on average. For CSR scores that are greater than \( {γ_{2}} \) , with every 1% increase in scores, ROA is going to increase by 2.32%.
The study has confirmed that CSR has a positive influence on CFP, but the positive relationship is not linearly constant. For ROA, this influence first increases and then decreases; while for ROIC, it decreases with the improvement of CSR. The above empirical findings support the notion that the effect of CSR on CFP is non-linear, further validating the original research hypothesis.
Table 5: Threshold effect of CSR on CFP.
Variable | ROA | ROIC |
\( {γ_{1}} \) | 26.980 | 36.340 |
\( {γ_{2}} \) | 34.580 | - |
CSR (csr< \( {γ_{1}} \) ) | 0.0054*** (0.009) | 0.0925*** (0.026) |
CSR( \( {γ_{1}} \lt \) csr< \( {γ_{2}} \) ) | 0.0742*** (0.009) | 0.0289*** (0.009) |
CSR (csr> \( {γ_{2}} \) ) | 0.0232*** (0.004) | - |
N | 657 | 657 |
R2 | 0.2097 | 0.1507 |
Note: *p<0.1, **p<0.05, ***p<0.01
5. Discussion
This study found a relationship between corporate social responsibility (CSR) and corporate financial performance (CFP) in listed Chinese energy companies. In line with the hypothesis, the findings demonstrate that CSR can impact CFP positively and nonlinearly, with the existence of a CSR threshold that leads to varying degrees of positive impact on CFP. This research not only complements the existing research on the impact of CSR on CFP in China but also provides theoretical support and guidance for companies, especially those in the energy sector, to proactively undertake social responsibilities. It should be noted, however, that due to the source of data limitations, this study concentrates solely on the research of publicly traded companies in China's energy sector. As a result, there may be a lack of explanatory power for those smaller and less financially robust enterprises. Additionally, since the goal of this paper is to verify the non-linear relationship between CSR and CFP, the aspects of exploring the threshold effects manifested by different financial indicators, and the different threshold effects manifested by different financial indicators are not explained. This leaves room for future investigation.
6. Conclusions
The purpose of this study is to investigate the relationship between CSR and CFP among listed Chinese energy companies. By utilizing fixed effect panel data regression and threshold tests on CSR scores and typical financial indicators, it can be discovered that CSR can affect CFP positively and nonlinearly, which is in accordance with the research hypothesis. Also, the threshold test approves that the presence of a CSR threshold causes variations in the degree of this positive impact on CFP. This study offers theoretical insights and guidance to companies by supplementing previous research on the impact of CSR on CFP in China. Yet the limitations of sample choice need to be noted and a more general conclusion and threshold effect across industries with a focus on different financial measures are needed to be researched by those practitioners further.
Corporate social responsibility (CSR) has grown into an increasingly popular subject across various sectors in recent years. Many companies use CSR to improve their reputation and competitiveness and thus leading to better financial performance. Nonetheless, the perceived additional costs and potential lack of short-term benefits make CSR activities appear less profitable in the immediate future. The review of previous literature does not show a unanimous conclusion about the causal effect of CSR on CFP, particularly when taking Chinese energy sectors as research samples. This study goes beyond prior research by proposing a non-fixed connection between CSR and CFP, highlighting the potential of an optimal CSR threshold.
References
[1]. Howard Rothmann Bowen, Peter Geoffrey Bowen, & Jean-Pascal Gond. (2013). Social responsibilities of the businessman. University Of Iowa Press. (Original work published 1953)
[2]. Davis, K., & Blomstrom, R. L. (1975). Business and society : environment and responsibility. Mcgraw-Hill.
[3]. Drucker, P. F. (1984). Converting Social Problems into Business Opportunities: The New Meaning of Corporate Social Responsibility. California Management Review, 26(2), 53–63. https://doi.org/10.2307/41165066
[4]. WBCSD.(2000).World Business Council For Sustainable Development (WBCSD). Wbcsd.org. https://www.wbcsd.org/
[5]. Isaksson, L., Kiessling, T., & Harvey, M. (2014). Corporate social responsibility: Why bother? Organizational Dynamics, 43(1), 64–72. https://doi.org/10.1016/j.orgdyn.2013.10.008
[6]. Carroll, A. B. (2000). Ethical Challenges for Business in the New Millennium: Corporate Social Responsibility and Models of Management Morality. Business Ethics Quarterly, 10(1), 33–42. https://doi.org/10.2307/3857692
[7]. Belas, J., Škare, M., Gavurova, B., Dvorsky, J., & Kotaskova, A. (2022). The impact of ethical and CSR factors on engineers’ attitudes towards SMEs sustainability. Journal of Business Research, 149, 589–598. https://doi.org/10.1016/j.jbusres.2022.05.056
[8]. Griffin, J. J., & Mahon, J. F. (1997). The Corporate Social Performance and Corporate Financial Performance Debate. Business & Society, 36(1), 5–31. https://doi.org/10.1177/000765039703600102
[9]. Administrative Science Quarterly, 48(2), 268–305. https://doi.org/10.2307/3556659
[10]. Barnett, M. L., & Salomon, R. M. (2012). Does it pay to be really good? Addressing the shape of the relationship between social and financial performance. Strategic Management Journal, 33(11), 1304–1320.
[11]. Nollet, J., Filis, G., & Mitrokostas, E. (2016). Corporate social responsibility and financial performance: A non-linear and disaggregated approach. Economic Modelling, 52, 400–407. https://doi.org/10.1016/j.econmod.2015.09.019
[12]. Galant, A., & Cadez, S. (2017). Corporate social responsibility and financial performance relationship: a review of measurement approaches. Economic Research-Ekonomska Istraživanja, 30(1), 676–693.
[13]. Lioui, A., & Sharma, Z. (2012). Environmental corporate social responsibility and financial performance: Disentangling direct and indirect effects. Ecological Economics, 78, 100–111. https://doi.org/10.1016/j.ecolecon.2012.04.004
[14]. Namazi, M., & Namazi, N.-R. (2016). Conceptual Analysis of Moderator and Mediator Variables in Business Research. Procedia Economics and Finance, 36, 540–554. https://doi.org/10.1016/s2212-5671(16)30064-8
[15]. Jamali, D., & Karam, C. (2016). Corporate Social Responsibility in Developing Countries as an Emerging Field of Study. International Journal of Management Reviews, 20(1), 32–61. https://doi.org/10.1111/ijmr.12112
[16]. Baird, P. L., Geylani, P. C., & Roberts, J. A. (2011). Corporate Social and Financial Performance Re-Examined: Industry Effects in a Linear Mixed Model Analysis. Journal of Business Ethics, 109(3), 367–388. https://doi.org/10.1007/s10551-011-1135-z
[17]. Lin, C.-S., Chang, R.-Y., & Dang, V. (2015). An Integrated Model to Explain How Corporate Social Responsibility Affects Corporate Financial Performance. Sustainability, 7(7), 8292–8311. https://doi.org/10.3390/su7078292
[18]. IEA, & IRENA. (2017). PERSPECTIVES FOR THE ENERGY TRANSITION Investment Needs for a Low-Carbon Energy System. International Renewable Energy Agency.
[19]. Adegbite, E., Guney, Y., Kwabi, F., & Tahir, S. (2018). Financial and corporate social performance in the UK listed firms: the relevance of non-linearity and lag effects. Review of Quantitative Finance and Accounting, 52(1), 105–158. https://doi.org/10.1007/s11156-018-0705-x
[20]. Bhattacharya, C. B., & Sen, S. (2004). Doing Better at Doing Good: When, Why, and How Consumers Respond to Corporate Social Initiatives. California Management Review, 47(1), 9–24. https://doi.org/10.2307/41166284
[21]. Hansen, B. E. (1999). Threshold effects in non-dynamic panels: Estimation, testing, and inference. Journal of Econometrics, 93(2), 345–368. https://doi.org/10.1016/s0304-4076(99)00025-1
[22]. Orlitzky, M., & Benjamin, J. D. (2001). Corporate Social Performance and Firm Risk: A Meta-Analytic Review. Business & Society, 40(4), 369–396. https://doi.org/10.1177/000765030104000402
[23]. McWilliams, A., & Siegel, D. (2000). Corporate social responsibility and financial performance: correlation or misspecification? Strategic Management Journal, 21(5), 603–609. https://doi.org/10.1002/(sici)1097-0266(200005)21:5%3C603::aid-smj101%3E3.0.co;2-3
[24]. Moore, G. (2001). Corporate Social and Financial Performance: An Investigation in the U.K. Supermarket Industry. Journal of Business Ethics, 34(3/4), 299–315. https://doi.org/10.1023/a:1012537016969
[25]. Huang, K., Sim, N., & Zhao, H. (2020). Corporate social responsibility, corporate financial performance and the confounding effects of economic fluctuations: A meta-analysis. International Review of Financial Analysis, 70, 101504. https://doi.org/10.1016/j.irfa.2020.101504
[26]. Hasan, I., Kobeissi, N., Liu, L., & Wang, H. (2016). Corporate Social Responsibility and Firm Financial Performance: The Mediating Role of Productivity. SSRN Electronic Journal, 149(3). https://doi.org/10.2139/ssrn.2768097
[27]. Orazalin, N., & Mahmood, M. (2021). Toward sustainable development: Board characteristics, country governance quality, and environmental performance. Business Strategy and the Environment, 30(8). https://doi.org/10.1002/bse.2820
[28]. Bose, S., Shams, S., Ali, M. J., & Mihret, D. (2021). COVID‐19 impact, sustainability performance and firm value: international evidence. Accounting & Finance, 62(1). https://doi.org/10.1111/acfi.12801
Cite this article
Xu,Z. (2023). The Impact of Corporate Social Responsibility on Corporate Financial Performance --An Empirical Study of Chinese Energy Firms. Advances in Economics, Management and Political Sciences,56,78-87.
Data availability
The datasets used and/or analyzed during the current study will be available from the authors upon reasonable request.
Disclaimer/Publisher's Note
The statements, opinions and data contained in all publications are solely those of the individual author(s) and contributor(s) and not of EWA Publishing and/or the editor(s). EWA Publishing and/or the editor(s) disclaim responsibility for any injury to people or property resulting from any ideas, methods, instructions or products referred to in the content.
About volume
Volume title: Proceedings of the 2nd International Conference on Financial Technology and Business Analysis
© 2024 by the author(s). Licensee EWA Publishing, Oxford, UK. This article is an open access article distributed under the terms and
conditions of the Creative Commons Attribution (CC BY) license. Authors who
publish this series agree to the following terms:
1. Authors retain copyright and grant the series right of first publication with the work simultaneously licensed under a Creative Commons
Attribution License that allows others to share the work with an acknowledgment of the work's authorship and initial publication in this
series.
2. Authors are able to enter into separate, additional contractual arrangements for the non-exclusive distribution of the series's published
version of the work (e.g., post it to an institutional repository or publish it in a book), with an acknowledgment of its initial
publication in this series.
3. Authors are permitted and encouraged to post their work online (e.g., in institutional repositories or on their website) prior to and
during the submission process, as it can lead to productive exchanges, as well as earlier and greater citation of published work (See
Open access policy for details).
References
[1]. Howard Rothmann Bowen, Peter Geoffrey Bowen, & Jean-Pascal Gond. (2013). Social responsibilities of the businessman. University Of Iowa Press. (Original work published 1953)
[2]. Davis, K., & Blomstrom, R. L. (1975). Business and society : environment and responsibility. Mcgraw-Hill.
[3]. Drucker, P. F. (1984). Converting Social Problems into Business Opportunities: The New Meaning of Corporate Social Responsibility. California Management Review, 26(2), 53–63. https://doi.org/10.2307/41165066
[4]. WBCSD.(2000).World Business Council For Sustainable Development (WBCSD). Wbcsd.org. https://www.wbcsd.org/
[5]. Isaksson, L., Kiessling, T., & Harvey, M. (2014). Corporate social responsibility: Why bother? Organizational Dynamics, 43(1), 64–72. https://doi.org/10.1016/j.orgdyn.2013.10.008
[6]. Carroll, A. B. (2000). Ethical Challenges for Business in the New Millennium: Corporate Social Responsibility and Models of Management Morality. Business Ethics Quarterly, 10(1), 33–42. https://doi.org/10.2307/3857692
[7]. Belas, J., Škare, M., Gavurova, B., Dvorsky, J., & Kotaskova, A. (2022). The impact of ethical and CSR factors on engineers’ attitudes towards SMEs sustainability. Journal of Business Research, 149, 589–598. https://doi.org/10.1016/j.jbusres.2022.05.056
[8]. Griffin, J. J., & Mahon, J. F. (1997). The Corporate Social Performance and Corporate Financial Performance Debate. Business & Society, 36(1), 5–31. https://doi.org/10.1177/000765039703600102
[9]. Administrative Science Quarterly, 48(2), 268–305. https://doi.org/10.2307/3556659
[10]. Barnett, M. L., & Salomon, R. M. (2012). Does it pay to be really good? Addressing the shape of the relationship between social and financial performance. Strategic Management Journal, 33(11), 1304–1320.
[11]. Nollet, J., Filis, G., & Mitrokostas, E. (2016). Corporate social responsibility and financial performance: A non-linear and disaggregated approach. Economic Modelling, 52, 400–407. https://doi.org/10.1016/j.econmod.2015.09.019
[12]. Galant, A., & Cadez, S. (2017). Corporate social responsibility and financial performance relationship: a review of measurement approaches. Economic Research-Ekonomska Istraživanja, 30(1), 676–693.
[13]. Lioui, A., & Sharma, Z. (2012). Environmental corporate social responsibility and financial performance: Disentangling direct and indirect effects. Ecological Economics, 78, 100–111. https://doi.org/10.1016/j.ecolecon.2012.04.004
[14]. Namazi, M., & Namazi, N.-R. (2016). Conceptual Analysis of Moderator and Mediator Variables in Business Research. Procedia Economics and Finance, 36, 540–554. https://doi.org/10.1016/s2212-5671(16)30064-8
[15]. Jamali, D., & Karam, C. (2016). Corporate Social Responsibility in Developing Countries as an Emerging Field of Study. International Journal of Management Reviews, 20(1), 32–61. https://doi.org/10.1111/ijmr.12112
[16]. Baird, P. L., Geylani, P. C., & Roberts, J. A. (2011). Corporate Social and Financial Performance Re-Examined: Industry Effects in a Linear Mixed Model Analysis. Journal of Business Ethics, 109(3), 367–388. https://doi.org/10.1007/s10551-011-1135-z
[17]. Lin, C.-S., Chang, R.-Y., & Dang, V. (2015). An Integrated Model to Explain How Corporate Social Responsibility Affects Corporate Financial Performance. Sustainability, 7(7), 8292–8311. https://doi.org/10.3390/su7078292
[18]. IEA, & IRENA. (2017). PERSPECTIVES FOR THE ENERGY TRANSITION Investment Needs for a Low-Carbon Energy System. International Renewable Energy Agency.
[19]. Adegbite, E., Guney, Y., Kwabi, F., & Tahir, S. (2018). Financial and corporate social performance in the UK listed firms: the relevance of non-linearity and lag effects. Review of Quantitative Finance and Accounting, 52(1), 105–158. https://doi.org/10.1007/s11156-018-0705-x
[20]. Bhattacharya, C. B., & Sen, S. (2004). Doing Better at Doing Good: When, Why, and How Consumers Respond to Corporate Social Initiatives. California Management Review, 47(1), 9–24. https://doi.org/10.2307/41166284
[21]. Hansen, B. E. (1999). Threshold effects in non-dynamic panels: Estimation, testing, and inference. Journal of Econometrics, 93(2), 345–368. https://doi.org/10.1016/s0304-4076(99)00025-1
[22]. Orlitzky, M., & Benjamin, J. D. (2001). Corporate Social Performance and Firm Risk: A Meta-Analytic Review. Business & Society, 40(4), 369–396. https://doi.org/10.1177/000765030104000402
[23]. McWilliams, A., & Siegel, D. (2000). Corporate social responsibility and financial performance: correlation or misspecification? Strategic Management Journal, 21(5), 603–609. https://doi.org/10.1002/(sici)1097-0266(200005)21:5%3C603::aid-smj101%3E3.0.co;2-3
[24]. Moore, G. (2001). Corporate Social and Financial Performance: An Investigation in the U.K. Supermarket Industry. Journal of Business Ethics, 34(3/4), 299–315. https://doi.org/10.1023/a:1012537016969
[25]. Huang, K., Sim, N., & Zhao, H. (2020). Corporate social responsibility, corporate financial performance and the confounding effects of economic fluctuations: A meta-analysis. International Review of Financial Analysis, 70, 101504. https://doi.org/10.1016/j.irfa.2020.101504
[26]. Hasan, I., Kobeissi, N., Liu, L., & Wang, H. (2016). Corporate Social Responsibility and Firm Financial Performance: The Mediating Role of Productivity. SSRN Electronic Journal, 149(3). https://doi.org/10.2139/ssrn.2768097
[27]. Orazalin, N., & Mahmood, M. (2021). Toward sustainable development: Board characteristics, country governance quality, and environmental performance. Business Strategy and the Environment, 30(8). https://doi.org/10.1002/bse.2820
[28]. Bose, S., Shams, S., Ali, M. J., & Mihret, D. (2021). COVID‐19 impact, sustainability performance and firm value: international evidence. Accounting & Finance, 62(1). https://doi.org/10.1111/acfi.12801